Skip to content
Noushin2024-04-09T13:57:50+01:00
Level Up Your Project Management in Tableau with WriteBackExtreme ExtensionsNoushin2024-04-09T13:57:50+01:00
Merlijn Buit2024-03-21T15:59:59+01:00
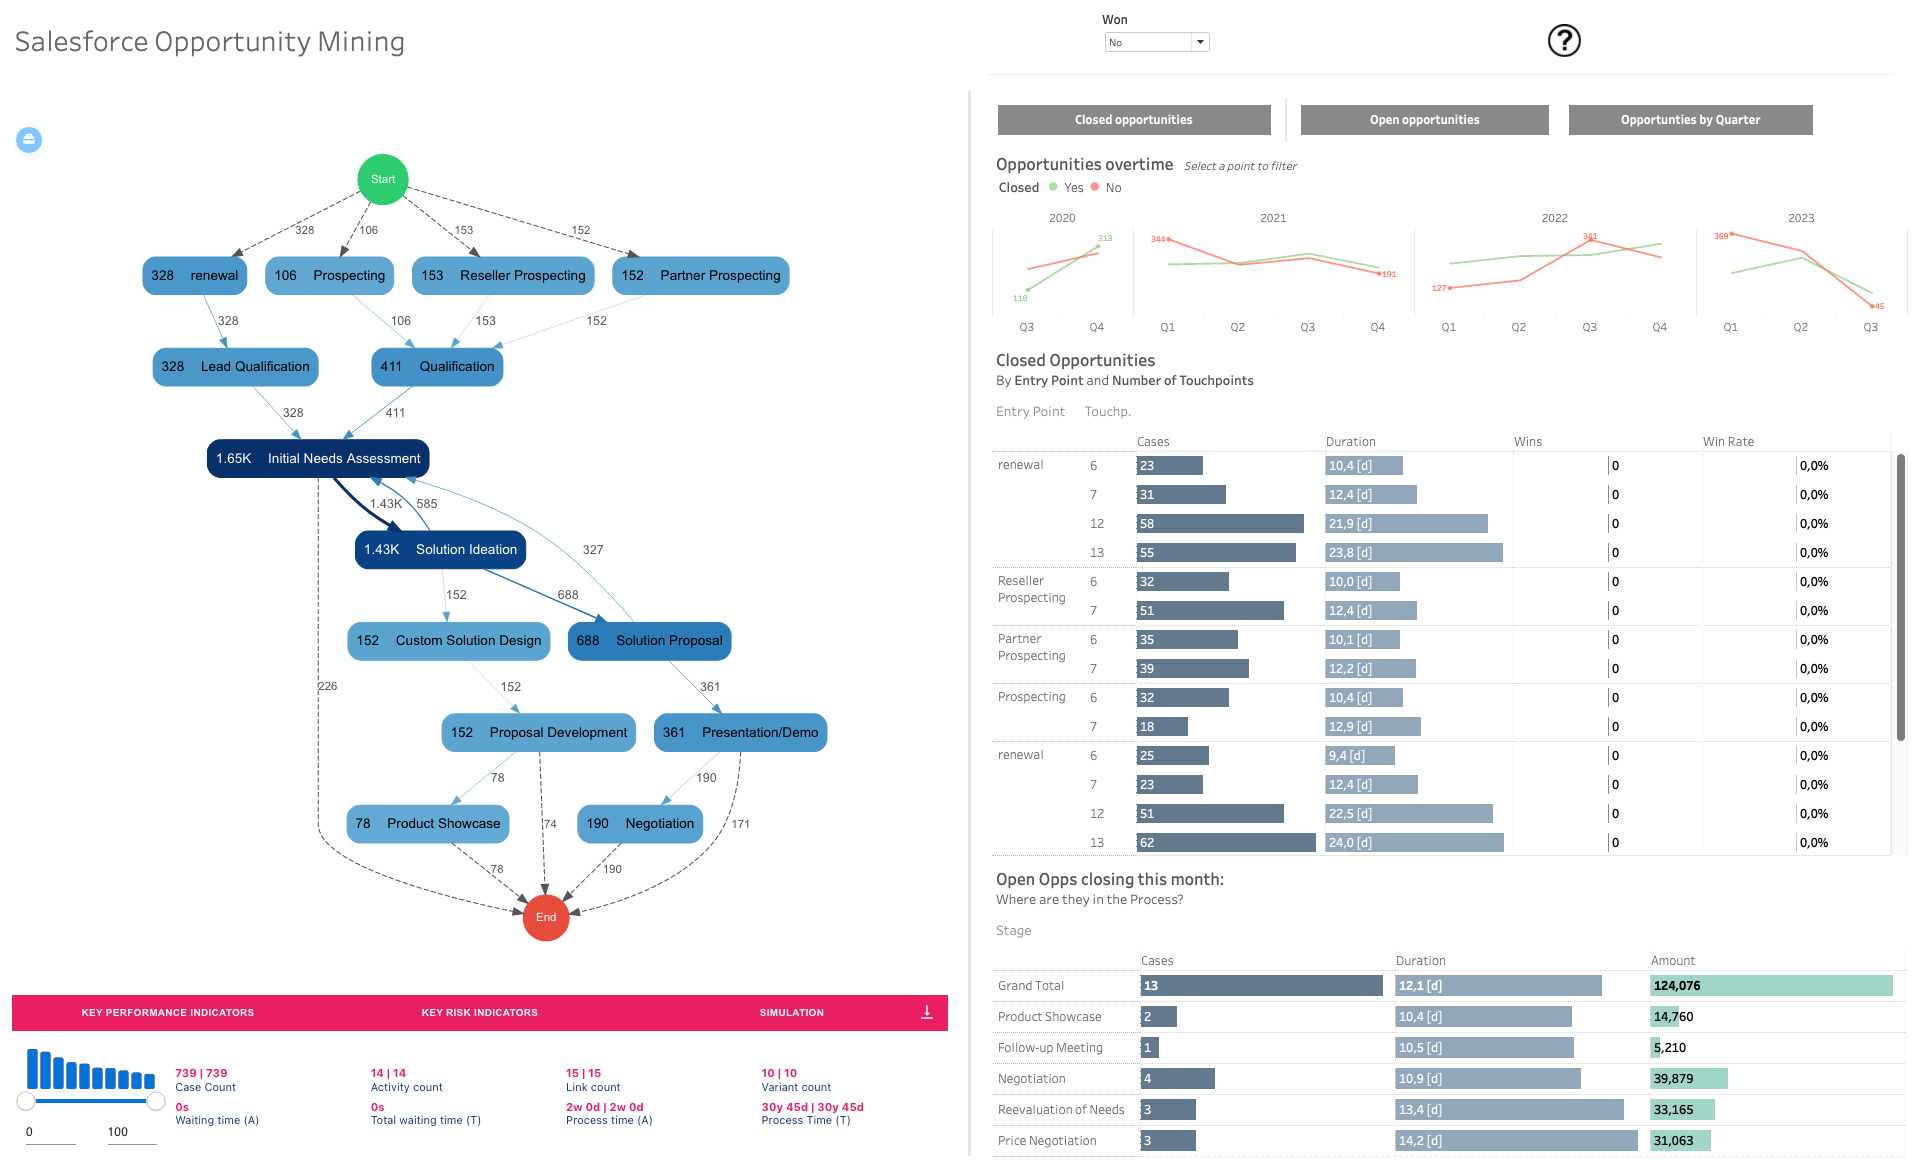
Salesforce Opportunity MiningMerlijn Buit2024-03-21T15:59:59+01:00
Noushin2024-03-26T10:03:37+01:00
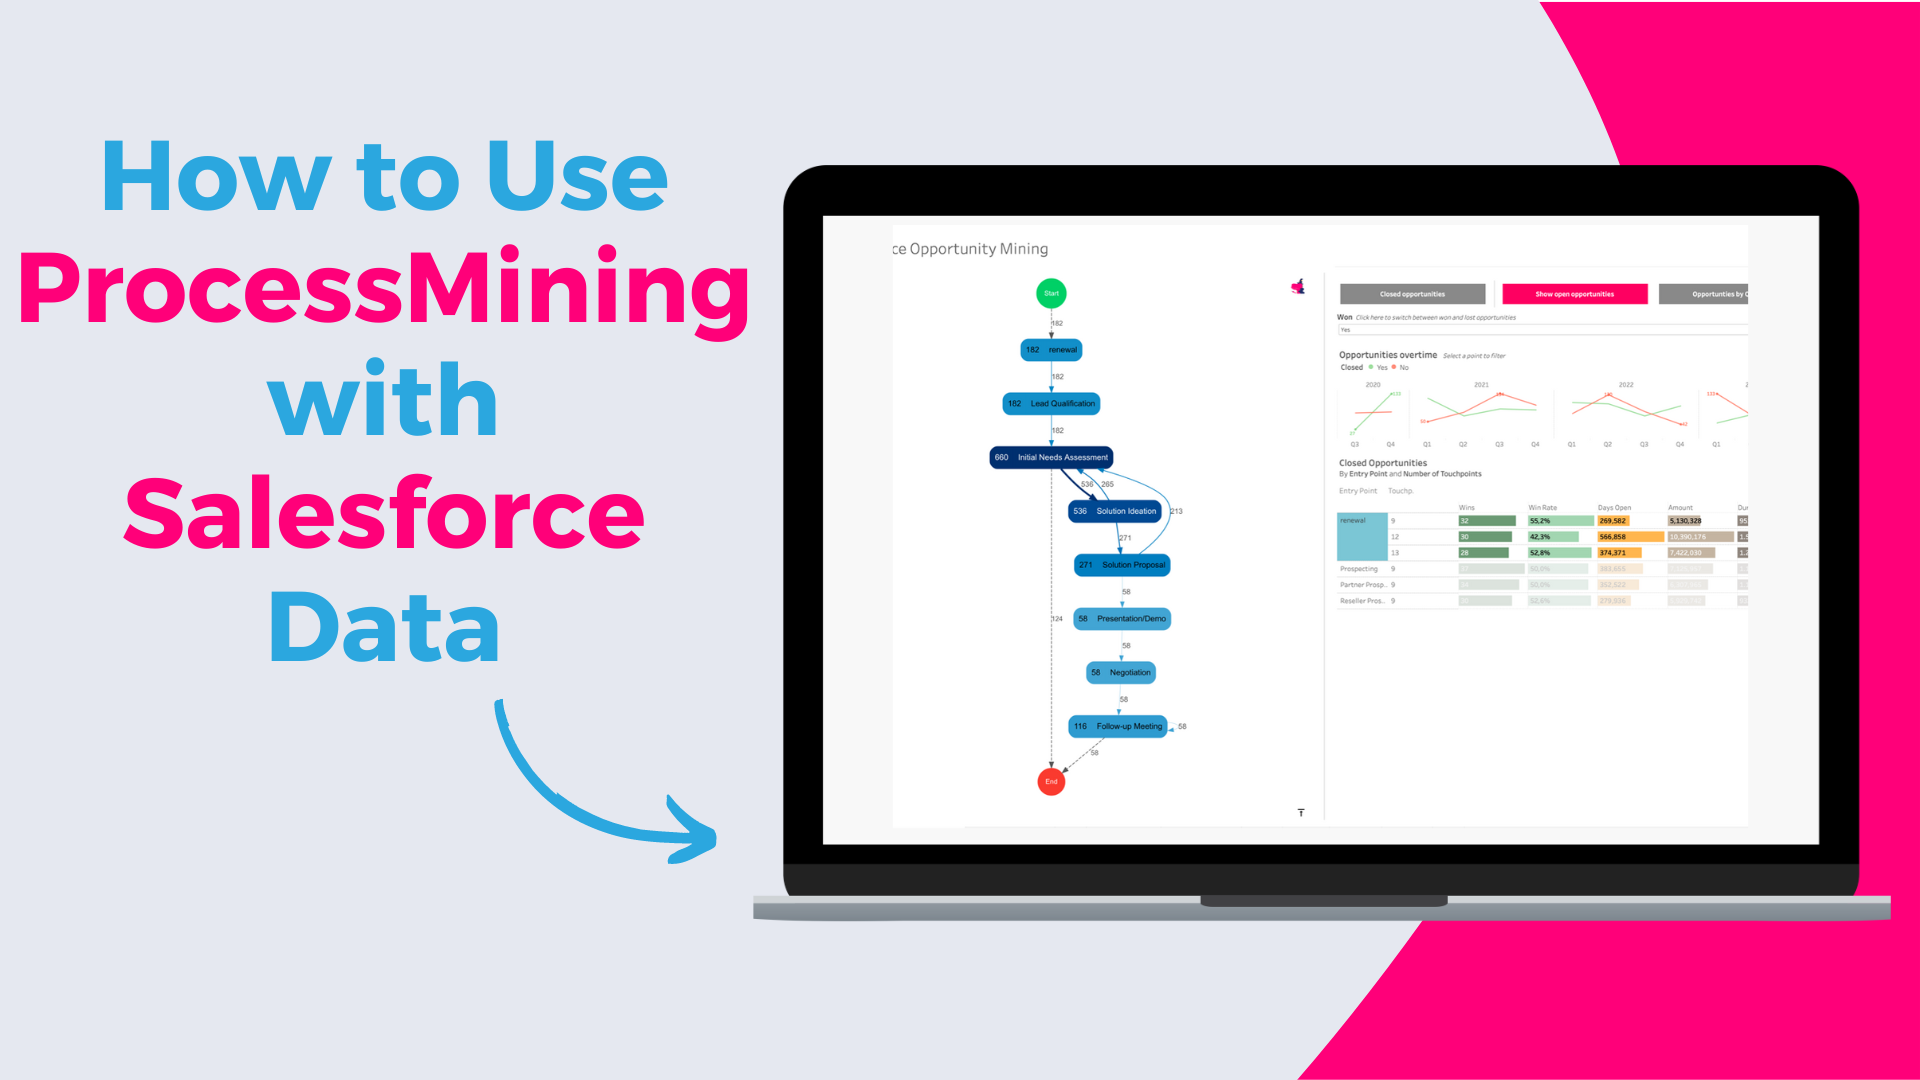
Explore New Opportunity With Salesforce and ProcessMiningNoushin2024-03-26T10:03:37+01:00
Noushin2024-03-08T11:17:11+01:00
Five Must-Try Viz Extensions to Solve Business ChallengesNoushin2024-03-08T11:17:11+01:00
Noushin2024-03-08T11:23:04+01:00
Level Up Your Quality Control Analysis with Powerful Tableau ExtensionsNoushin2024-03-08T11:23:04+01:00
Merlijn Buit2024-02-22T15:35:01+01:00
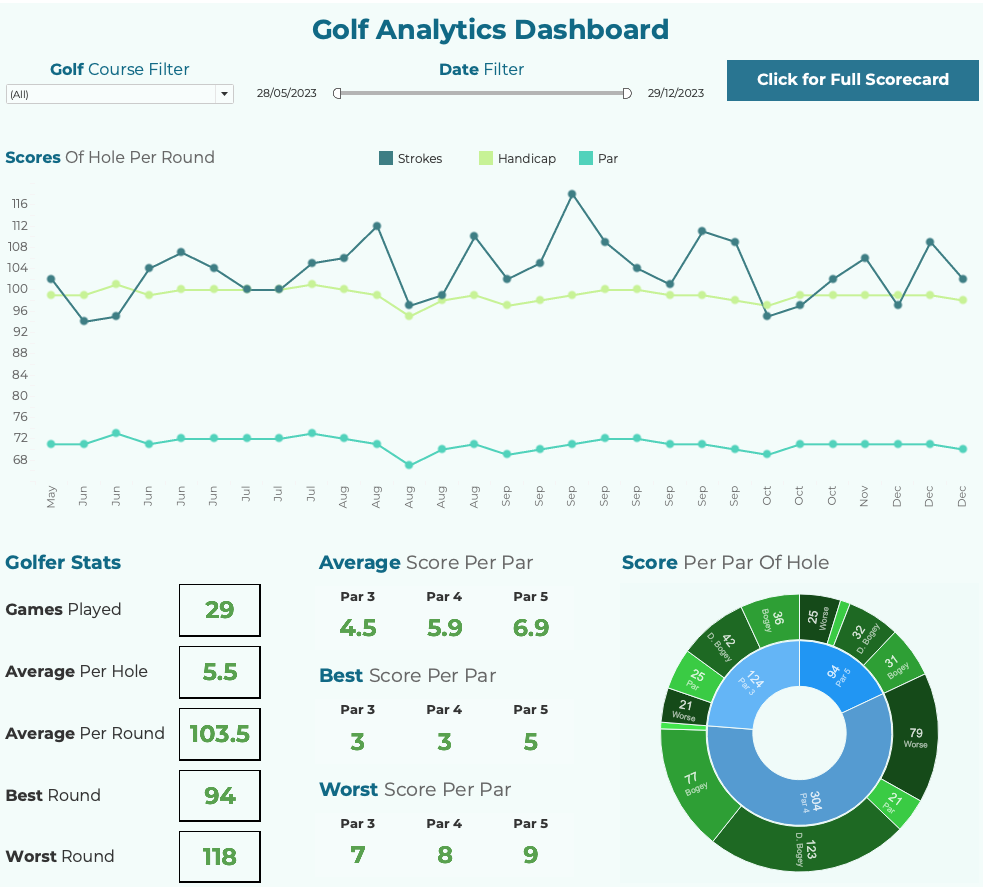
Golf DashboardMerlijn Buit2024-02-22T15:35:01+01:00
Noushin2024-02-23T16:32:21+01:00
A Practical Dive into Marketing Campaign Analysis with Tableau ExtensionsNoushin2024-02-23T16:32:21+01:00
Noushin2024-03-06T10:08:20+01:00
Everything you need to know about Tableau Viz ExtensionsNoushin2024-03-06T10:08:20+01:00
Noushin2024-03-14T11:12:43+01:00
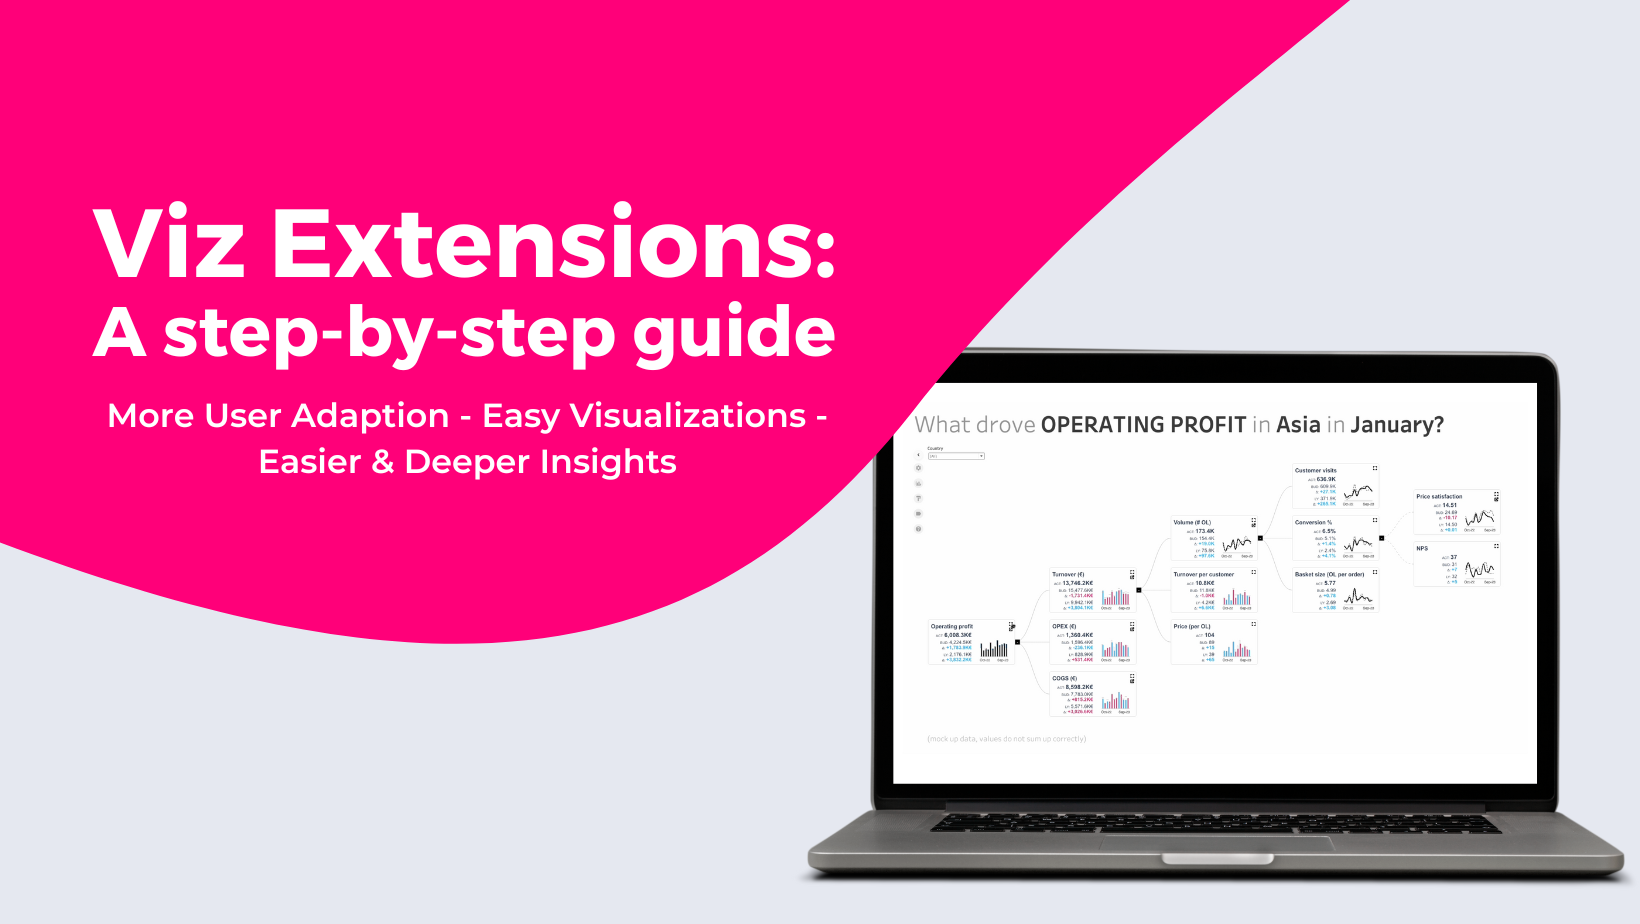
A Step-by-Step Guide to Tableau Viz ExtensionsNoushin2024-03-14T11:12:43+01:00
Merlijn Buit2024-02-06T14:01:56+01:00
SuperTables 4.0 launched!Merlijn Buit2024-02-06T14:01:56+01:00
Noushin2024-02-23T16:33:02+01:00
An Innovative Approach to Agriculture Data with Intuitive Tableau ExtensionsNoushin2024-02-23T16:33:02+01:00
Noushin2024-02-23T16:33:10+01:00
Navigating Workforce Dynamics with Our Innovative Tableau SolutionNoushin2024-02-23T16:33:10+01:00
Noushin2023-12-21T16:03:03+01:00
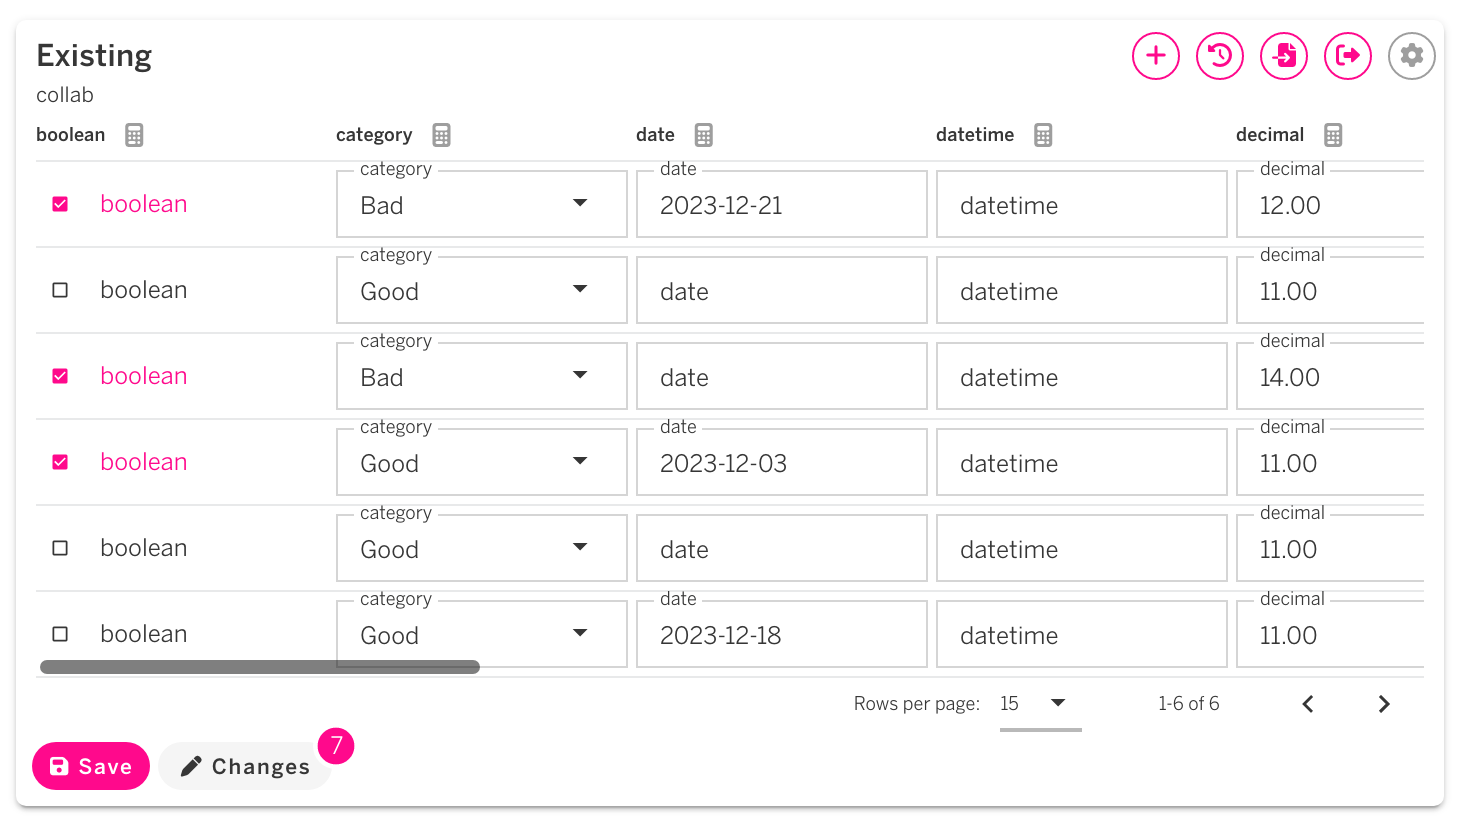
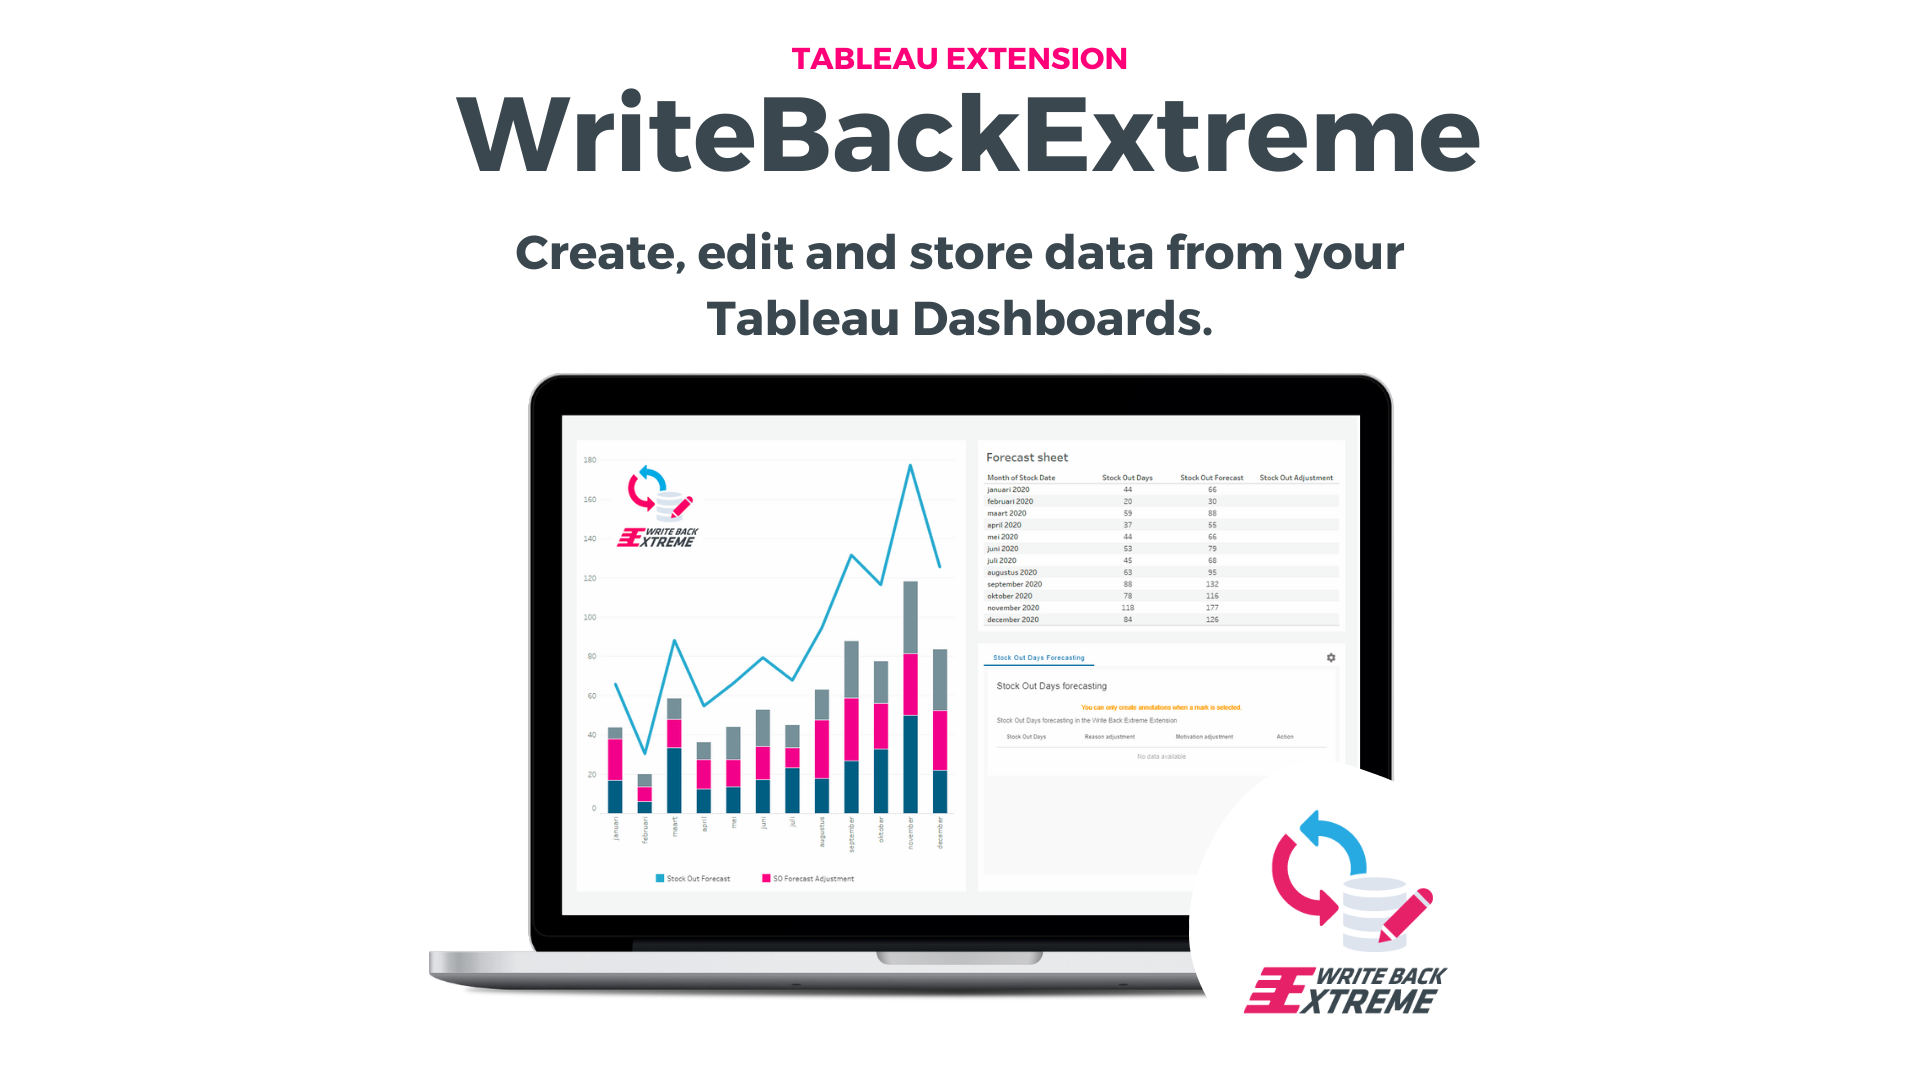
WriteBackExtreme 4.0 has launched!Noushin2023-12-21T16:03:03+01:00
Jenne Morsink2023-12-21T11:21:02+01:00
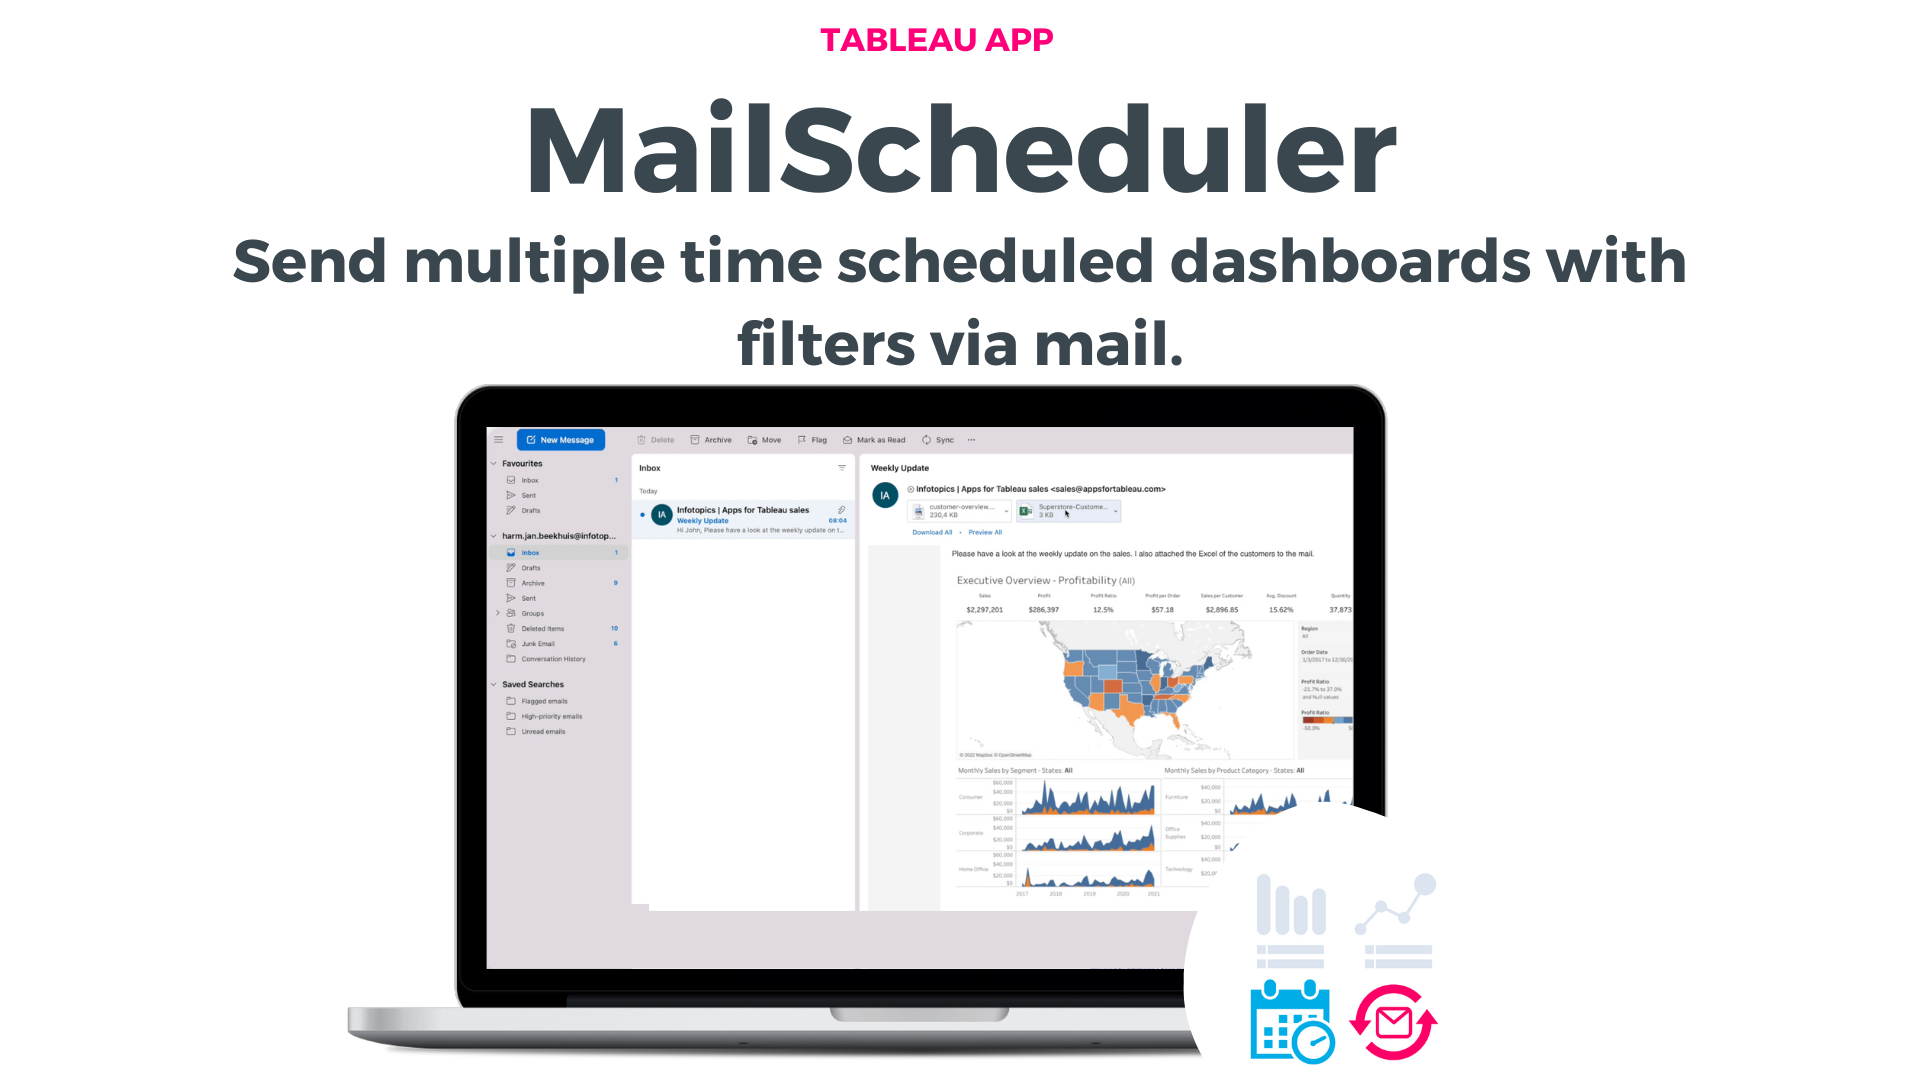
MailScheduler 3.0 with the one-click installer, complete UI redesign and moreJenne Morsink2023-12-21T11:21:02+01:00
Merlijn Buit2023-12-20T14:26:55+01:00
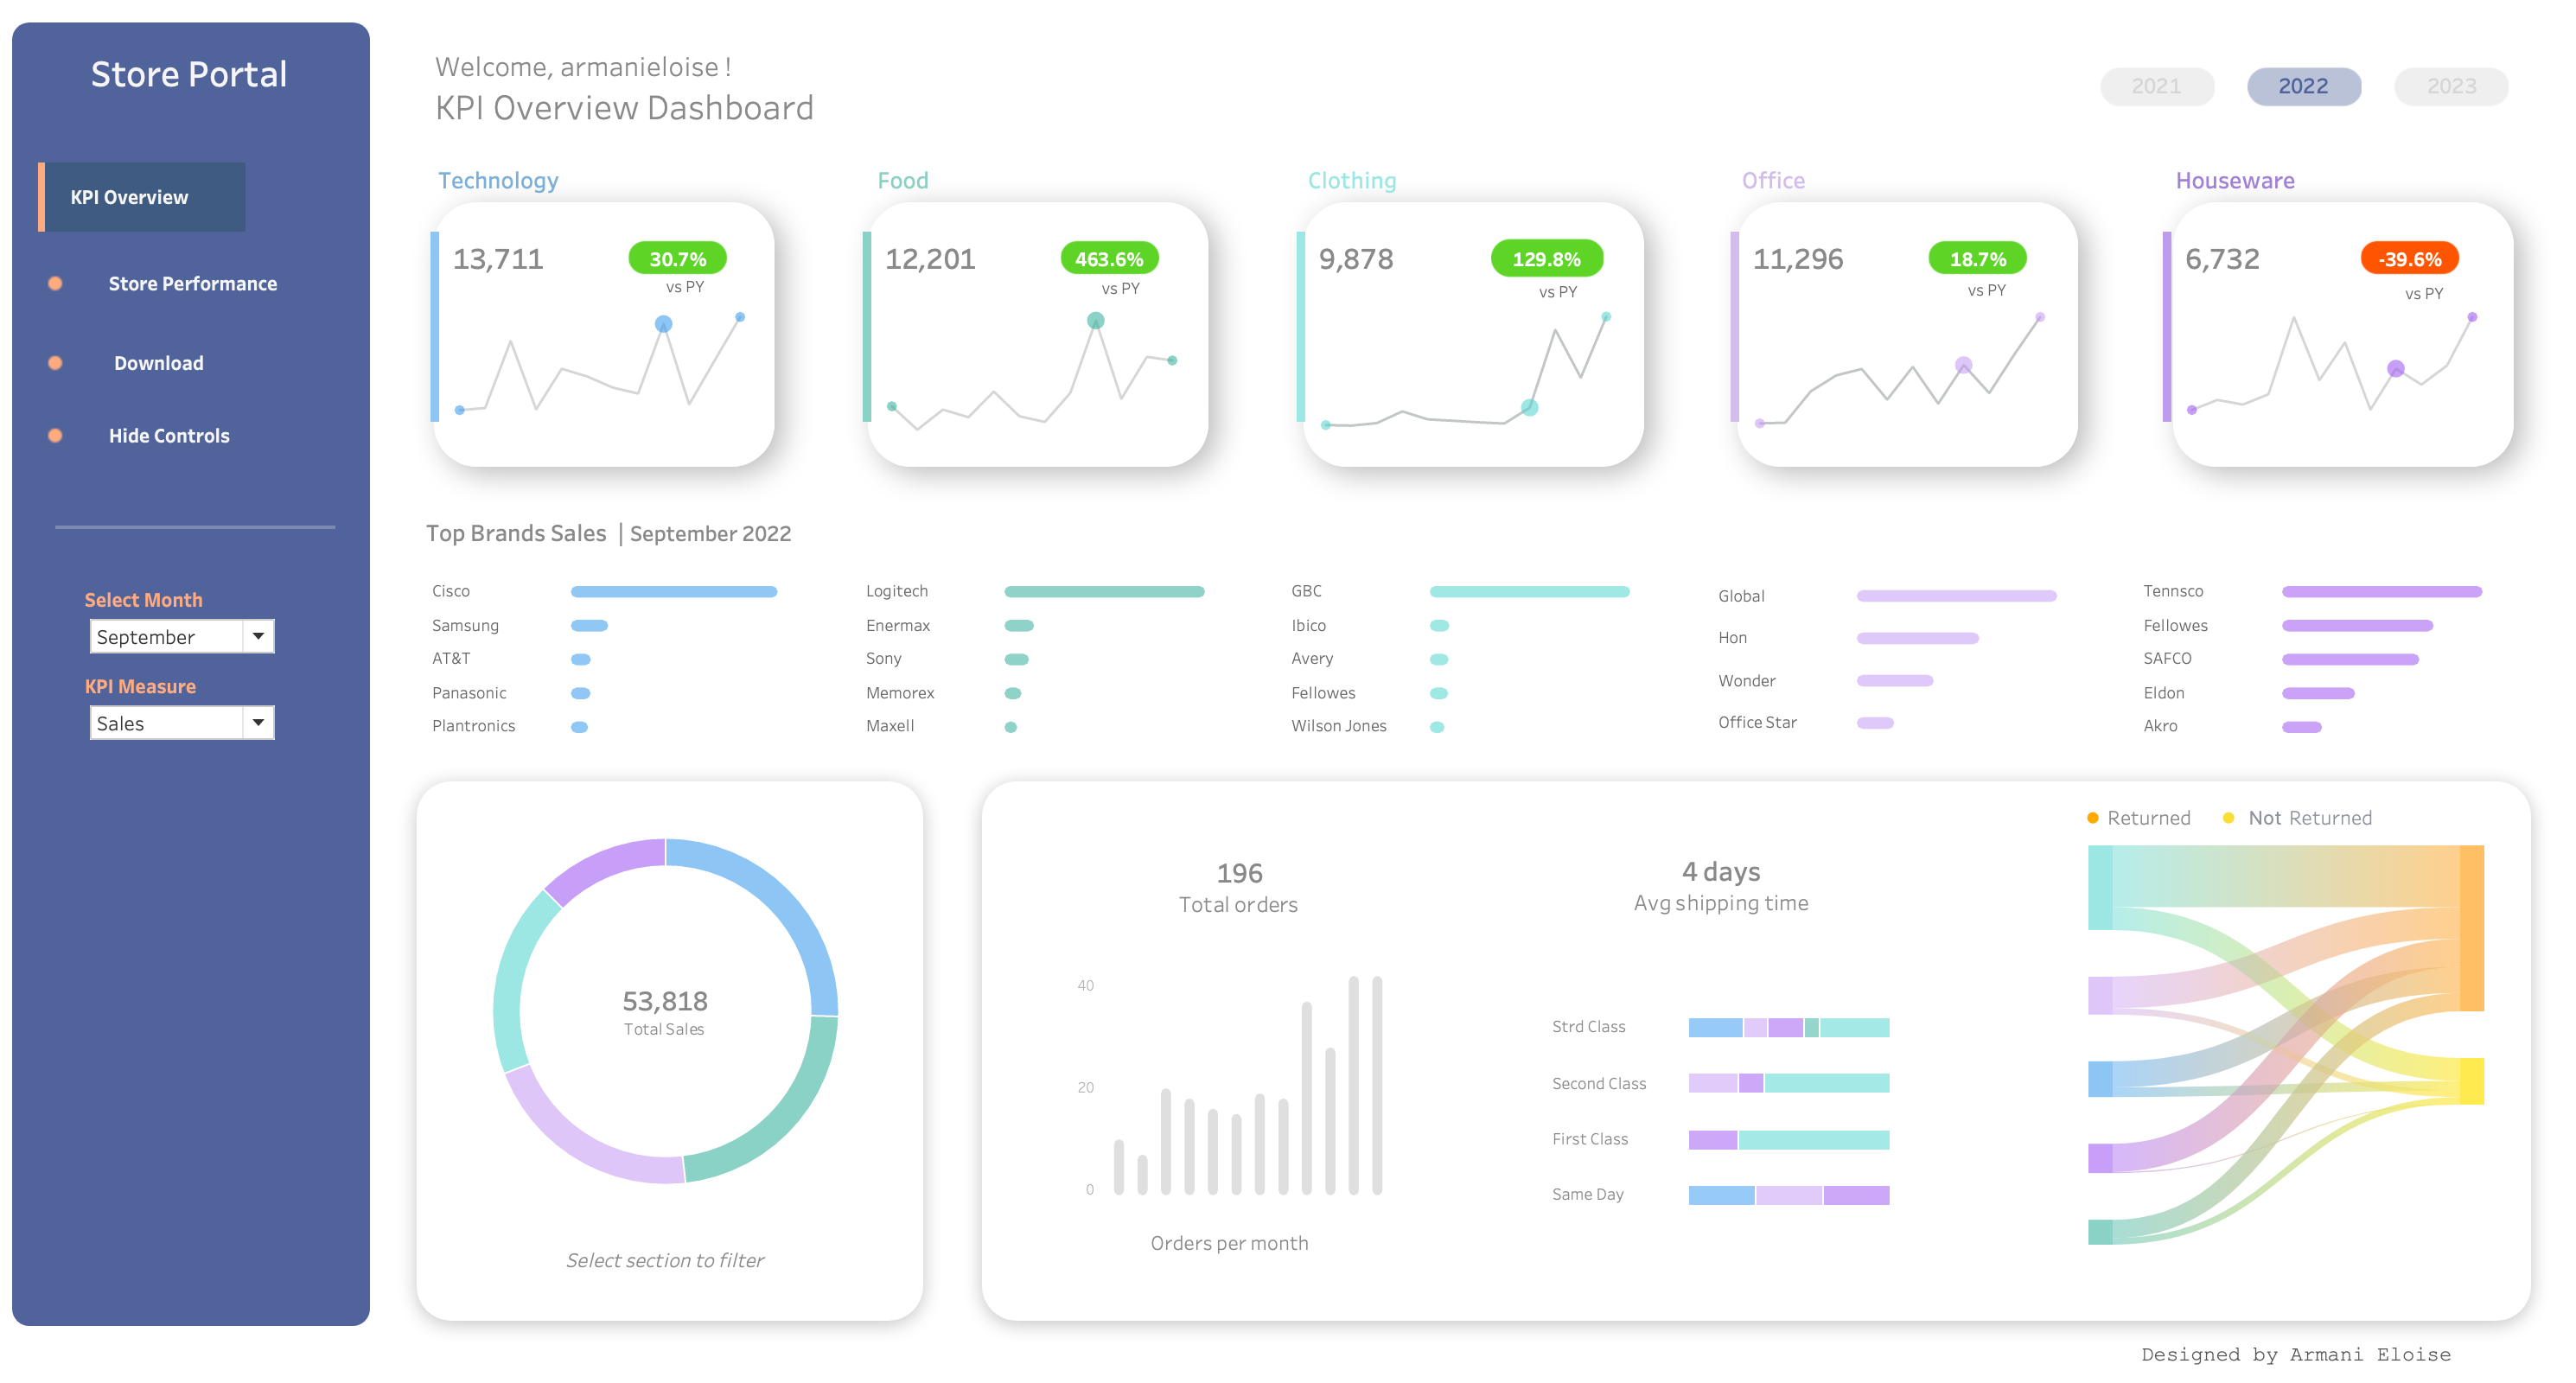
Retail Store PortalMerlijn Buit2023-12-20T14:26:55+01:00
Merlijn Buit2023-12-19T13:58:39+01:00
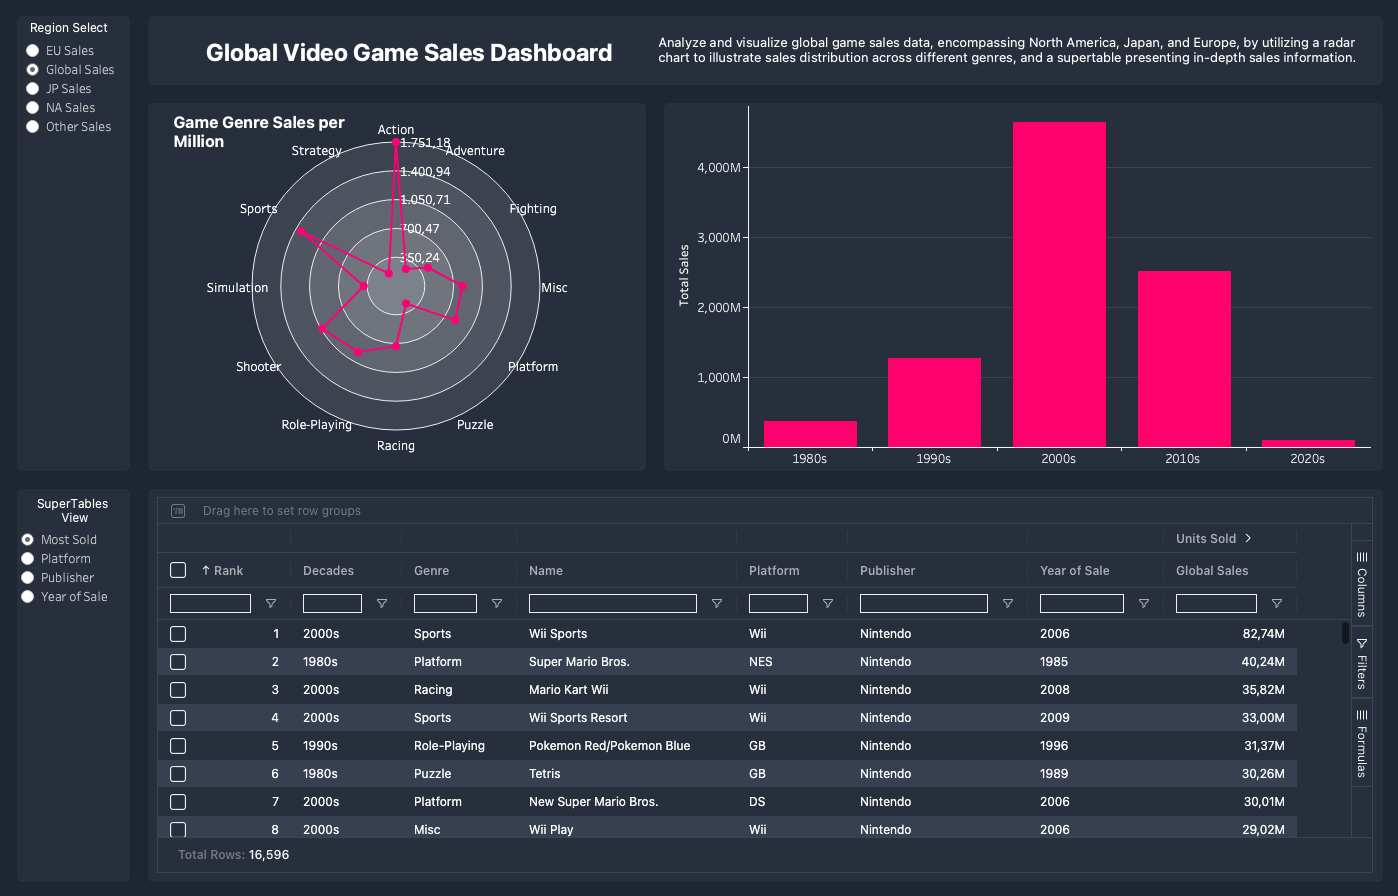
Global Video Game SalesMerlijn Buit2023-12-19T13:58:39+01:00
Merlijn Buit2023-12-13T09:10:27+01:00
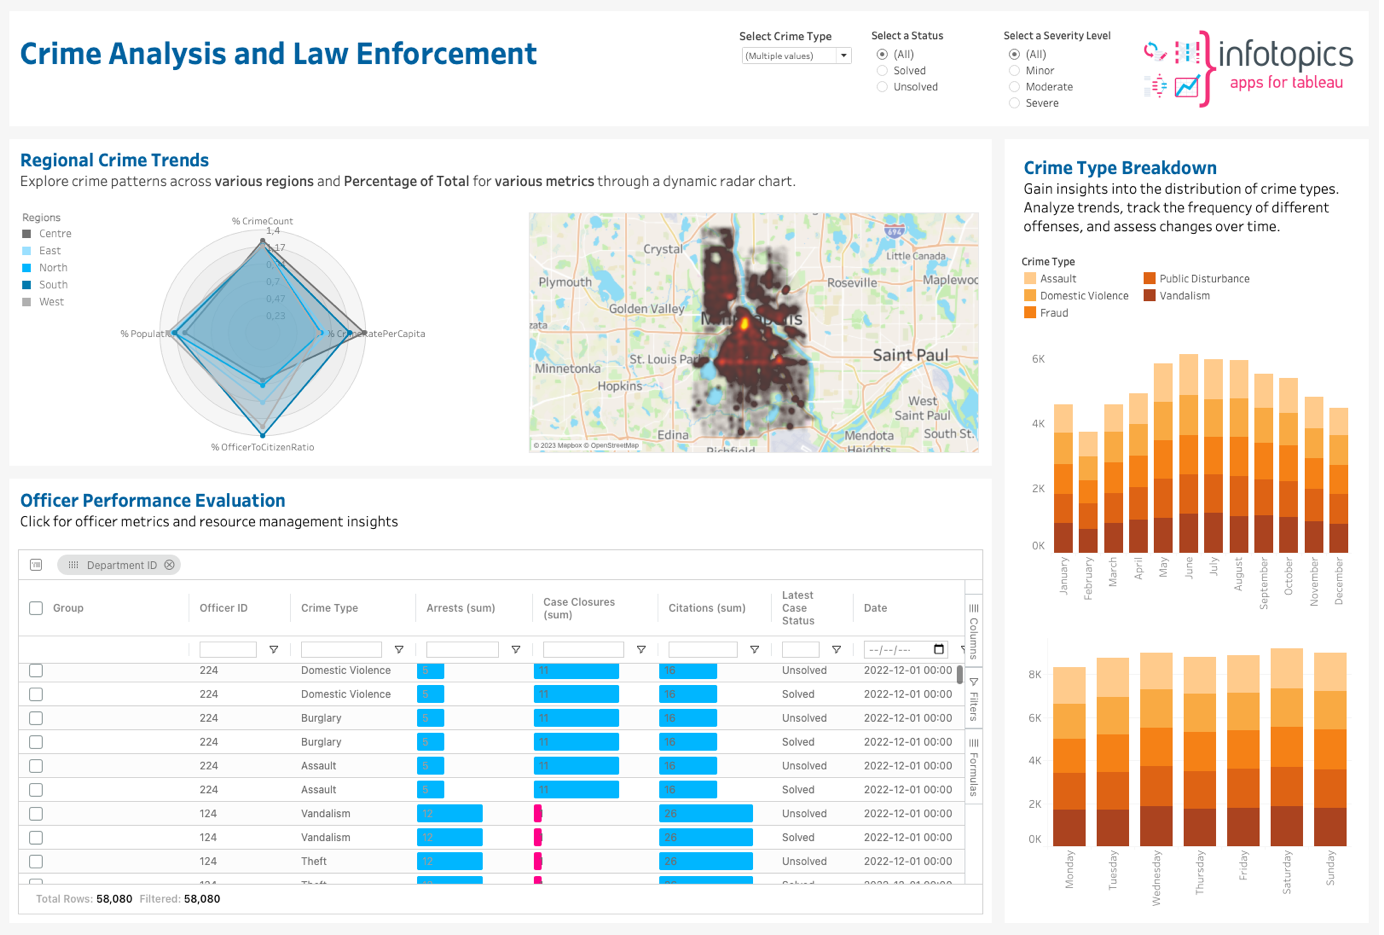
Crime managementMerlijn Buit2023-12-13T09:10:27+01:00
Merlijn Buit2023-12-13T09:09:56+01:00
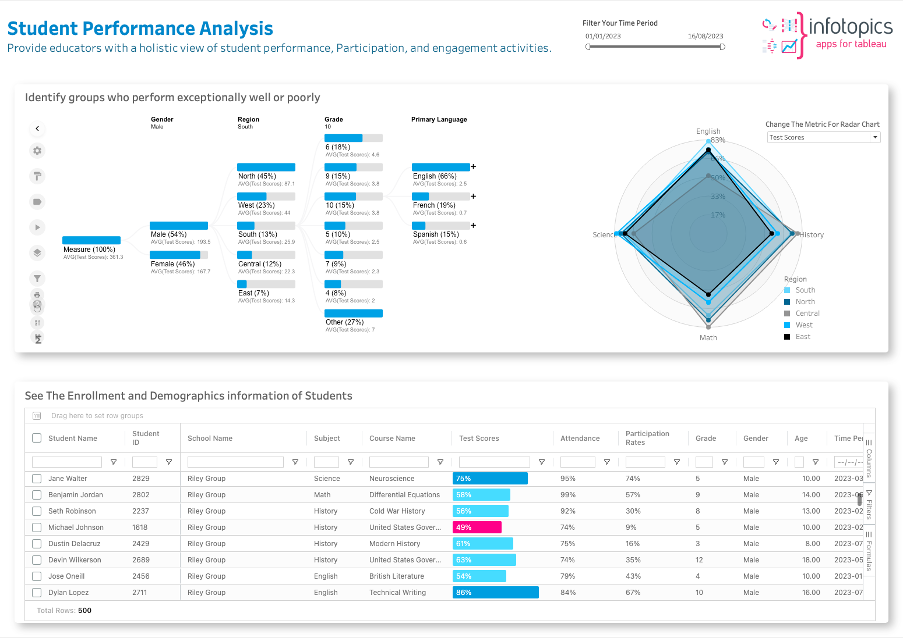
Education Performance AnalysisMerlijn Buit2023-12-13T09:09:56+01:00
Merlijn Buit2023-12-13T09:09:26+01:00
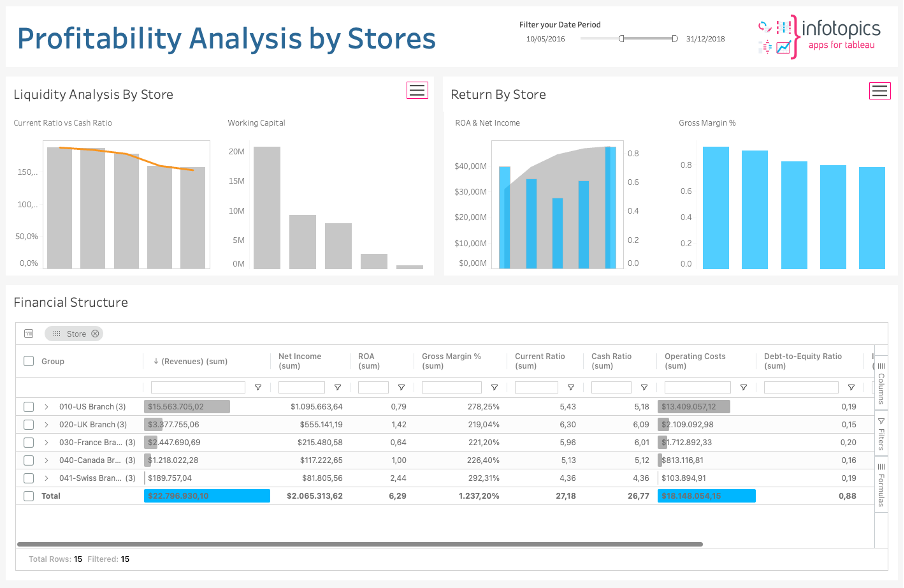
Financial StatementsMerlijn Buit2023-12-13T09:09:26+01:00
Merlijn Buit2023-12-13T08:55:00+01:00
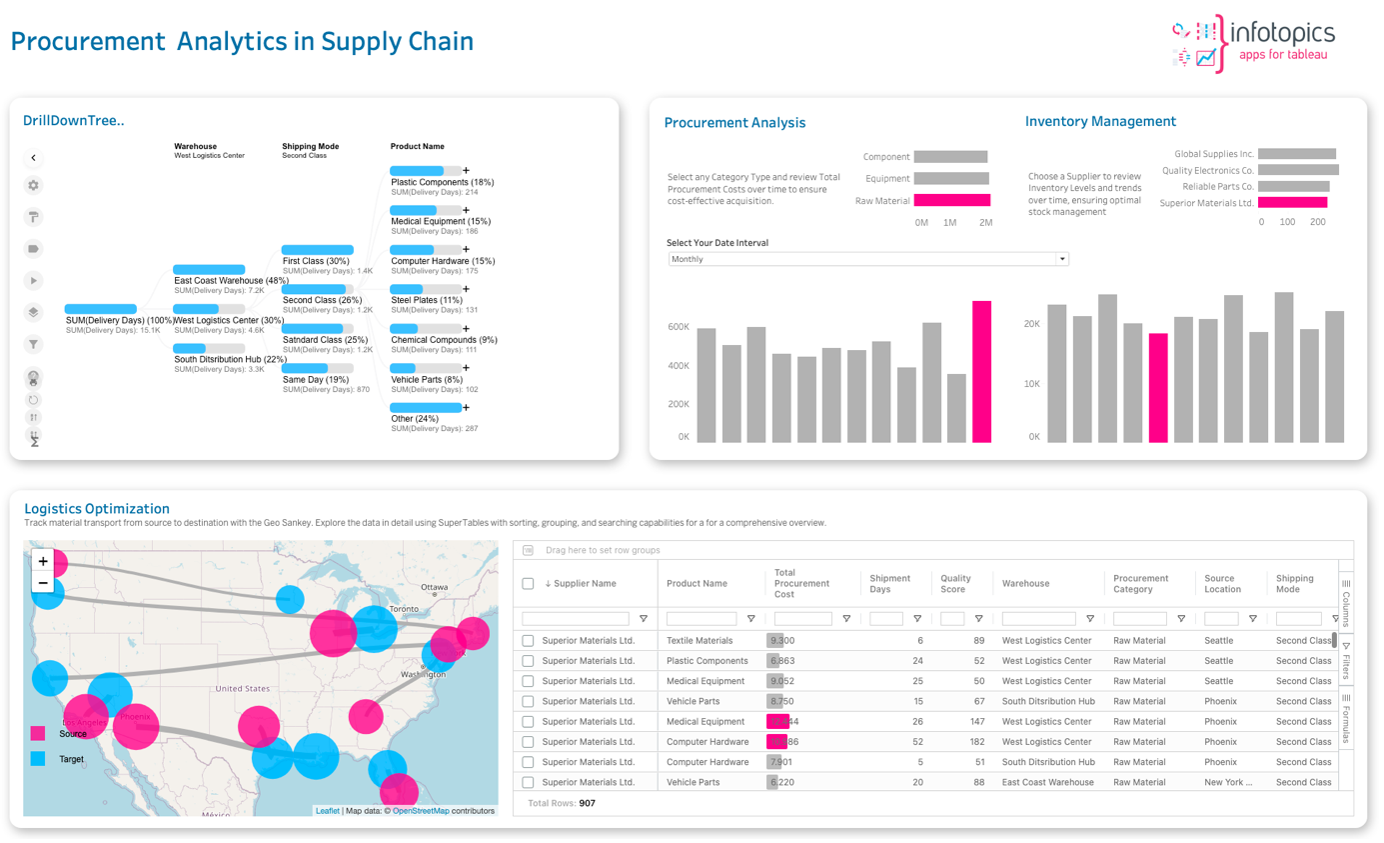
Procurement Analysis in Supply-ChainMerlijn Buit2023-12-13T08:55:00+01:00
Merlijn Buit2023-12-13T08:52:37+01:00
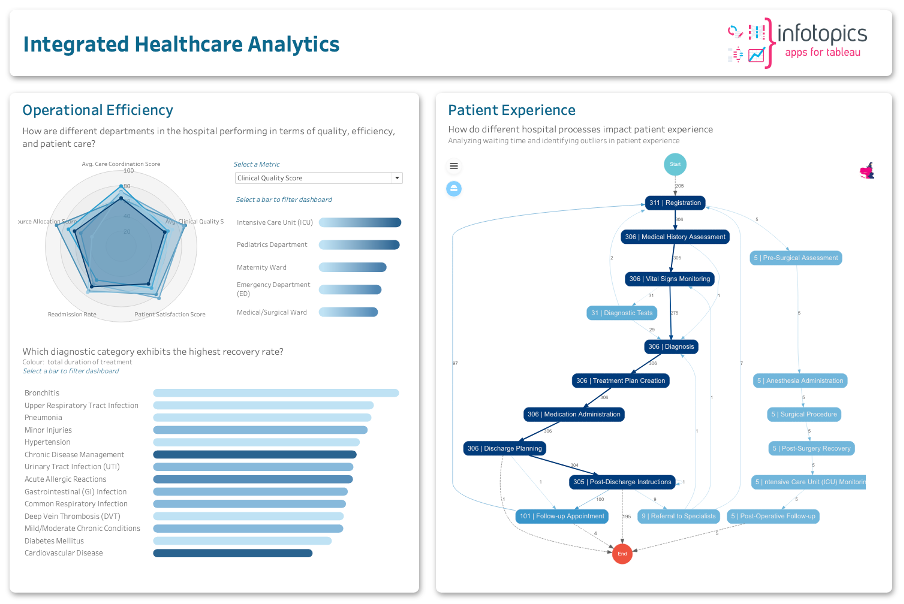
Integrated Healthcare AnalyticsMerlijn Buit2023-12-13T08:52:37+01:00
Noushin2024-01-09T16:31:35+01:00
The Power of Extensions in Supply Chain Analytics in TableauNoushin2024-01-09T16:31:35+01:00
Jenne Morsink2024-01-30T13:51:10+01:00
AnalytixLive: Embracing Data-Driven InnovationJenne Morsink2024-01-30T13:51:10+01:00
Jenne Morsink2023-12-01T10:32:56+01:00
VizIt Berlin 2023: Apps for Tableau RecapJenne Morsink2023-12-01T10:32:56+01:00
Noushin2023-12-01T11:07:47+01:00
Recon Analytics: Next-level visualizations and insights for +8k clients in just minutesNoushin2023-12-01T11:07:47+01:00
Jenne Morsink2023-11-17T10:05:53+01:00
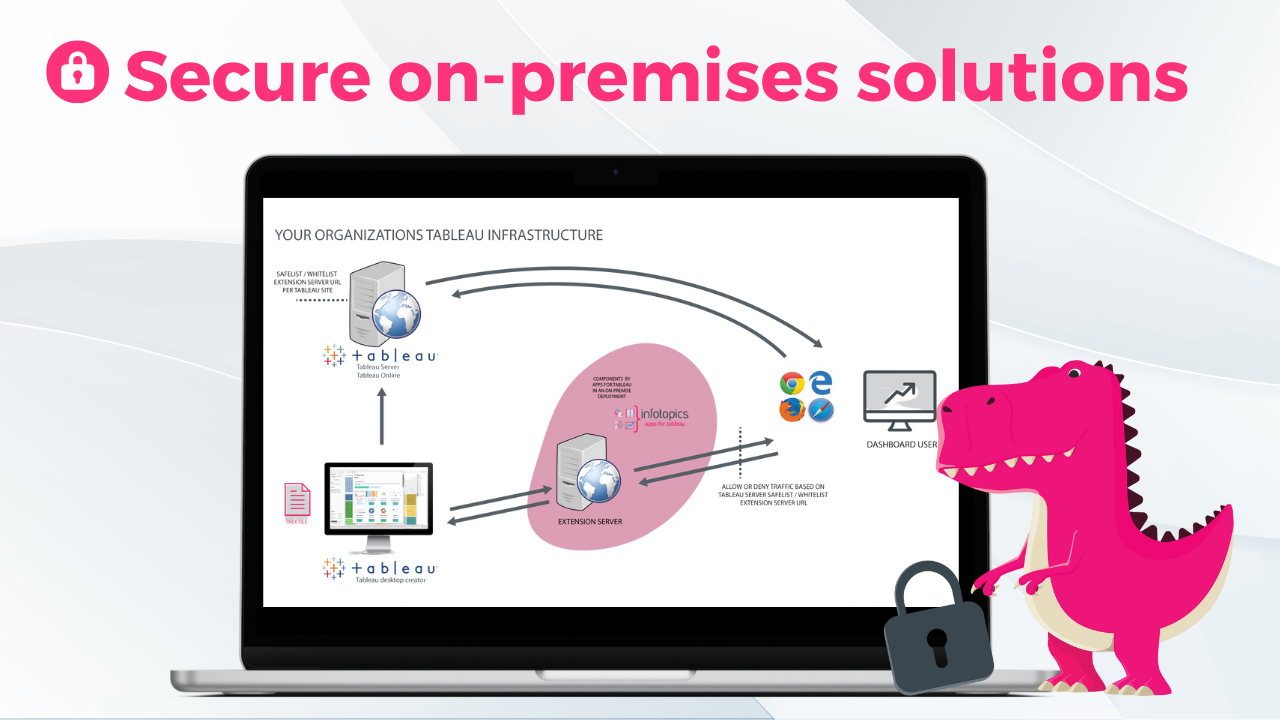
Smooth Transition: Migrating Your Tableau Extensions from Server to CloudJenne Morsink2023-11-17T10:05:53+01:00
Noushin2023-11-16T11:22:10+01:00
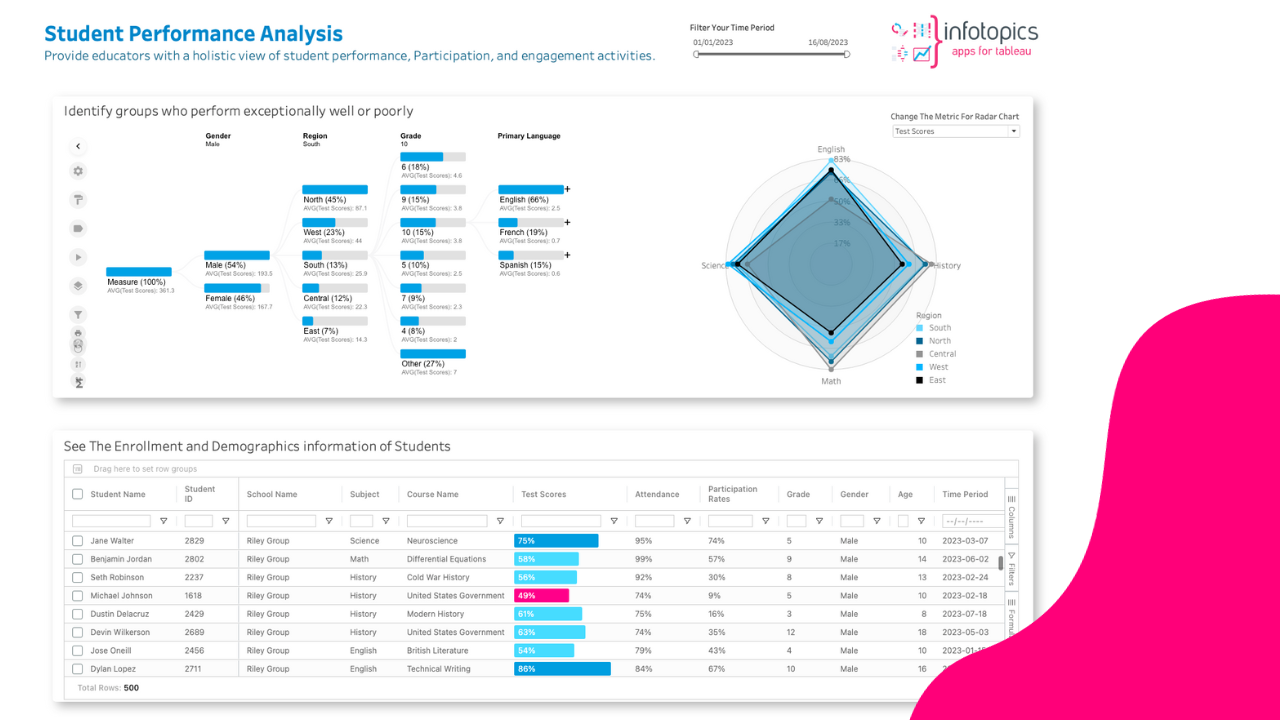
Tableau Extensions in Education: How they are Transforming the IndustryNoushin2023-11-16T11:22:10+01:00
Noushin2023-11-27T11:53:33+01:00
Elevate Your Marketing Campaigns with the Power of Tableau SolutionsNoushin2023-11-27T11:53:33+01:00
Noushin2023-10-19T09:27:37+01:00
Transforming Fraud Detection Solutions: Unveiling the Power of Tableau ExtensionsNoushin2023-10-19T09:27:37+01:00
Jenne Morsink2023-10-12T09:03:12+01:00
Introducing the Game-Changer: ExtensionsManagerJenne Morsink2023-10-12T09:03:12+01:00
Noushin2023-10-12T12:04:51+01:00
Empowering Law Enforcement: The Dynamic Crime Management DashboardNoushin2023-10-12T12:04:51+01:00
Jenne Morsink2023-10-12T14:01:17+01:00
Announcing the New One-Click Installer for WriteBackExtreme 3.0Jenne Morsink2023-10-12T14:01:17+01:00
Jenne Morsink2024-04-15T10:10:18+01:00
Tradesmith innovating in the fast-paced world of fintech with ShowMeMoreJenne Morsink2024-04-15T10:10:18+01:00
Jenne Morsink2023-09-08T14:12:55+01:00
Become the Marketing Manager of Apps for TableauJenne Morsink2023-09-08T14:12:55+01:00
Jenne Morsink2024-04-15T10:12:28+01:00
TU Delft enhanced Dashboard and Data Stories with ShowMeMoreJenne Morsink2024-04-15T10:12:28+01:00
Jenne Morsink2024-01-30T13:57:36+01:00
How Rippleworx empowered Data-driven Decision Making with ShowMeMoreJenne Morsink2024-01-30T13:57:36+01:00
Siebe Grijpma2023-08-04T14:19:38+01:00
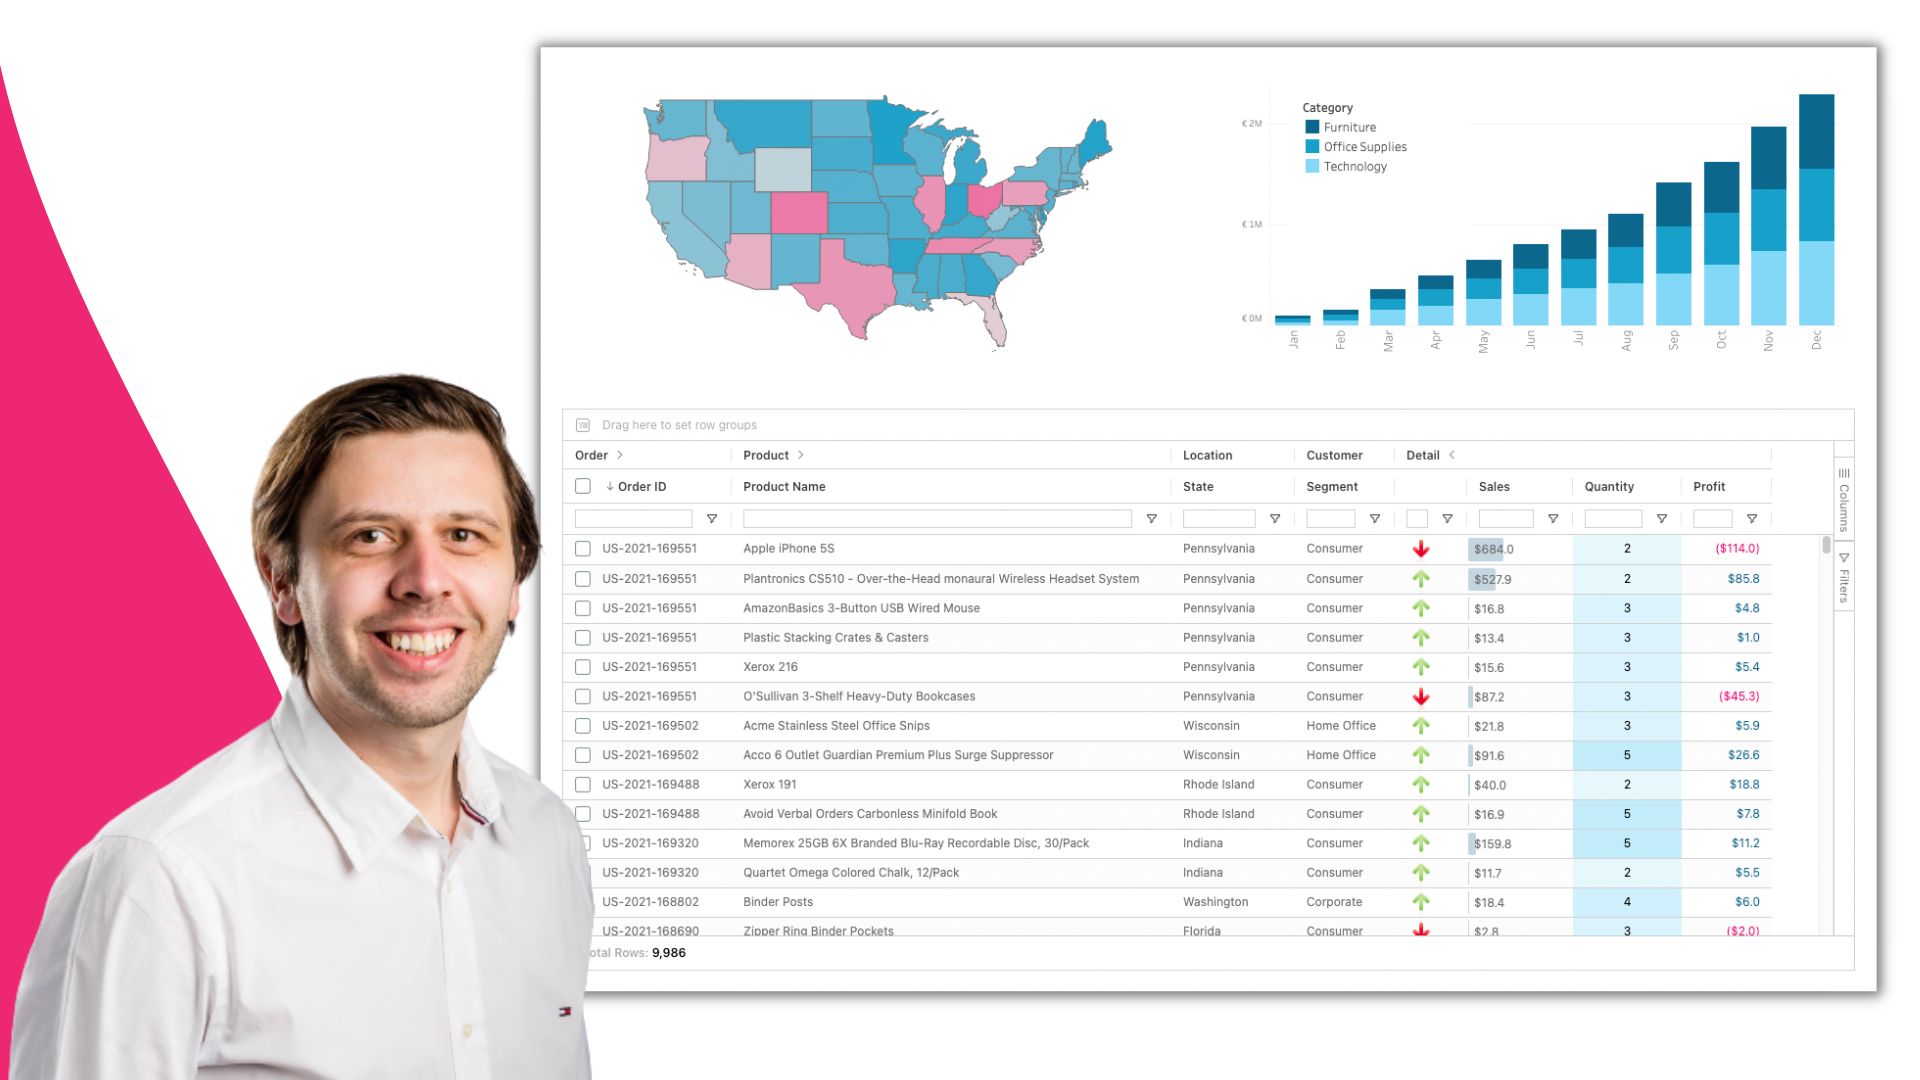
SuperTables 3.4 with End-User Formulas, If-Else Calculations, and TooltipsSiebe Grijpma2023-08-04T14:19:38+01:00
Noushin2023-11-22T14:37:53+01:00
How Tableau Extensions Supercharge your Analytics?Noushin2023-11-22T14:37:53+01:00
Vincent Cruickshank2023-07-20T09:15:52+01:00
Maximizing Data Potential RecapVincent Cruickshank2023-07-20T09:15:52+01:00
Jenne Morsink2024-04-15T10:19:06+01:00
How Cooper performed a Plan-Do-Check-Act in Tableau Dashboards with WriteBackExtremeJenne Morsink2024-04-15T10:19:06+01:00
Jenne Morsink2023-07-17T13:45:33+01:00
Apps for Tableau join forces with DKM Ecosystem to deliver Advanced Analytics Solutions in the Asia-Pacific RegionJenne Morsink2023-07-17T13:45:33+01:00
Jenne Morsink2024-04-15T10:21:12+01:00
Pro Juventute’s Success in Visualizing User Behaviour and Donations through ShowMeMoreJenne Morsink2024-04-15T10:21:12+01:00
Vincent Cruickshank2023-07-12T11:46:26+01:00
Apps for Tableau presenting at Tableau Conference 2023Vincent Cruickshank2023-07-12T11:46:26+01:00
Merlijn Buit2023-07-12T11:48:25+01:00
WriteBackExtreme 2.4.0 has launched!Merlijn Buit2023-07-12T11:48:25+01:00
Jenne Morsink2023-07-12T11:51:53+01:00
Tableau Conference 2023 HighlightsJenne Morsink2023-07-12T11:51:53+01:00
Jenne Morsink2024-02-28T16:58:35+01:00
Learn the differences between Share and Enterprise subscriptionsJenne Morsink2024-02-28T16:58:35+01:00
Jenne Morsink2023-11-13T10:06:52+01:00
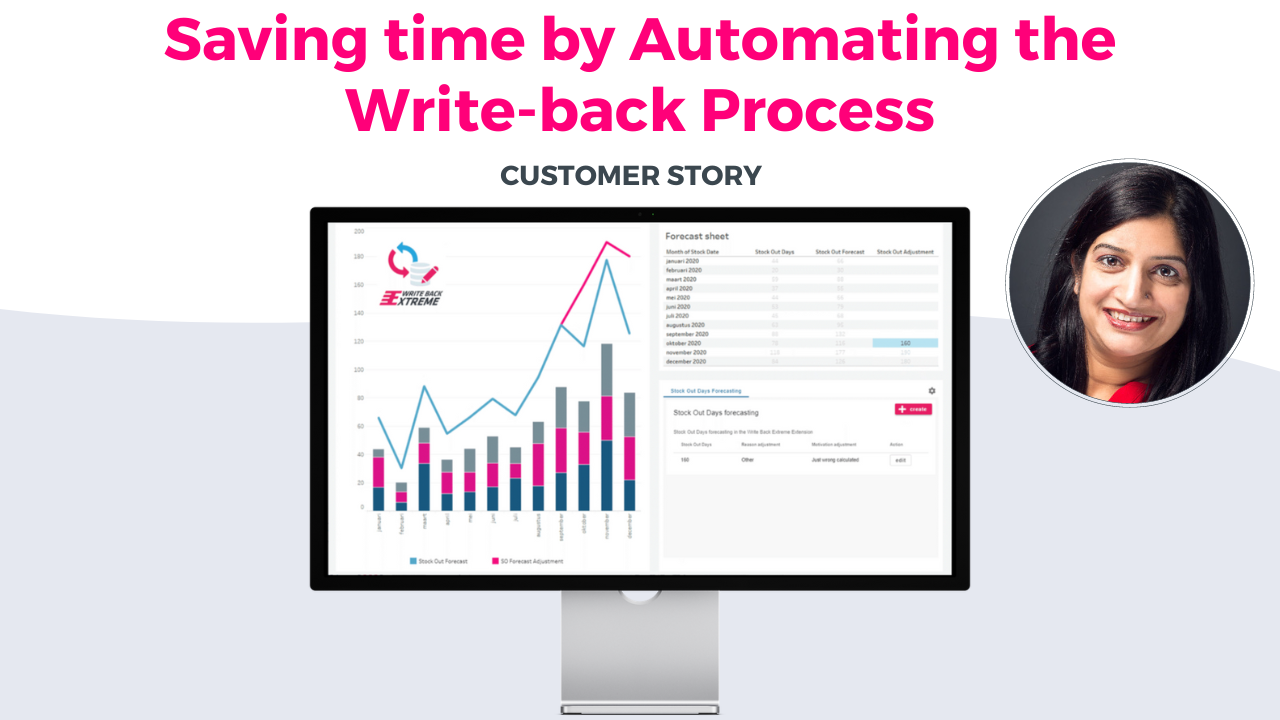
How Automating the Write-back Process in Tableau Save Your Time?Jenne Morsink2023-11-13T10:06:52+01:00
Noushin2023-07-13T08:00:37+01:00
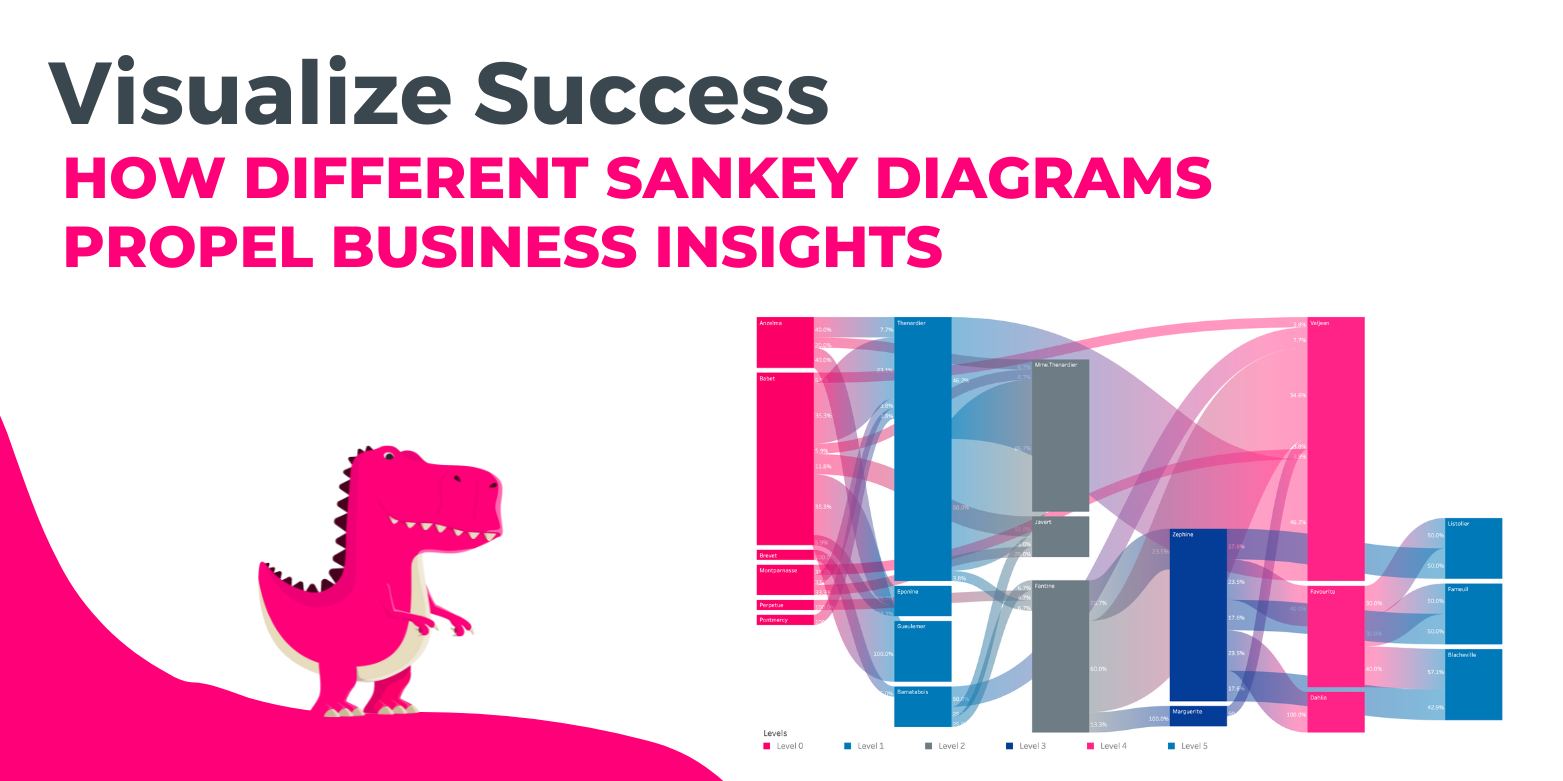
Visualize Success: How Different Sankey Diagrams Propel Business InsightsNoushin2023-07-13T08:00:37+01:00
Merlijn Buit2023-07-13T08:00:17+01:00
WriteBackExtreme 2.3.0Merlijn Buit2023-07-13T08:00:17+01:00
Noushin2024-02-01T15:47:00+01:00
Tips and tricks for using Tableau ExtensionsNoushin2024-02-01T15:47:00+01:00
Jenne Morsink2024-04-15T10:23:53+01:00
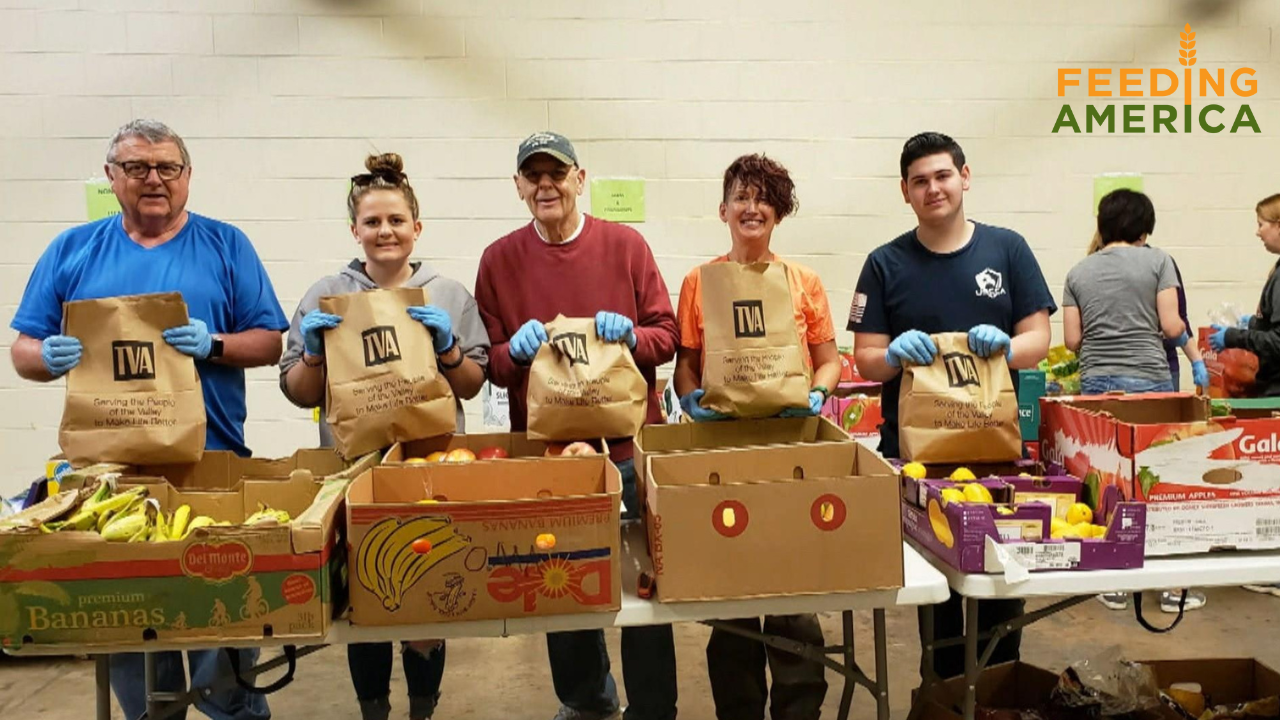
How Feeding America saved time and got easy insights using SuperTables in flexible, self-service Tableau dashboardsJenne Morsink2024-04-15T10:23:53+01:00
Noushin2023-07-13T07:59:47+01:00
How to Improve Your Audience Acceptance While Presenting Your DashboardsNoushin2023-07-13T07:59:47+01:00
Jenne Morsink2023-07-13T07:59:31+01:00
Merlijn Buit selected as Tableau Visionary for the fifth time!Jenne Morsink2023-07-13T07:59:31+01:00
Anirudh Somadas2023-07-13T07:59:11+01:00
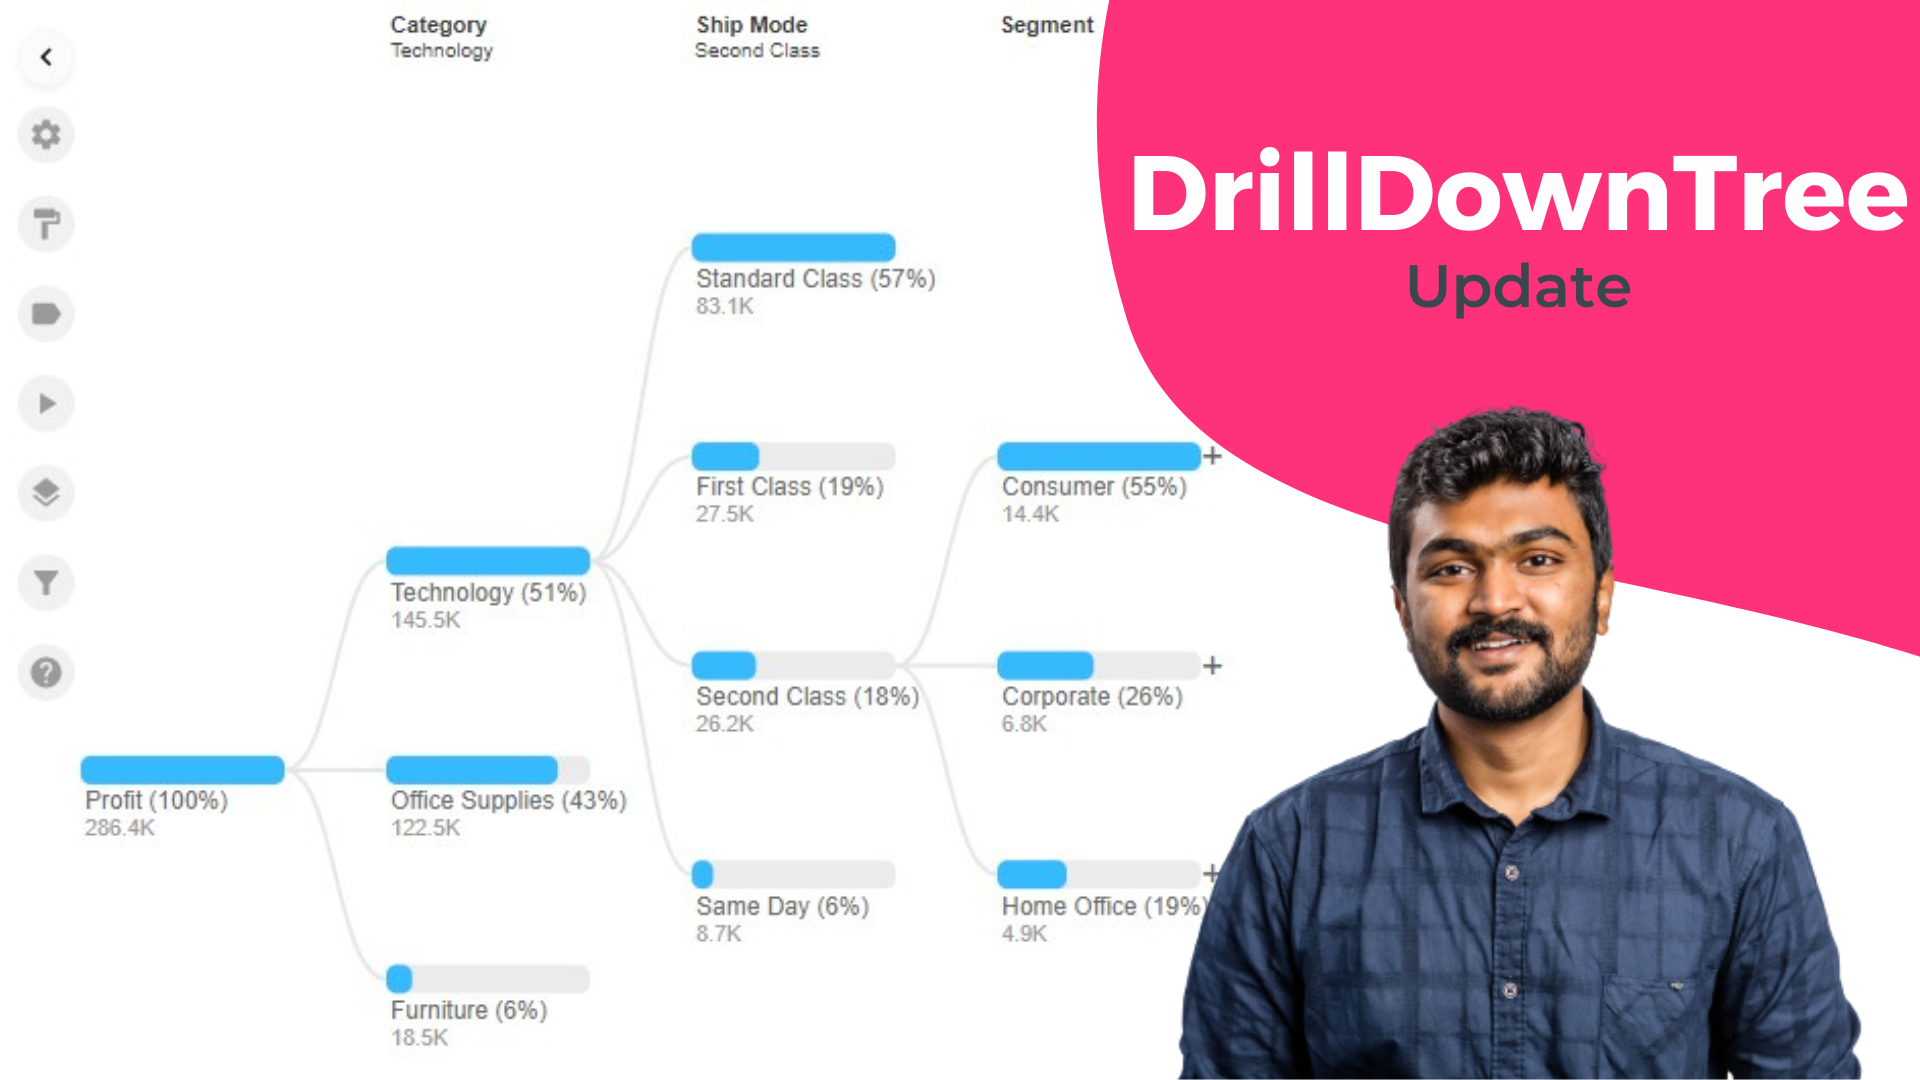
Unlocking Deeper Insights with Custom Calculations in DrillDownTreeAnirudh Somadas2023-07-13T07:59:11+01:00
Jenne Morsink2024-04-15T10:25:28+01:00
How Akamai enabled more flexibility, better analysis, and actionable insights with DrillDownTreeJenne Morsink2024-04-15T10:25:28+01:00
Jenne Morsink2023-07-12T12:33:16+01:00
Maximizing Data Potential: A powerful partnership between Apps for Tableau and Data Street PartnersJenne Morsink2023-07-12T12:33:16+01:00
Jenne Morsink2023-07-12T12:36:53+01:00
PictureThis 3.0 UpdateJenne Morsink2023-07-12T12:36:53+01:00
Jenne Morsink2024-01-30T14:02:43+01:00
How Pfizer is Transforming Data Insights and Boosting Efficiency with ScrollyTelling and WriteBackExtremeJenne Morsink2024-01-30T14:02:43+01:00
Jenne Morsink2024-01-30T14:03:14+01:00
How Inova Transformed KPI Reports and intrigued people across the organization using SuperKPIsJenne Morsink2024-01-30T14:03:14+01:00
Noushin2023-07-13T08:45:54+01:00
Revolutionize Your KPI Reporting Process with SuperKPIs, the Ultimate Tableau TemplateNoushin2023-07-13T08:45:54+01:00
Merlijn Buit2024-03-18T12:17:29+01:00
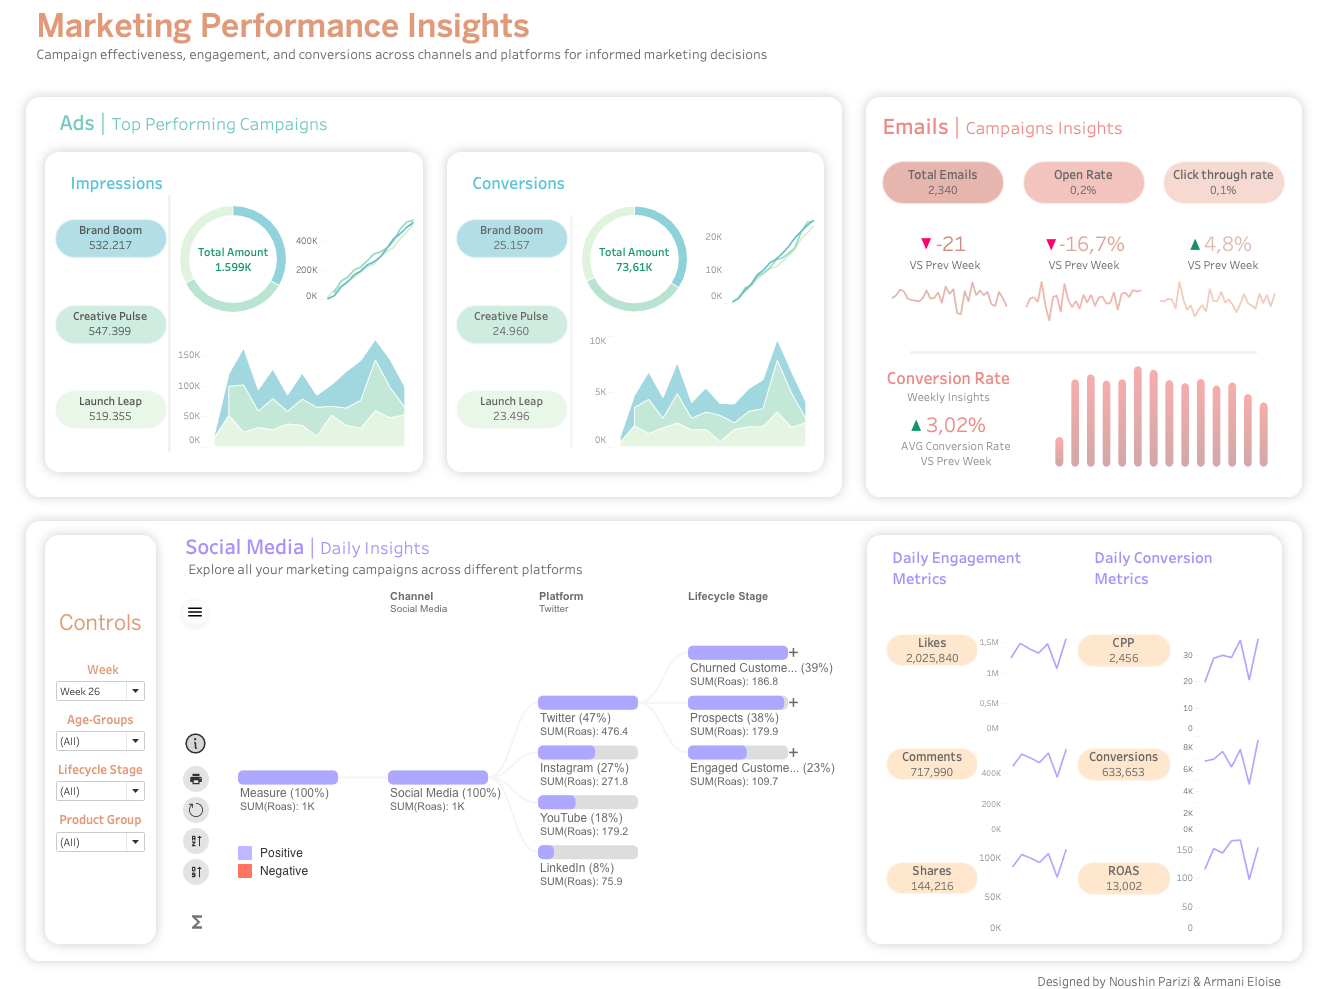
Marketing Campaign PerformanceMerlijn Buit2024-03-18T12:17:29+01:00
Jenne Morsink2023-07-12T12:44:56+01:00
An Introduction to Data Analytics for BeginnersJenne Morsink2023-07-12T12:44:56+01:00
Merlijn Buit2023-07-13T08:46:23+01:00
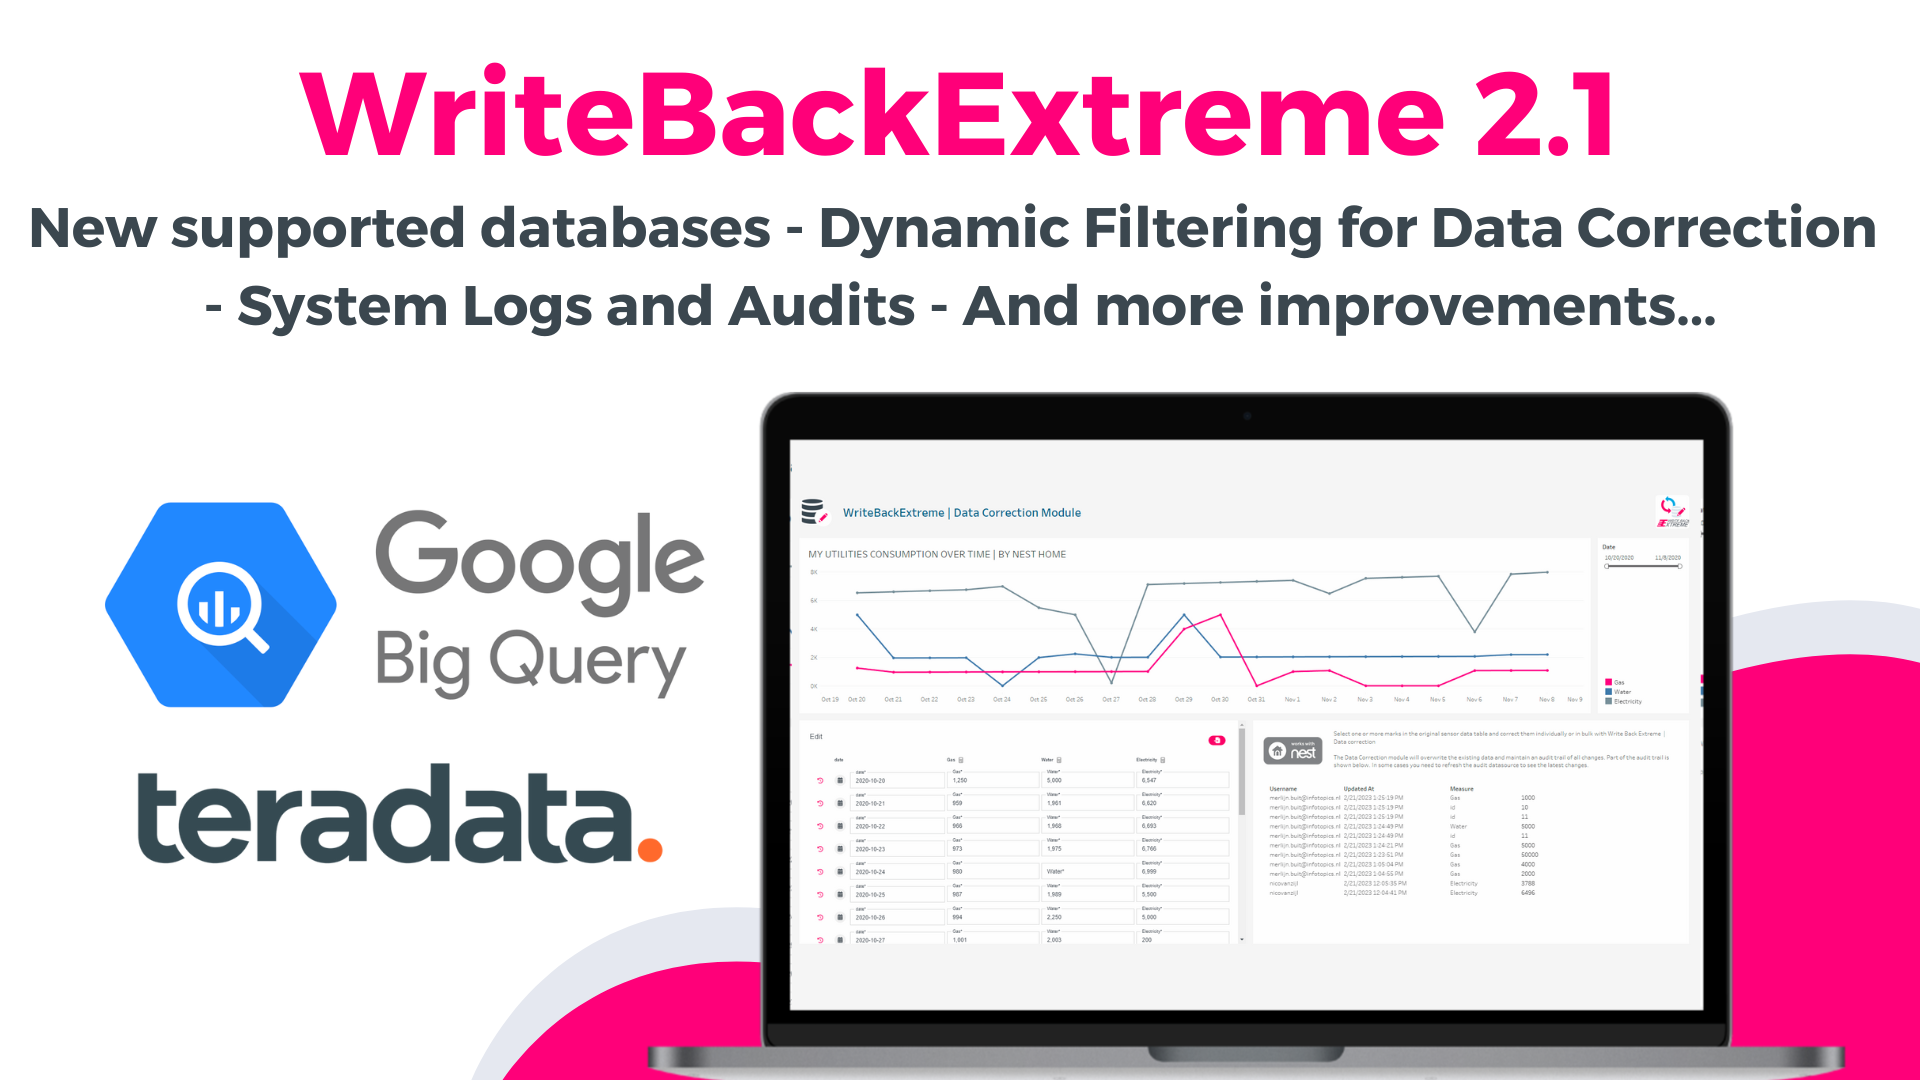
WriteBackExtreme 2.1Merlijn Buit2023-07-13T08:46:23+01:00
Jenne Morsink2023-07-12T13:08:50+01:00
A Beginner Guide to Data-Driven Decision MakingJenne Morsink2023-07-12T13:08:50+01:00
Jenne Morsink2023-07-12T13:10:43+01:00
Why Every Business Should Embrace the Future of Data AnalyticsJenne Morsink2023-07-12T13:10:43+01:00
Anirudh Somadas2023-07-12T13:13:15+01:00
ProcessMining UpdateAnirudh Somadas2023-07-12T13:13:15+01:00
Jenne Morsink2023-07-12T13:14:45+01:00
Two Best Practices for Efficient Root Cause Analysis in TableauJenne Morsink2023-07-12T13:14:45+01:00
Jenne Morsink2023-07-12T13:16:09+01:00
Supporting Local Ice Skating TalentsJenne Morsink2023-07-12T13:16:09+01:00
Merlijn Buit2023-07-12T13:17:10+01:00
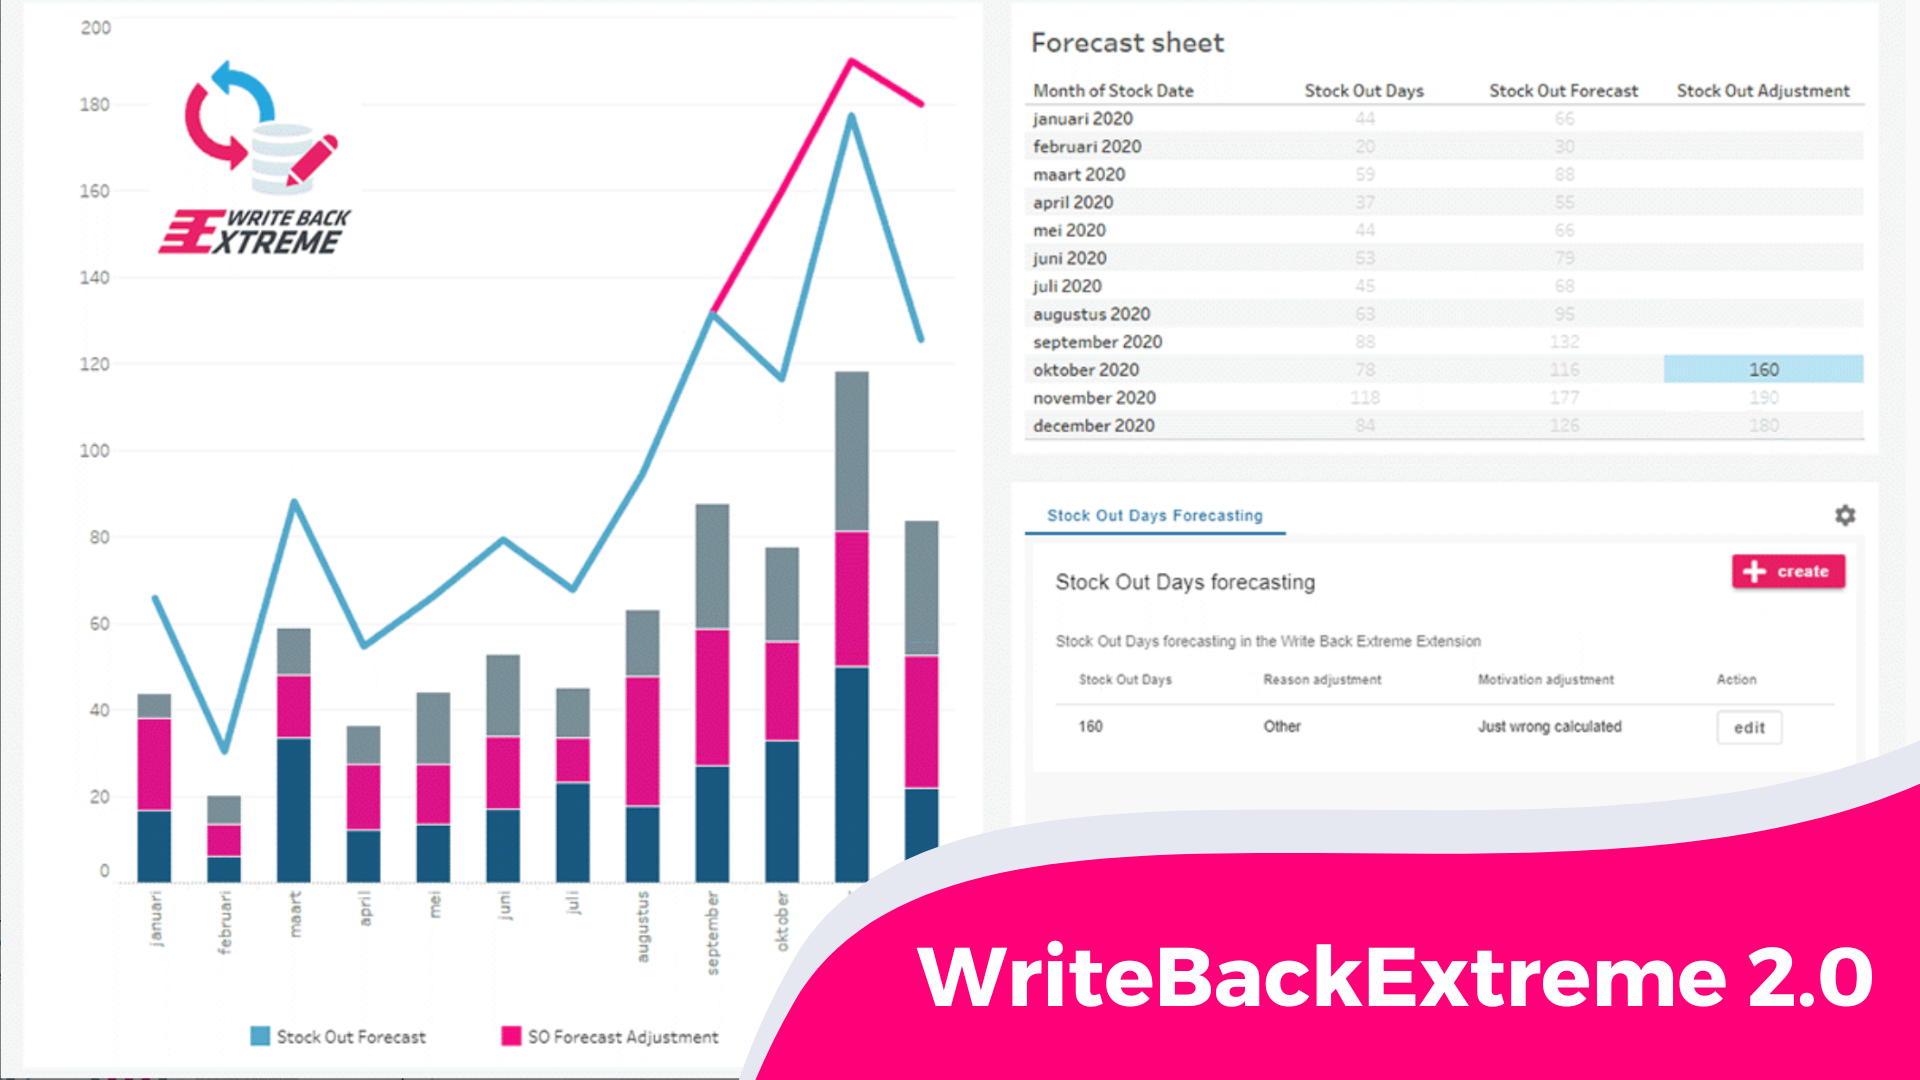
WriteBackExtreme 2.0 UpdateMerlijn Buit2023-07-12T13:17:10+01:00
Noushin2023-07-12T13:19:31+01:00
Root cause analysis in Tableau visualizations: How and Why it Can Help Your BusinessNoushin2023-07-12T13:19:31+01:00
Noushin2023-07-12T13:22:53+01:00
How to implement a Hierarchy Filter in your dashboardNoushin2023-07-12T13:22:53+01:00
Noushin2023-07-12T13:25:40+01:00
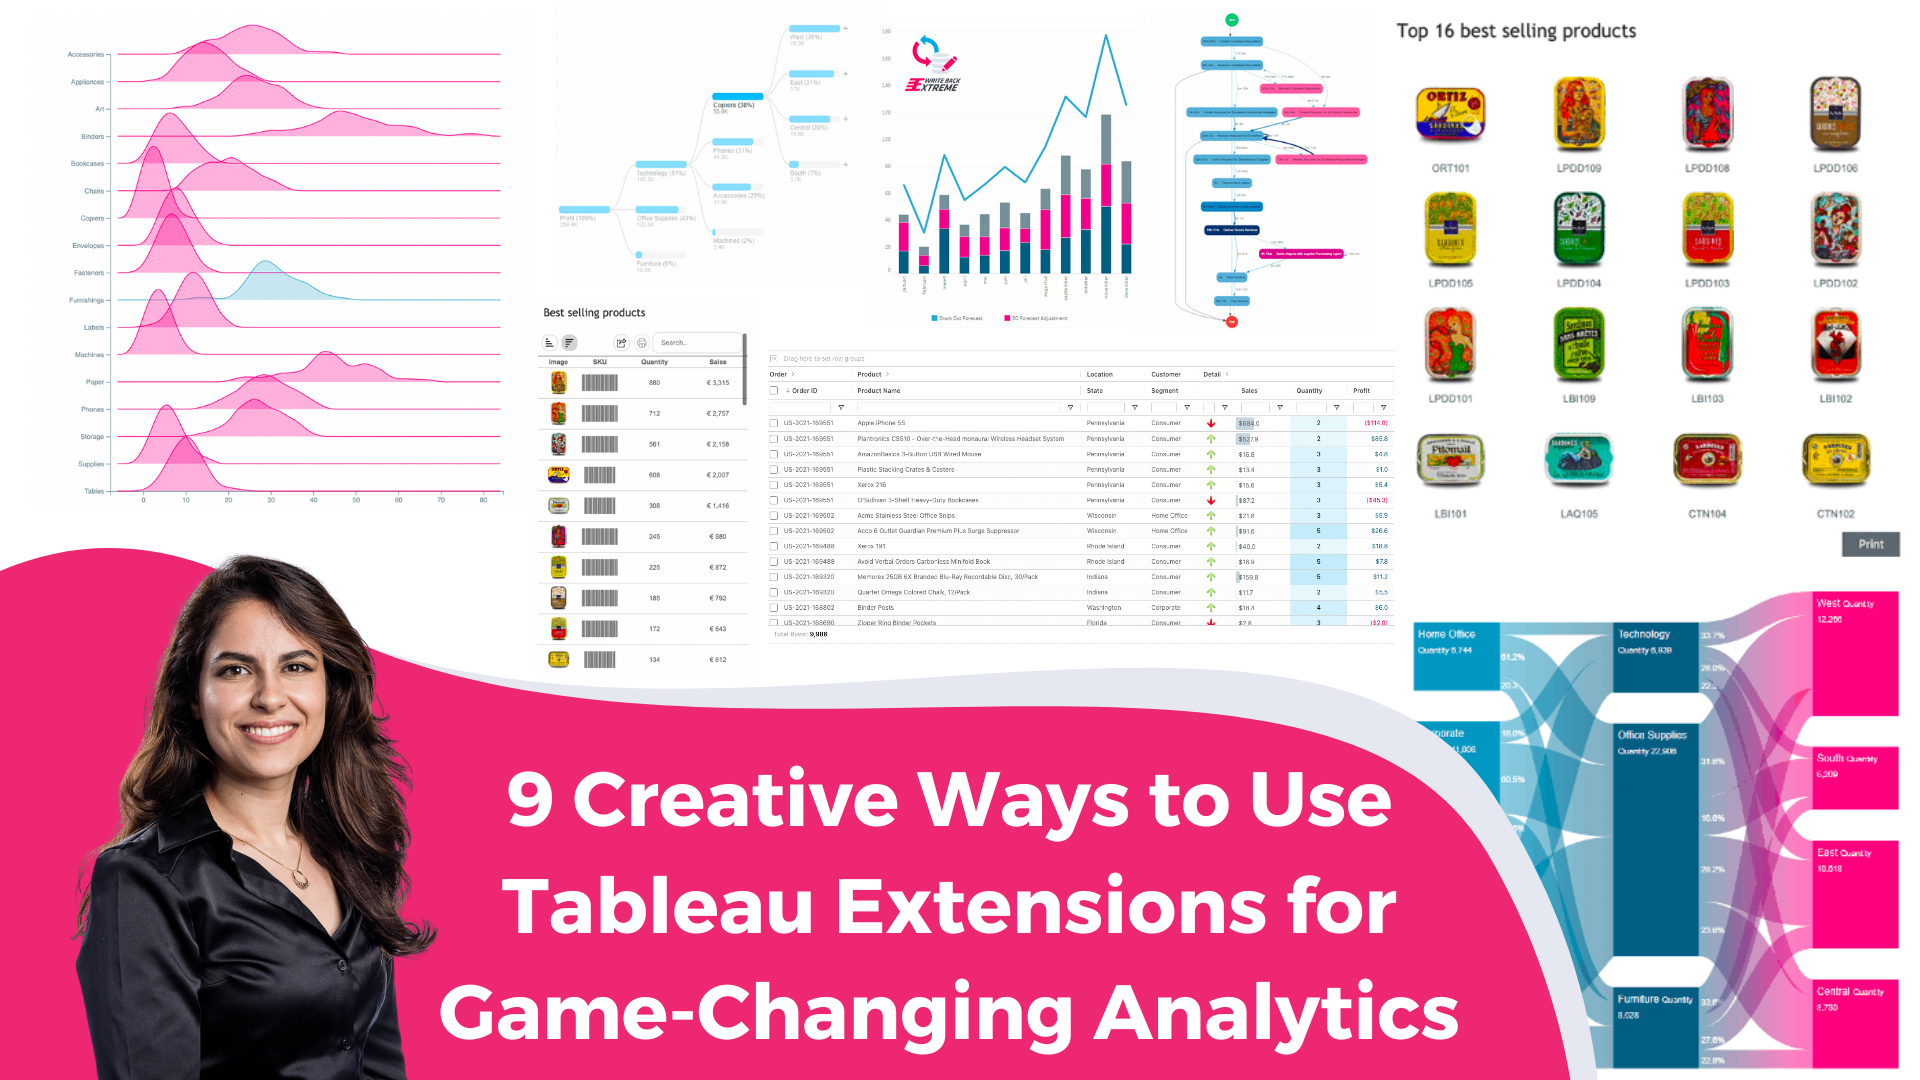
9 Creative Ways to Use Tableau Extensions for Game-Changing AnalyticsNoushin2023-07-12T13:25:40+01:00
Noushin2023-07-12T13:27:35+01:00
Images in your Tableau visualizationsNoushin2023-07-12T13:27:35+01:00
Merlijn Buit2023-07-12T13:33:02+01:00
What’s coming in 2022Merlijn Buit2023-07-12T13:33:02+01:00
Jenne Morsink2024-01-30T14:03:48+01:00
How Savage X Fenty bridged the gap between creative and analytical with SuperTables and PictureThisJenne Morsink2024-01-30T14:03:48+01:00
Merlijn Buit2023-07-12T13:35:44+01:00
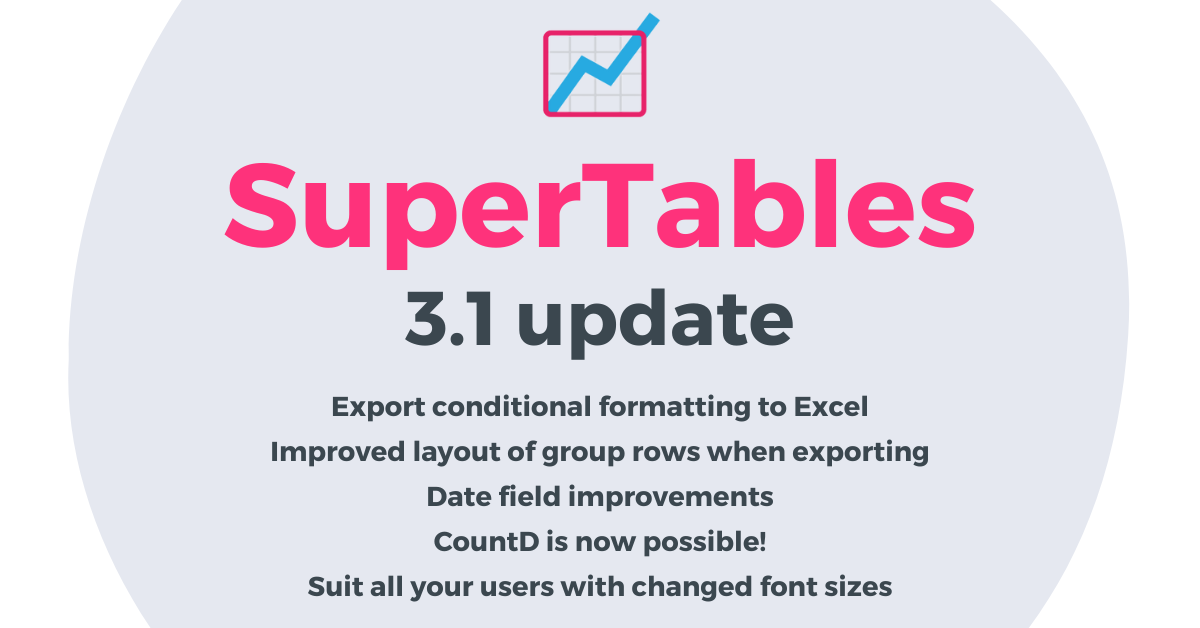
SuperTables 3.1Merlijn Buit2023-07-12T13:35:44+01:00
Jenne Morsink2023-07-13T08:46:48+01:00
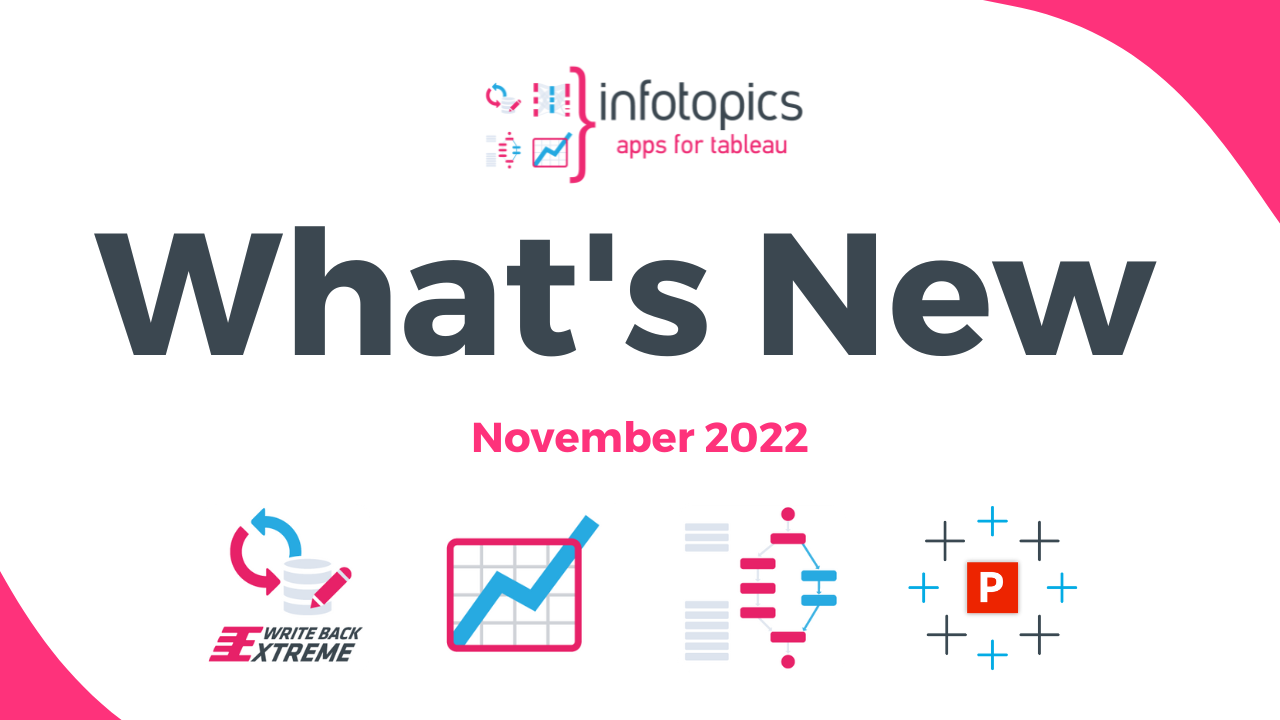
What’s New in Apps for Tableau – November 2022 sessionJenne Morsink2023-07-13T08:46:48+01:00
Noushin2023-07-12T13:44:49+01:00
3 simple steps to a flawless dashboardNoushin2023-07-12T13:44:49+01:00
Jenne Morsink2024-01-30T14:04:27+01:00
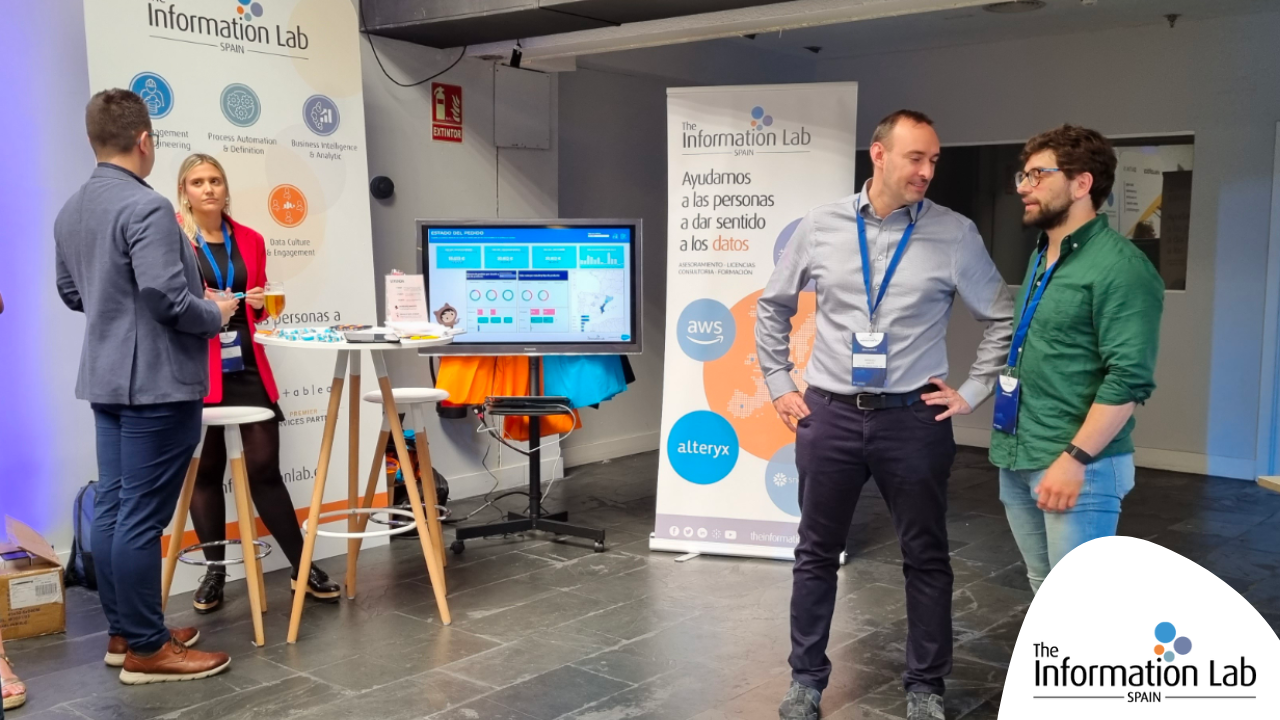
How Information Lab Spain easily created and shared stories with ScrollyTelling and MailSchedulerJenne Morsink2024-01-30T14:04:27+01:00
Merlijn Buit2023-07-12T13:48:36+01:00
Mail Scheduler 2.0Merlijn Buit2023-07-12T13:48:36+01:00
Jenne Morsink2023-07-12T13:51:17+01:00
Join our Sales team!Jenne Morsink2023-07-12T13:51:17+01:00
Merlijn Buit2023-08-02T08:26:03+01:00
New to Tableau extensions? This blog will show you how to get startedMerlijn Buit2023-08-02T08:26:03+01:00
Vincent Cruickshank2023-07-13T08:55:17+01:00
Improve your SuperTables performanceVincent Cruickshank2023-07-13T08:55:17+01:00
Jenne Morsink2024-01-30T14:06:12+01:00
Reliant Funding got 100% end-user adoption with SuperTablesJenne Morsink2024-01-30T14:06:12+01:00
Merlijn Buit2023-01-31T16:31:30+01:00
SuperTables 3.0 is here!Merlijn Buit2023-01-31T16:31:30+01:00
Jenne Morsink2024-01-30T14:06:28+01:00
Learn how Fraudio transformed their dashboards into collaboration areas to share insightsJenne Morsink2024-01-30T14:06:28+01:00
Jenne Morsink2023-07-13T08:54:06+01:00
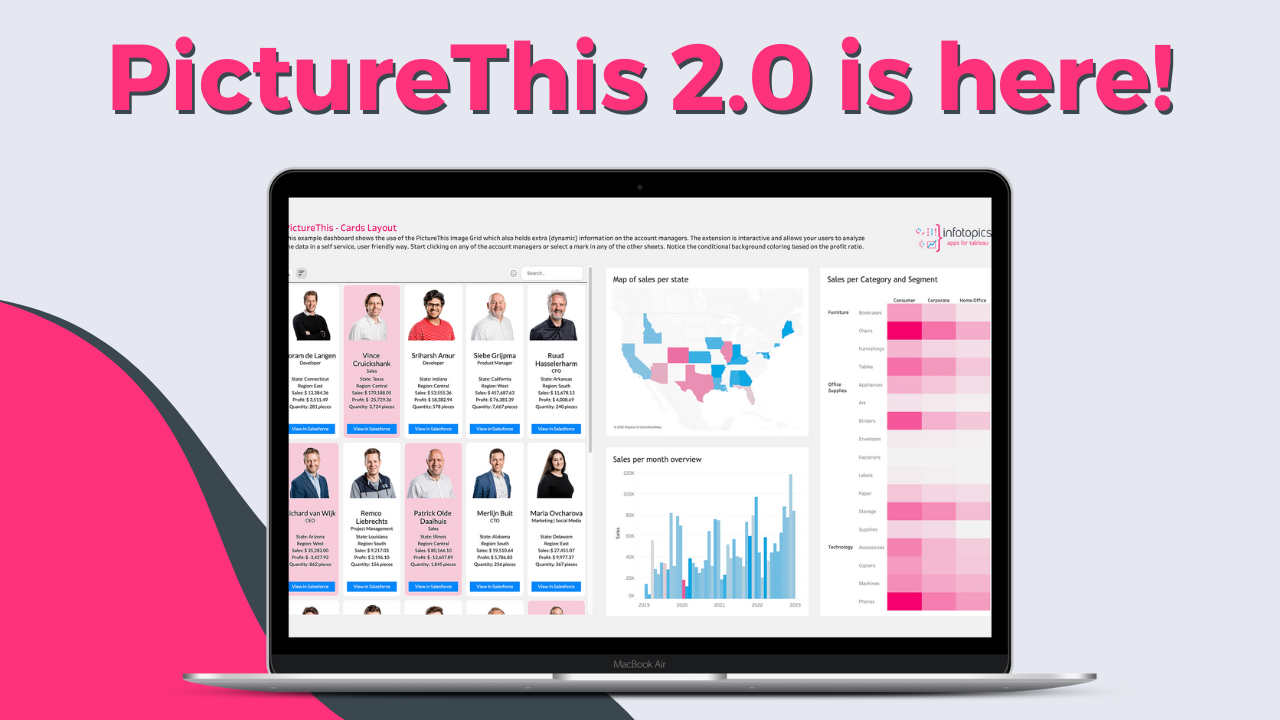
PictureThis 2.0 UpdateJenne Morsink2023-07-13T08:54:06+01:00
Jenne Morsink2024-01-30T14:07:17+01:00
Enhanced Tableau tables functionalities with SuperTables by LIMOSSJenne Morsink2024-01-30T14:07:17+01:00
Jenne Morsink2024-02-01T15:45:35+01:00
5 reasons why working at Apps for Tableau is funJenne Morsink2024-02-01T15:45:35+01:00
Jenne Morsink2023-02-06T15:05:57+01:00
Raise your game by Drilling DownJenne Morsink2023-02-06T15:05:57+01:00
Jenne Morsink2023-08-10T15:28:35+01:00
Increasing work efficiency and quality with WriteBackExtremeJenne Morsink2023-08-10T15:28:35+01:00
Merlijn Buit2023-06-05T12:06:42+01:00
Meet our developer — Joost van LeeuwenMerlijn Buit2023-06-05T12:06:42+01:00
Jenne Morsink2023-05-09T12:42:35+01:00
How to make changes to the data in Tableau?Jenne Morsink2023-05-09T12:42:35+01:00
Jenne Morsink2024-01-30T14:08:47+01:00
Carter’s created Better Product Visualizations and Self-service Tableau Tables with PictureThis & SuperTablesJenne Morsink2024-01-30T14:08:47+01:00
Anirudh Somadas2023-01-31T14:52:47+01:00
Travel through your data by drill through and drill-down analysis. Anirudh Somadas2023-01-31T14:52:47+01:00
Jenne Morsink2024-01-30T14:10:54+01:00
Customization and Easy Work in Tableau with SuperTables by LAND-DATAJenne Morsink2024-01-30T14:10:54+01:00
Jenne Morsink2023-07-24T10:14:22+01:00
Apps for Tableau announces new partnership with Visual DJ LtdJenne Morsink2023-07-24T10:14:22+01:00
Jenne Morsink2024-01-30T14:11:56+01:00
Learfield saving time with WriteBackExtreme in TableauJenne Morsink2024-01-30T14:11:56+01:00
Jenne Morsink2024-01-30T14:13:05+01:00
How PVH improved Decision-making, Saved Time & Money using retail data with PictureThisJenne Morsink2024-01-30T14:13:05+01:00
Jenne Morsink2023-08-10T14:38:19+01:00
Fewer reports, more personalized user views, and improved collaboration with SuperTables & WriteBackExtremeJenne Morsink2023-08-10T14:38:19+01:00
Page load link