Extensions Insights via the Tableau Server Repository
When you are using Dashboard Extensions on your Tableau Server, you also need/want to monitor and manage the number of instances, versions and actual usage of extensions across your Tableau Sites, Workbooks and Dashboards. In this short blog I will explain how you can easily use the Tableau Server Repository to obtain deployment information on your Dashboard Extension Instances
Why bother?
The main reasons to monitor the status and deployment of Dashboard Extensions in your organization are:
- Understand what extensions are being deployed on your Tableau Server
- See what extensions are whitelisted (and used) on which Tableau Sites
- Gain insight in what workbooks and dashboards use which Dashboard Extensions
- Perform an impact or risk analysis before upgrading or downgrading Dashboard Extensions
Especially in a Tableau environment with multiple sites and large amounts of workbooks this Repository can really help you gain insights and be in control with respect to Extensions.
Gain access to your Tableau Server Repository
Tableau Server is equipped with a PostgreSQL based repository that stores a lot of (meta) information on a lot of assets in your Tableau environment. Since Tableau version 2020.1 the Tableau Server Repository holds a number of tables storing very useful information on the deployment and usage of Dashboard Extensions. Read more on the Tableau Server Repository.
The Repository tables listed below are dedicated to storing (meta) information on extensions:
- extensions_events
- extensions_instances
- extensions_metadata
- extensions.safe_list
- extensions.site_settings
These tables can of course be joined with other tables that are available in the Repository like Sites, Workbooks, Views and Users to connect the dots and create really interesting insights in the usage and status of your Dashboard Extensions. Please be aware the repository uses luids as unique id’s for the records in your tables and you need to connect the proper luids in order to get your information.
In my example I used Tableau Relations to connect some tables of the Tableau Server Repository. Below you see a screenshot of the relations I used for my Datasource.

Creating the Dashboard
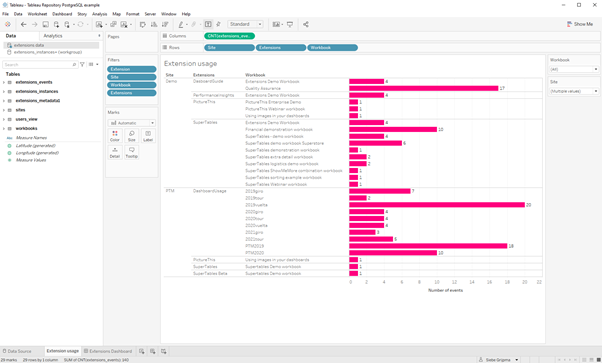
I have renamed some fields in the datasource for better understanding in the dashboard (Site, Extensions and Workbook are renamed fields in the different tables that all use an original value like “name”). In this basic example I show how many Extension events are registered in the Tableau Server Repository and what extensions are used on which sites and in which workbooks. My demo worksheet is shown below.

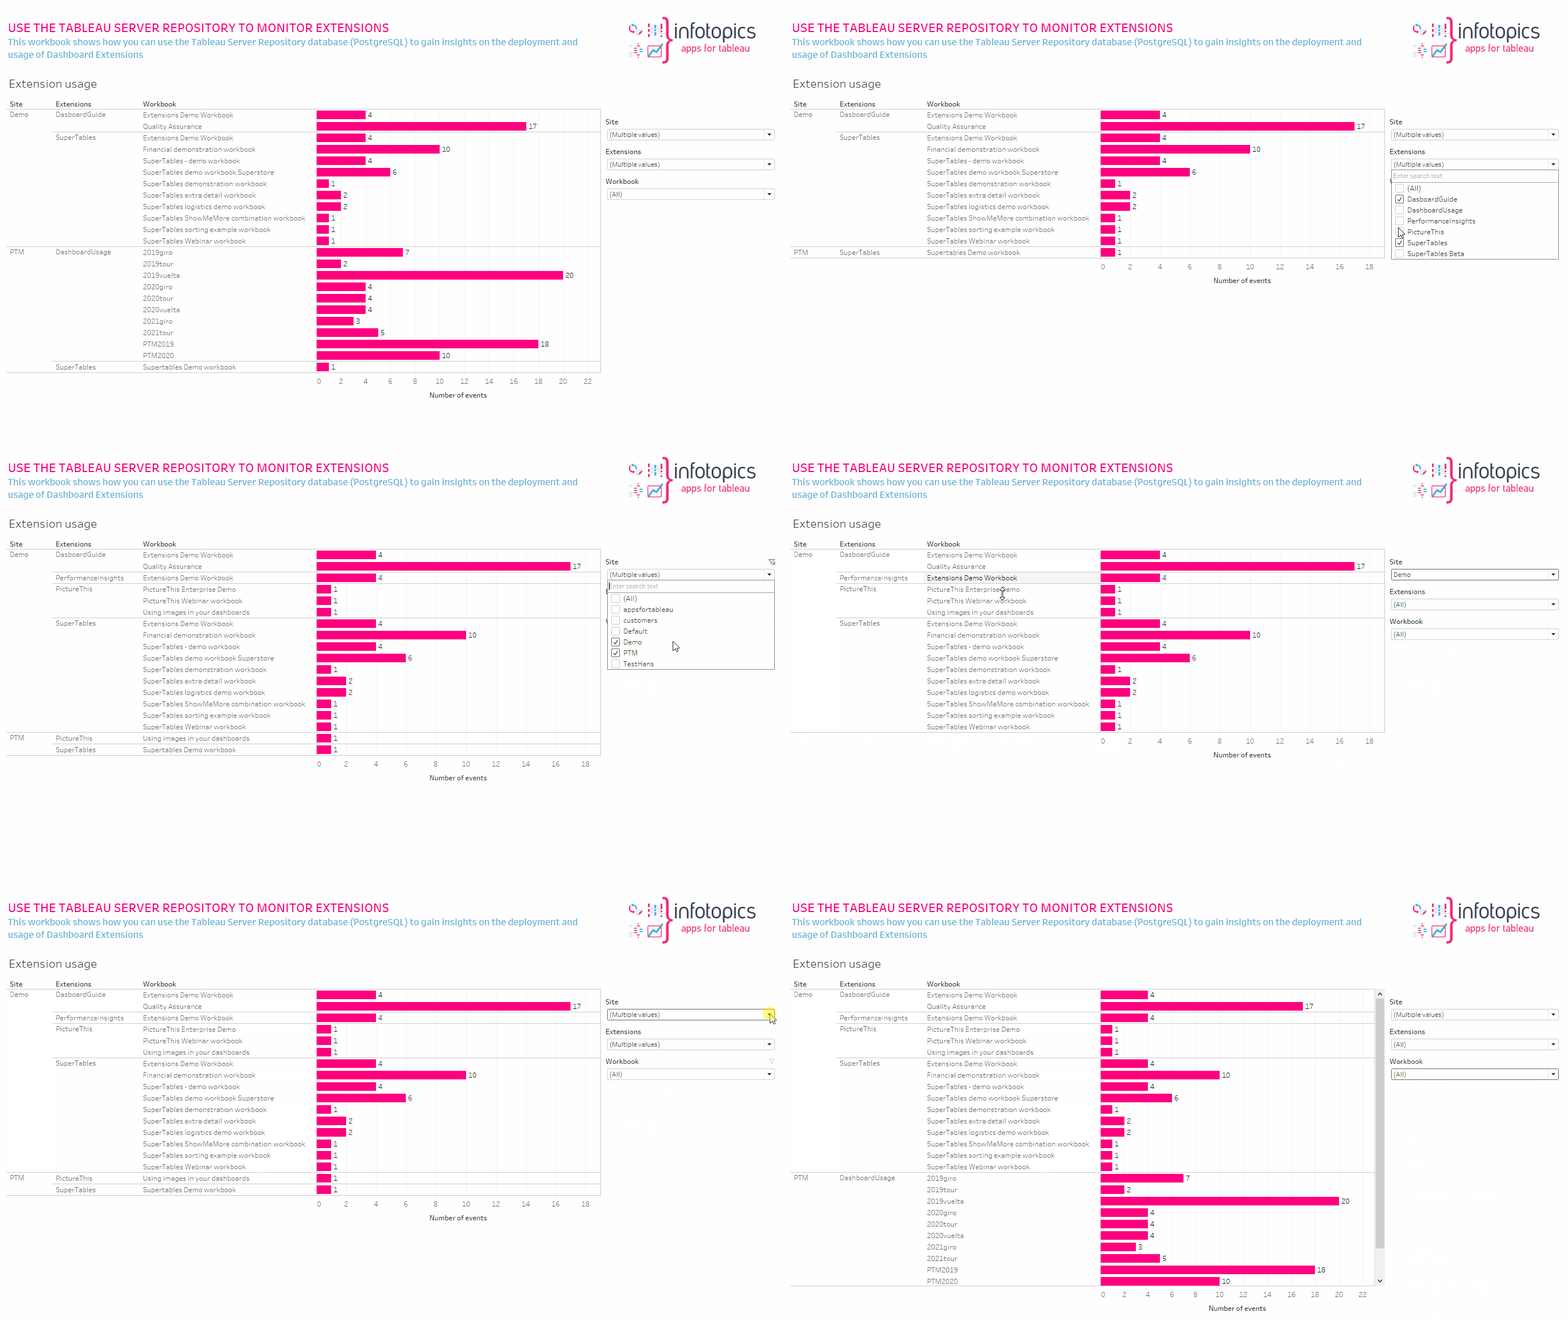
Below is an animated gif that shows you can easily gain insights in what extensions are used, which sites have whitelisted the extensions and what workbooks use them. Feel free to dive in much deeper since I can imagine you also want to know the Dashboard Owner and maybe even the actual dashboards in the workbook that use the extension.

Resume
It is very easy to gain useful insights and information on the deployment of extensions of your Tableau Server, once you have (read only) access to the Tableau Server Repository database. This will help you in many use cases like doing your risk or impact analysis once you decide to upgrade or downgrade your extensions.
