Improve your Supertables performance with these helpful tips!
We are here to give you the best tips and tricks to ensure you get the best performing SuperTables extension. We will advise you how to prepare your data as well as tips whilst using SuperTables. SuperTables is Tableau’s most popular extension so make sure you’re getting the best performance possible by following this blog.
Use datasheets to supply data to extensions
A lot of extensions need access to data in order to function. However, it is often undesirable for performance and usability to have the extension share data with an existing worksheet. For this reason we recommend using a datasheet to get the most out of your dashboard and extension in terms of performance and user experience. Read our Blog which will explain in more detail.
Dynamic Aggregation
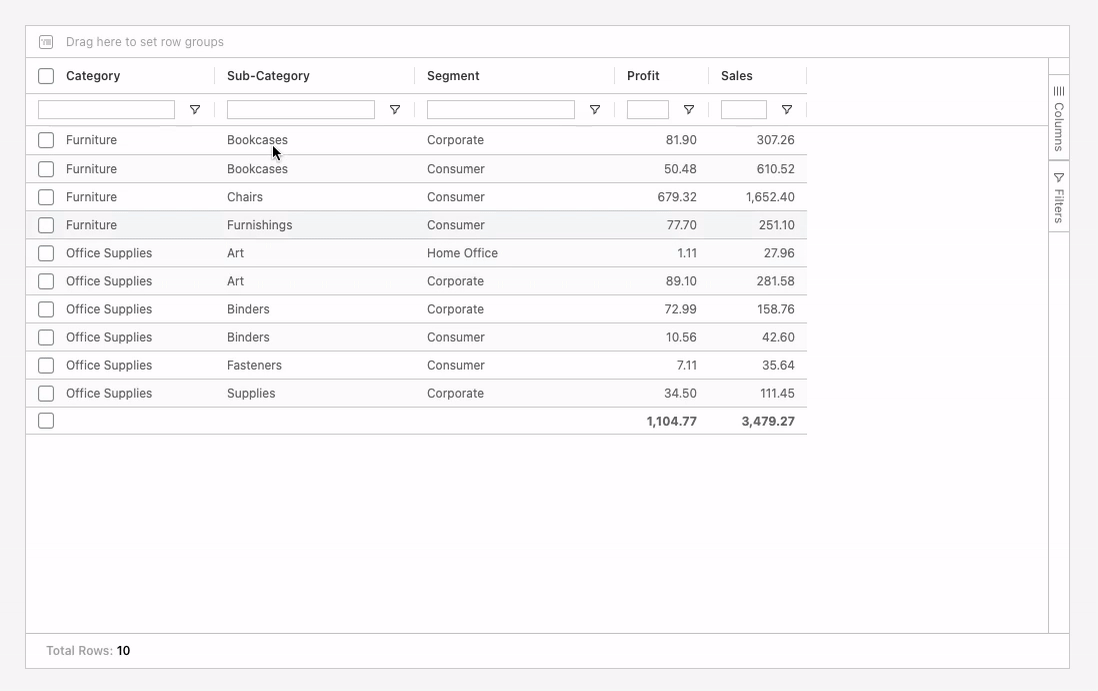
Extensions work with providing data through a worksheet, we call this a datasheet. Because SuperTables is incredibly flexible for end-users you want to give them the freedom to explore as much data as possible. The downside of adding too much detail to your datasheet is a decrease in performance . When not showing the lowest detail in your SuperTables it will give you duplicated rows. This can be solved by using the grouping bar but solving this with Dynamic Aggregations is an even better solution! We combine the power of Tableau Parameters and visible columns in SuperTables. By doing this we will automatically remove / add detail from the datasheet which results in a different level of aggregation. With this incredible feature you only query the data you are looking at, and Table Calculations / LOD calculations will also keep working like you expect! On top of that you benefit from a performance boost! Explained in detail in our Product Guide.
More tips for a better performance!
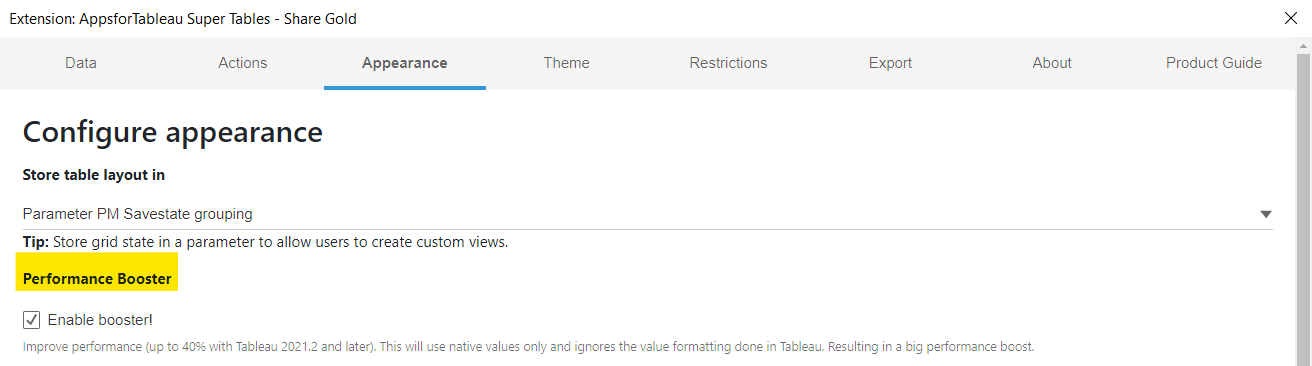
Turn on Performance Booster
In the configuration screen of SuperTables, under the Appearance tab you will see the Performance Booster. This can give up to a 40% increase in performance when you are in Tableau 2021.2 or higher.
Filter and aggregate your data
If your dataset still does not offer a satisfying user experience with the SuperTables extension then you might consider aggregating your dataset to a different level. Another option is to apply filters (on for instance Data periods, departments, regions or categories of your choice ) before feeding it to the SuperTables extension through the Extensions API. This is all to reduce the number of rows that will be transferred to your extension.
Use Extracts instead of live connections
In general it is best practice in Tableau to use a data source based on an extract (refreshing overnight would offer ‘almost live’ datasets for your SuperTables dashboards). This way your performance gets optimized in the datasource and calculated fields are pre-calculated as well.
No overhead on data sheets
Due to the data transfer mechanism of the Tableau Extensions API it is important to remove as much overhead columns (meta information) from the worksheet in your Tableau Workbook. Remove all columns (dimensions or measures) that will not be used in the extension. Besides the number of rows, also the number of columns affect the user experience of your Tableau users.
Local rendering of extensions
Extensions are created in JavaScript and rendered client side. This implicates that in a published dashboard extensions use the resources of the clients browser in which the dashboard is opened. Make sure your client has as much resources as needed, this is a challenge in centralized virtualizations like Citrix for example. The more memory and CPU the less performance related issues will manifest in the user experience.
We love to make solutions and help Tableau users to do things more efficiently. If you have feedback, ideas, questions or need support, please share them with us! Also, don’t forget to follow us on social media for our latest news and updates.