How Akamai’s Cost-Cutting Solution Transformed Their Tableau Analytics
The Services organization at Akamai, which supports Tableau Analytics for a large group of persons, wanted the flexibility to slice and dice data without having to build hundreds of filters to cater to the large audience’s needs. After some research, they decided to implement the DrillDownTree extension to build next-level dashboards in Tableau.
About Akamai
Akamai Technologies, Inc. is an American content delivery network (CDN), cybersecurity and cloud service company, providing web and Internet security services. Akamai Connected Cloud makes it easy for businesses to develop and run applications and workloads, while they put experiences closer to users and keep threats farther away. That’s why innovative companies worldwide choose Akamai to build, deliver, and secure their digital experiences.
Building Dashboards for Varying User Groups
While building dashboards to analyze time spent on billable vs. non-billable work in the Services organization, many use cases arose from different user groups who wanted to see the data by different parameters. This type of dashboard, to meet the varying needs of the business users, would require many filter options, which would be rigid and inflexible. This is where the DrillDownTree peaked their interest.
Slicing and Dicing Data for Better Tableau Analytics
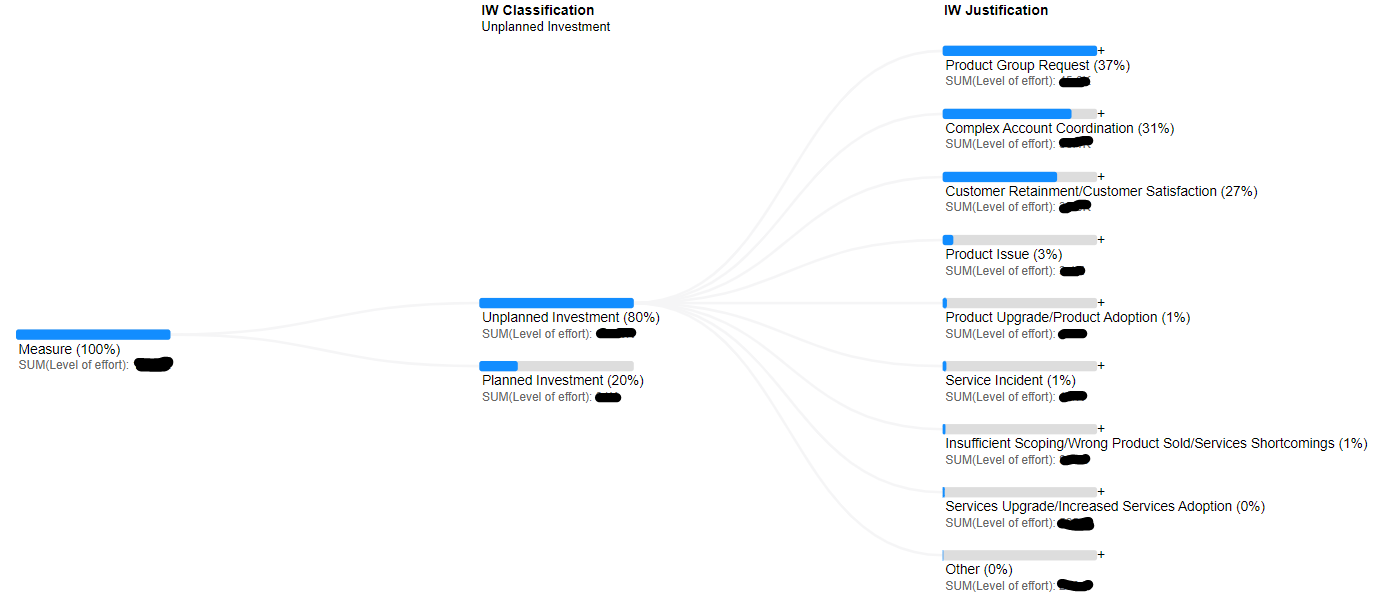
The development team at Akamai noticed that different user groups wanted to view the data differently. For example, one group wanted to look at the data by geography, and the other wanted to look at it by request type. They needed more flexibility in their Tableau analytics because of all the different ways people look at the data, and they wanted to slice and dice the data specified to their own specific use case.
Flexibility and Actionable Insights with DrillDownTree
The DrillDownTree extension from Apps for Tableau has allowed Akamai to dig into different angles in which they look at the data to see patterns. It allows them to see if there is a difference by geography or by the products, and when there is a difference, they can really identify where they see data standing out.
The business operations team now experiences more flexibility to do ad-hoc analyses without having to do additional development in Tableau. Because of DrillDownTree, they have been able to identify three areas where they are doing specific initiatives to optimize billable vs. non-billable efforts. As an outcome, they identified an opportunity to reduce time spent on complex project management, which was contributing significantly to total non-billable efforts. Using DrillDownTree and the analysis of this data, they have been able to kick off a pilot to use a different project management software to see if that reduces the time spent on complex project management and brings down the overall effort of this non-billable work.
“The DrillDownTree extension enables our organization to slice and dice data depending on the audience: from management looking at geo-level trends to account teams working to improve their account operations, the DrillDownTree has helped us achieve faster & more flexible analysis and results.” ”
– Kate Rohnstock, Manager Business Operations

Summary
In conclusion, the DrillDownTree extension has allowed Akamai to provide flexibility to its large target audience without having to build hundreds of filters. They have been able to identify where data is standing out and have implemented initiatives to reduce non-billable time. The extension has given them more flexibility, better analysis, and actionable insights in their Tableau analytics.
Get better insights into your data through drill-down actions!
A dashboard is designed to take the user as close to an action that improves your organization’s performance, and the deeper you dig into the data, the more questions you will find. These questions enable you to look at the information and analyze it from different points of view. DrillDownTree allows users to explore specific information in a dashboard from different angles by shifting from an overview of data to a more detailed picture using the same dataset. It’s a great data exploration tool for ad hoc analysis and root cause analysis.