Hi there!
Let me introduce myself. I was born in The Hague where I studied Software Engineering. Recently I graduated and shortly after that I moved to Apeldoorn. After the summer it was time to look for my first “real” job. During my study, I got to know a lot of different disciplines in the field of Software Engineering. Amongst that were embedded systems, Internet of Things and computer vision. I also did a minor Applied Data Science, which was my first introduction to the concept of data science and working with Big Data. During the minor, I worked on developing a Machine Learning model that was able to read advertisements from the Dark Web and classify them into certain categories. The minor sparked my interest in Data Science and is probably an important reason I ended up at Infotopics.
My first weeks at Infotopics | Apps for Tableau
At Infotopics, I’ll be working in the Apps for Tableau team together with fellow developers Merlijn Buit and Yoram de Langen among others. I will join them in maintaining and expanding existing extensions for Tableau and creating new ones.
Getting up to speed
To make myself familiar with the techniques I’ll be using when creating Tableau extensions, I spend a couple of weeks learning programming frameworks such as Vue and Laravel. Learning new ways to create applications and seeing how experienced programmers like Yoram and Merlijn work was a lot of fun. I got the time to learn everything at my own pace and I also got to meet a lot of new colleagues from all different teams at Infotopics.

Knowledge Sharing
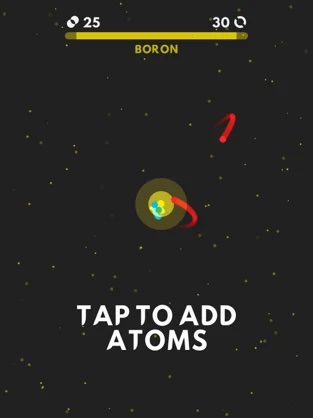
At the end of my second week, the yearly hackathon was planned. Due to COVID-19 we weren’t able to get together physically. Since this wasn’t an ideal situation for a real hackathon, we decided to share some knowledge instead. I gave a small tutorial on creating a game for iOS. Merlijn and Yoram were interested to know how this would work, since they saw my apps when I applied for the position at Infotopics. If you’d like to check out some apps that I made, you can! They’re in the iOS App Store for free :) After my tutorial on iOS games, Yoram shared his knowledge on Laravel. A PHP framework that was new to me, but something that would be of great value when working at Infotopics. After this day, I started learning Laravel myself and Yoram’s introduction certainly helped.
Tableau training
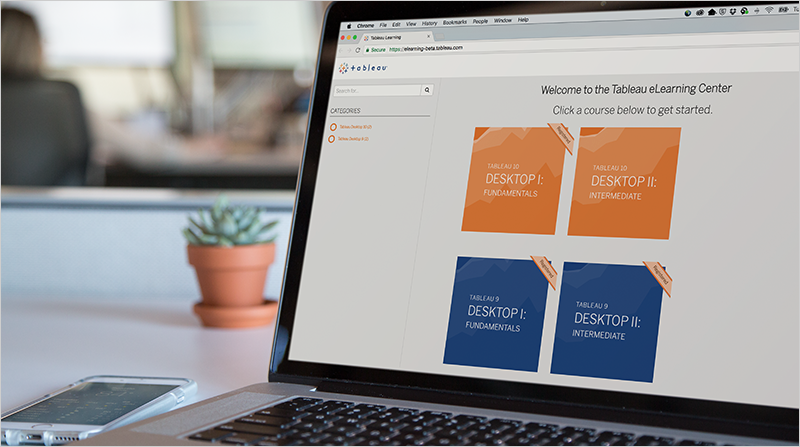
During the end of 2020, I wasn’t the only new employee to start at Infotopics. The company grew quickly and together with six other new colleagues we followed a 3-week training on Tableau. During the training, we learned the basic features of Tableau: how to create dashboards and work with the data sources. After that, we got to learn some more advanced features as well as data-driven thinking and knowing how to convey the data to customers in a visually sound way.
My first extension: Pile
As in introduction to the beautiful world of Tableau extensions, I got to develop my very first own extension. What would it have to be? I got complete freedom to come up with something. Here’s what I did.
The concept
I’ve always been very interested in visuals. From my experience with creating iOS games to working at my first Internship at a solar company I’ve always enjoyed coding graphics. I thought it’d be fun to do something with that in Tableau. Have you ever heard someone say: “If you lay all of that next to each other, it would stretch to to moon and back 3 times!”, or “If you stack all that on top of each other, it would reach the height of Mount Everest!”. How fun would it be to be able to truly visualise this in Tableau? The idea was to be able to visualise your companies profits for example, as a pile of money next to real world object.
The result
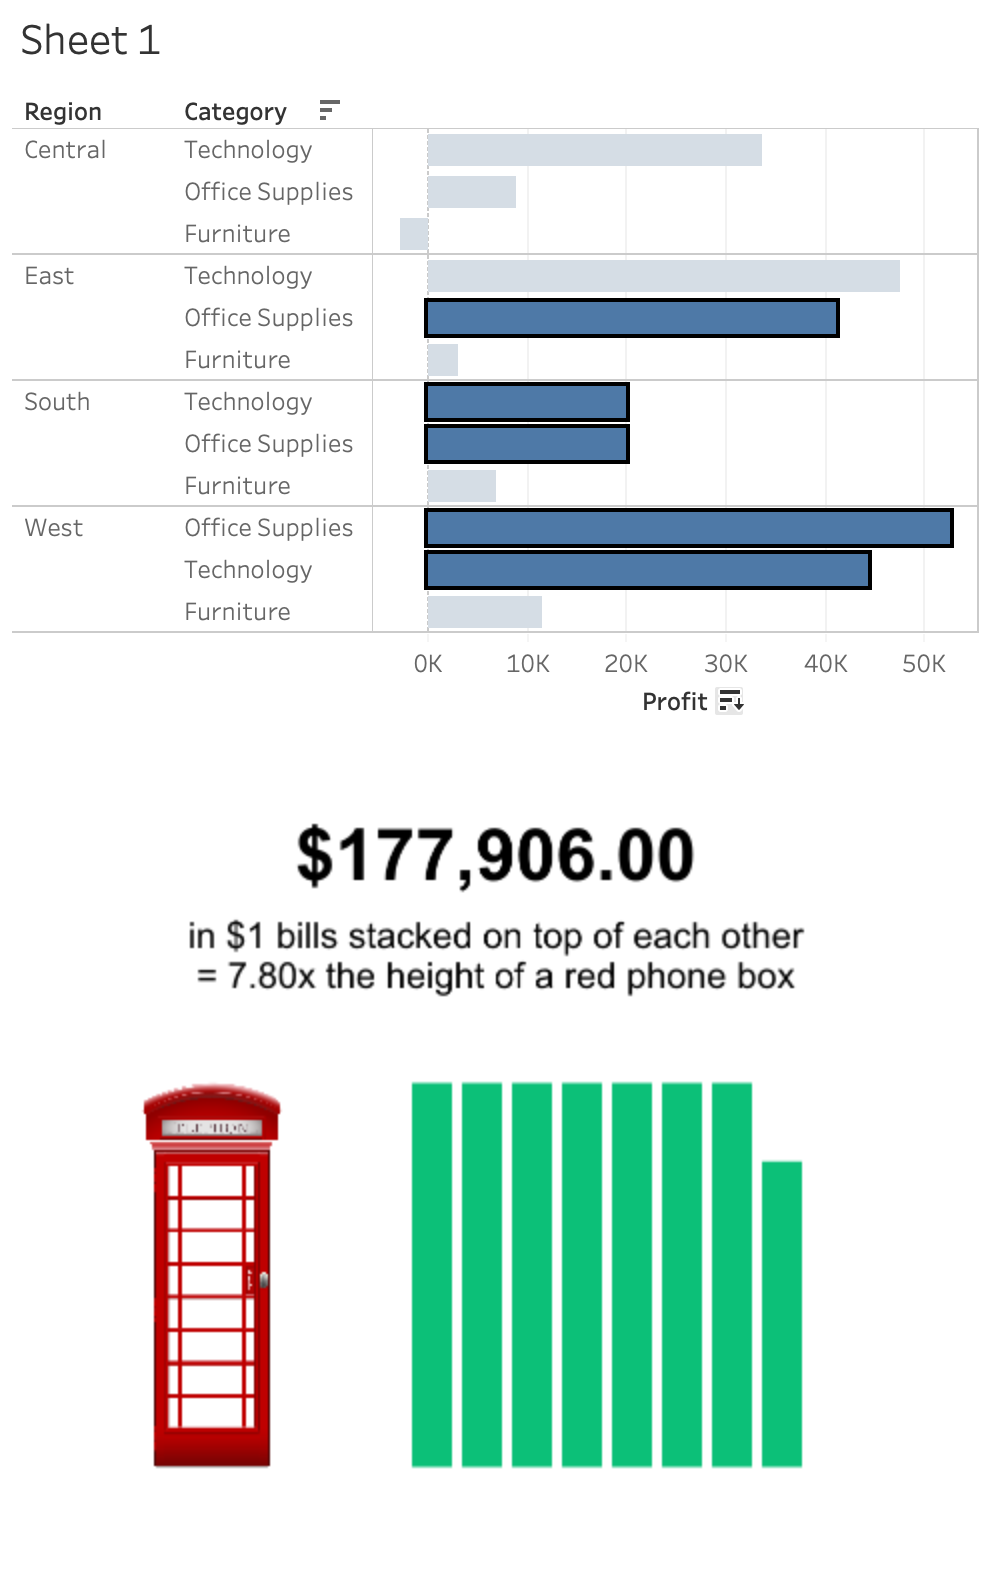
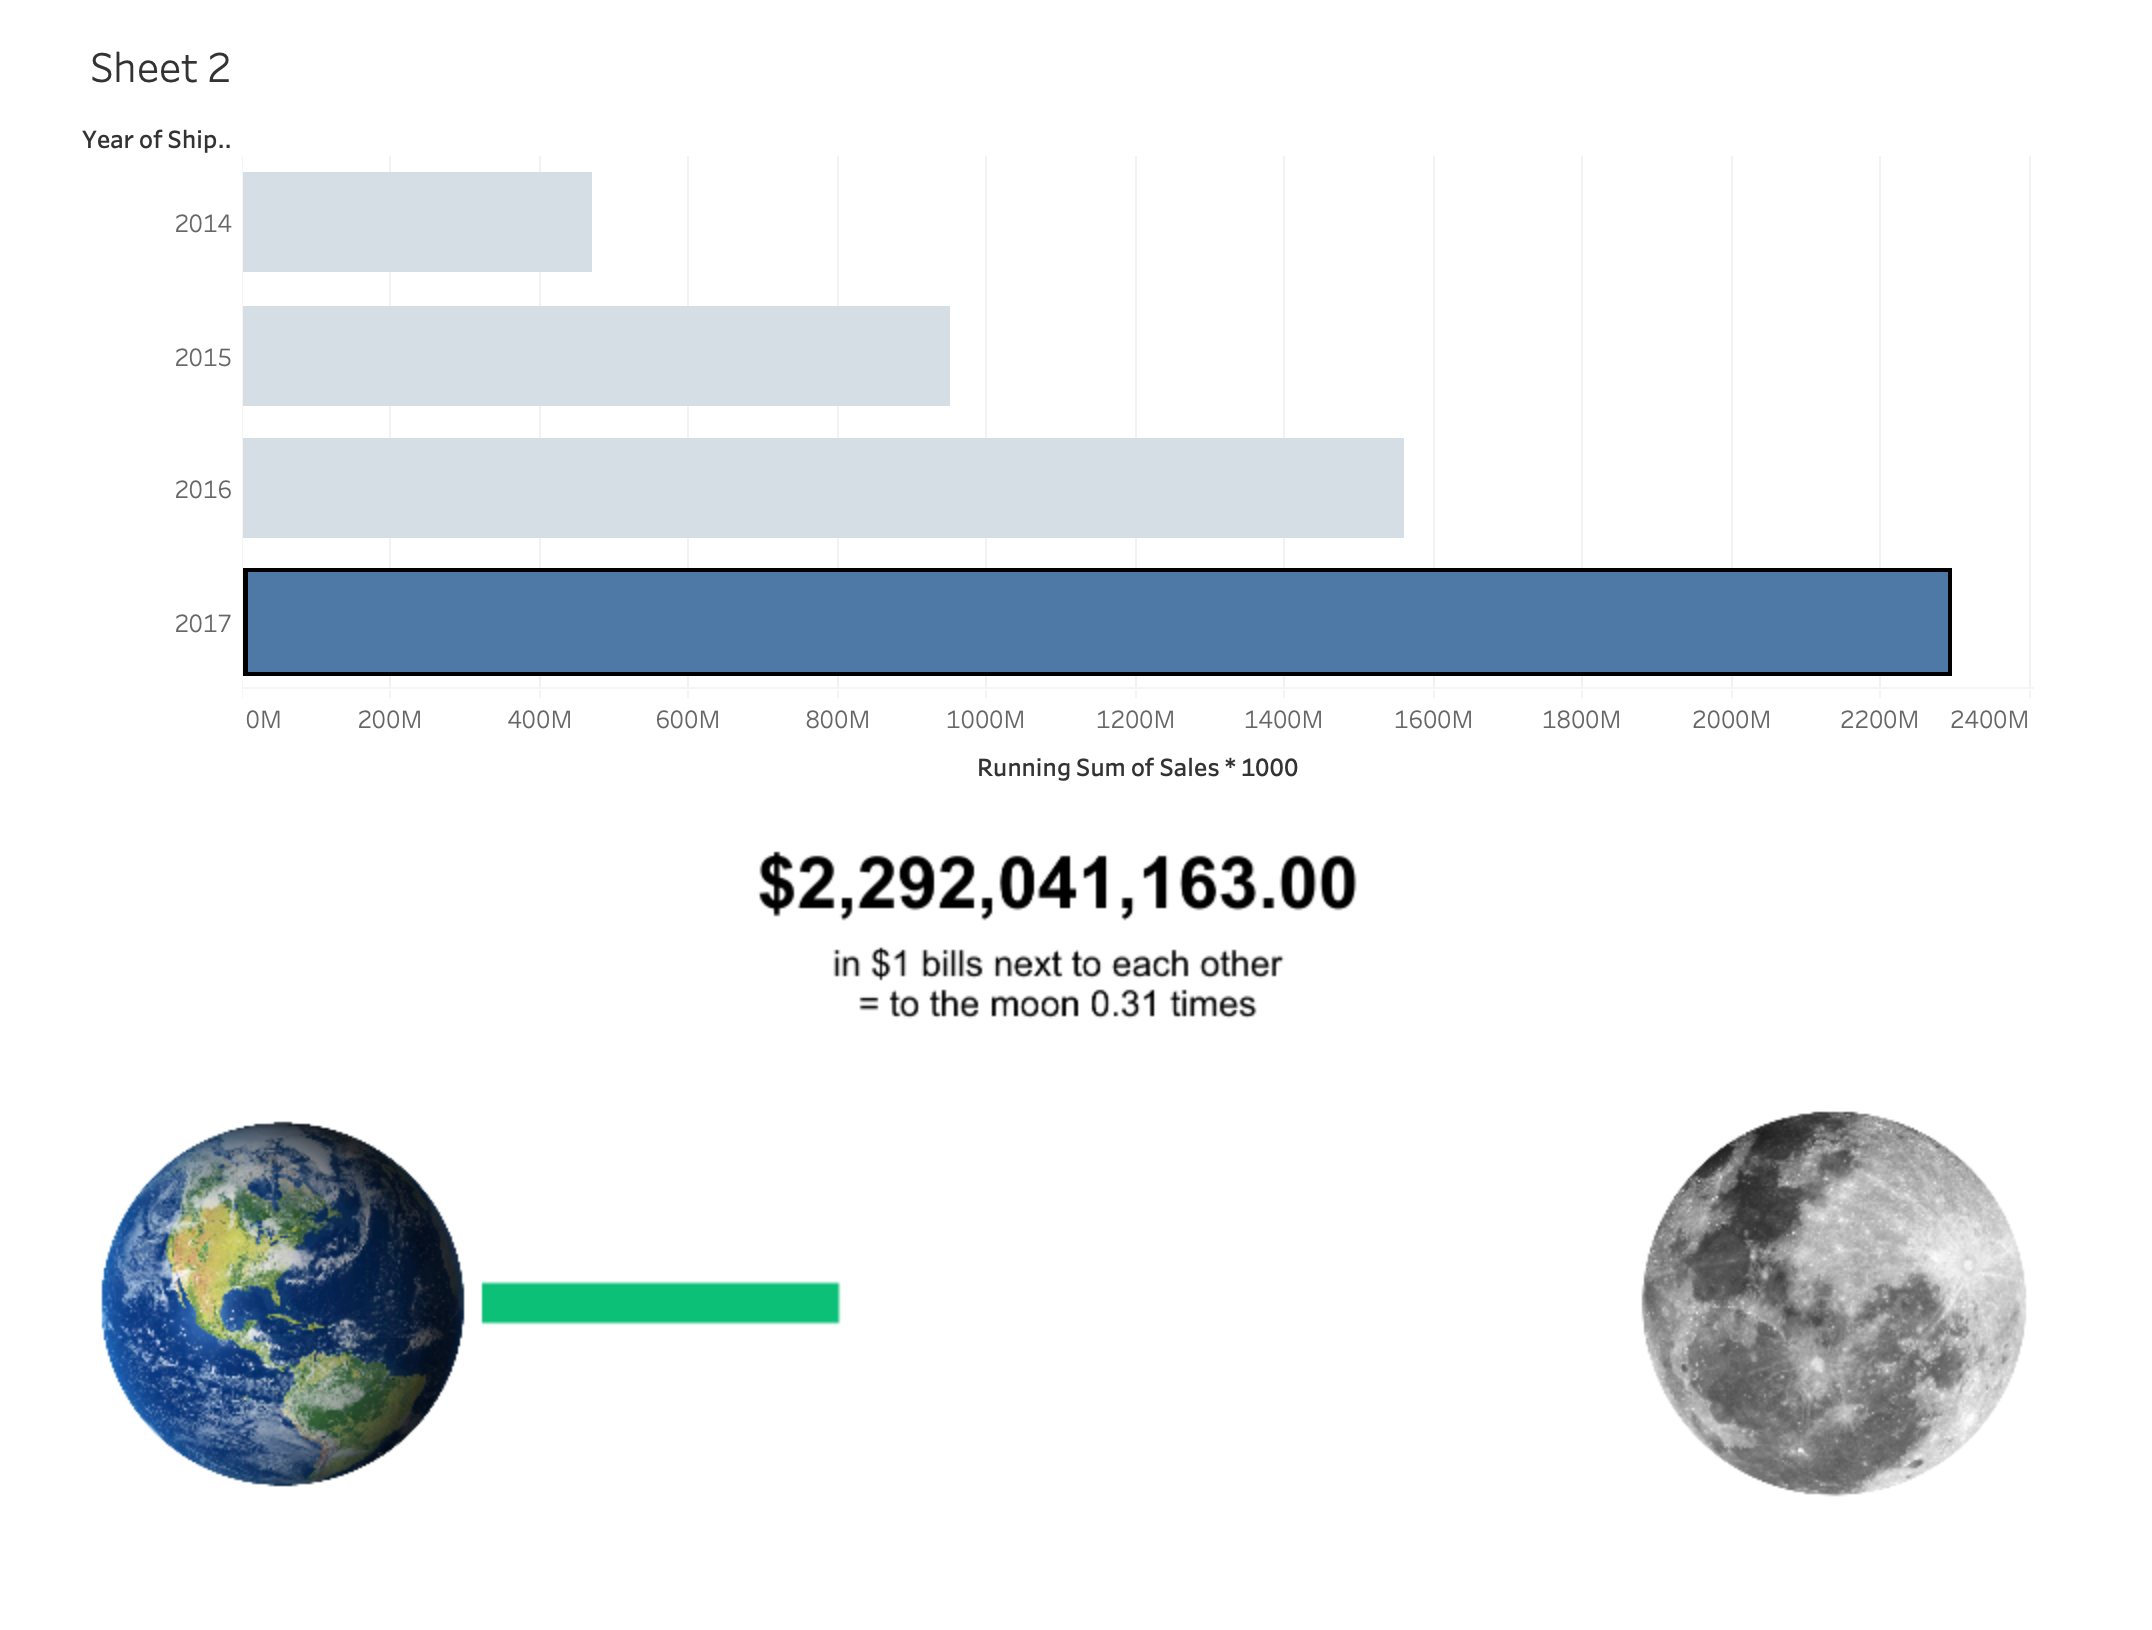
The result is a Tableau extension that I called “Pile”. The user places the extension on the dashboard, together with another sheet that displays company sales or profit measures and connects the two. After this, the user has various options to alter the comparison between the money and real world objects. The user can choose different real world objects and different bill sizes such as $1 and $50 bills or a €1 coin. The metrics from the selected marks in the dashboard will be summed up and the height of a real world pile will be calculated according to the actual thickness of dollar bills or euro coins. Then, the on-screen scale of the pile of money and the object such as a red telephone box will be calculated and displayed accordingly to give the user an idea of the scale. Image 1: Comparison of a pile of money next to a telephone box. Image 2: How far would a line of $1 bills stretch when you’re trying to reach the moon? I invite you to check out the extension yourself and play around with it. I hope you’ll enjoy!
(Right mouse click on button -> Save Link as…)Greetings, Dennis van Oosten – Developer
We love to make solutions and help Tableau users to do things more efficiently. If you have feedback, ideas, questions or need support, please make sure to share it with us! Also, don’t forget to follow us on social media for our latest news and updates.
