Extensions for Industries
Finance services solutions.
Step into the future of financial analytics.
Seamlessly integrate & visualize real-time data, gaining valuable insights into finance trends, performance, risk & compliance. Whether you are a financial analyst, a portfolio manager, or an executive who makes critical business decisions, these innovative solutions seamlessly integrate with your Tableau environment, empowering you to uncover hidden patterns, trends, and opportunities.

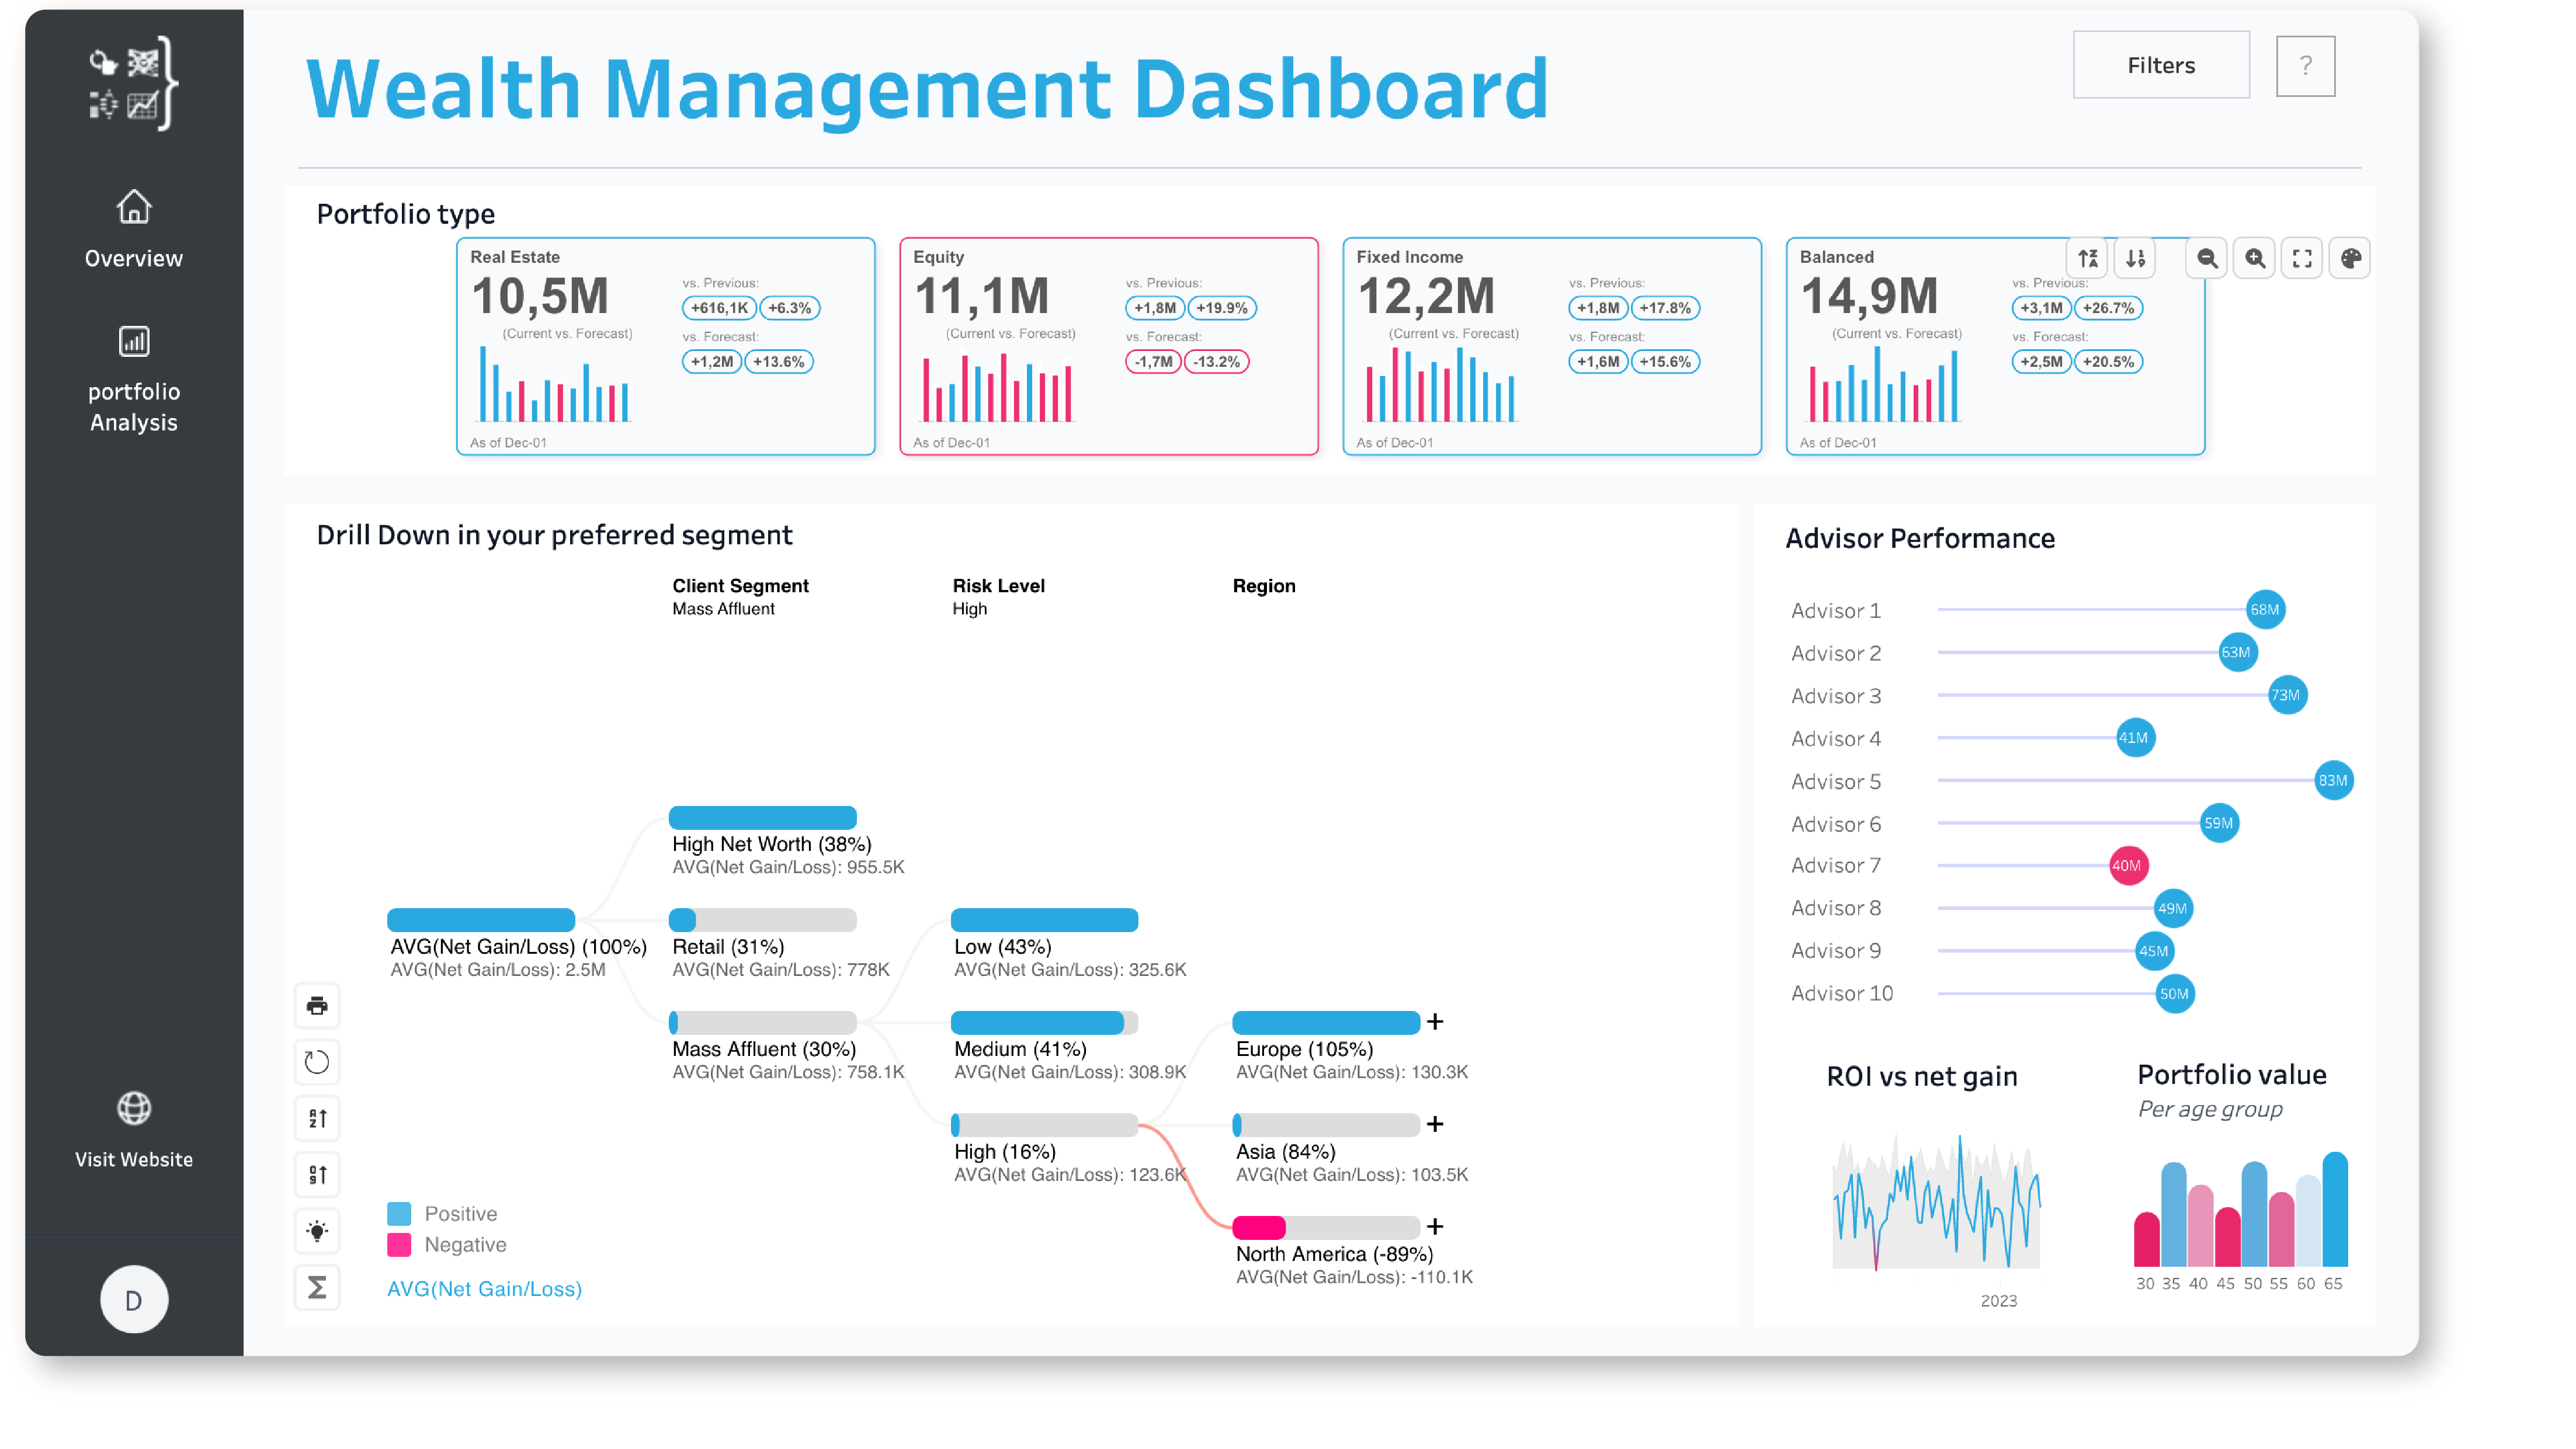
The Wealth Management Dashboard provides comprehensive portfolio insights through intuitive visualizations. This solution empowers wealth managers to analyze their investment portfolios in-depth, and uncover key trends to make informed decisions. Download to experience the power of Waterfall chart, PowerKPIs and DrillDownTree.

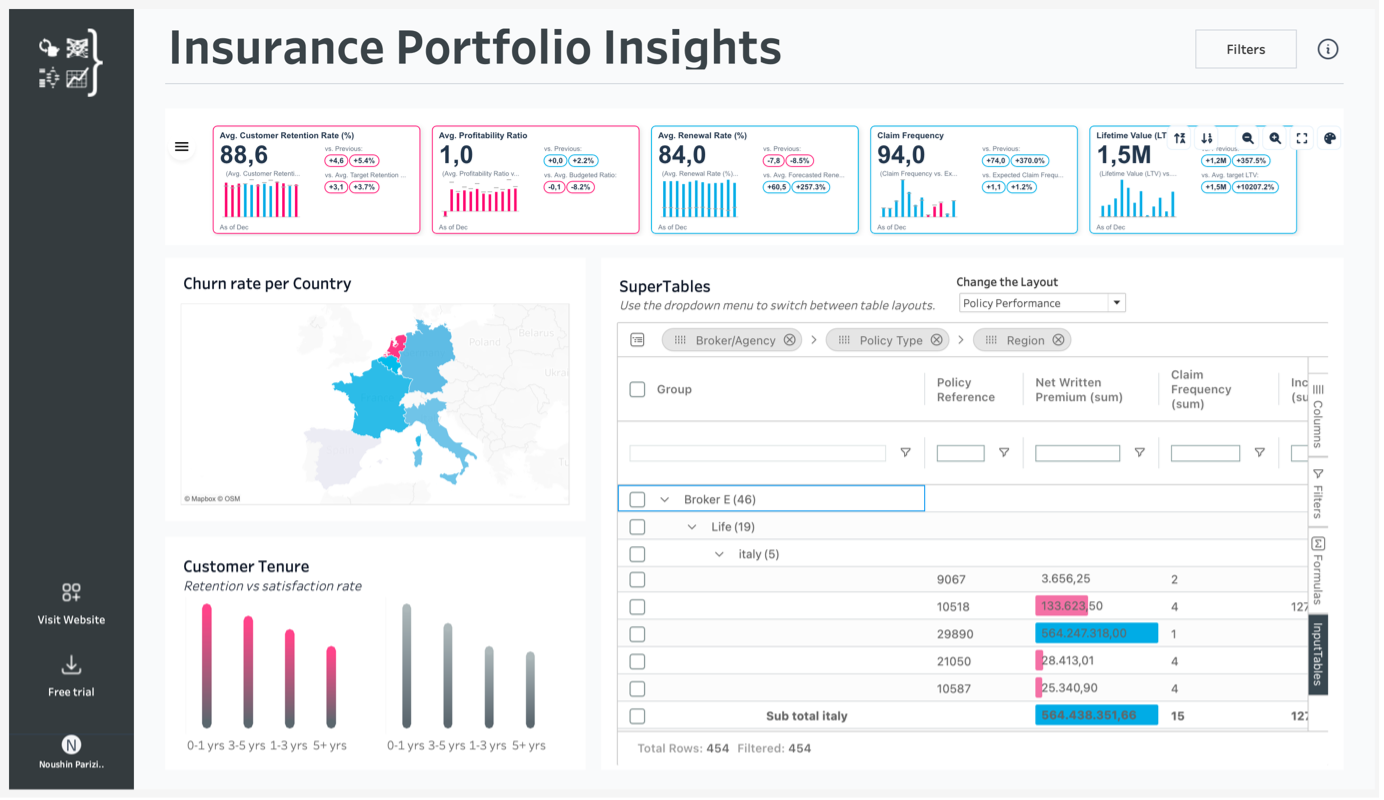
Transform your insurance analytics with this powerful, ready-to-use Insurance Portfolio Dashboard! Designed to simplify complex data and drive actionable insights, this solution helps you monitor key metrics like customer retention, profitability, and policy performance—all at a glance. By combining Tableau's native capabilities with advanced extensions like SuperTables and PowerKPIs, this dashboard offers unmatched clarity and flexibility for data-driven decision-making. Whether you're tracking churn rates, analyzing broker performance, or visualizing profitability trends, this dashboard is your all-in-one tool for success. Download it now and start making smarter, faster decisions for your insurance portfolio!
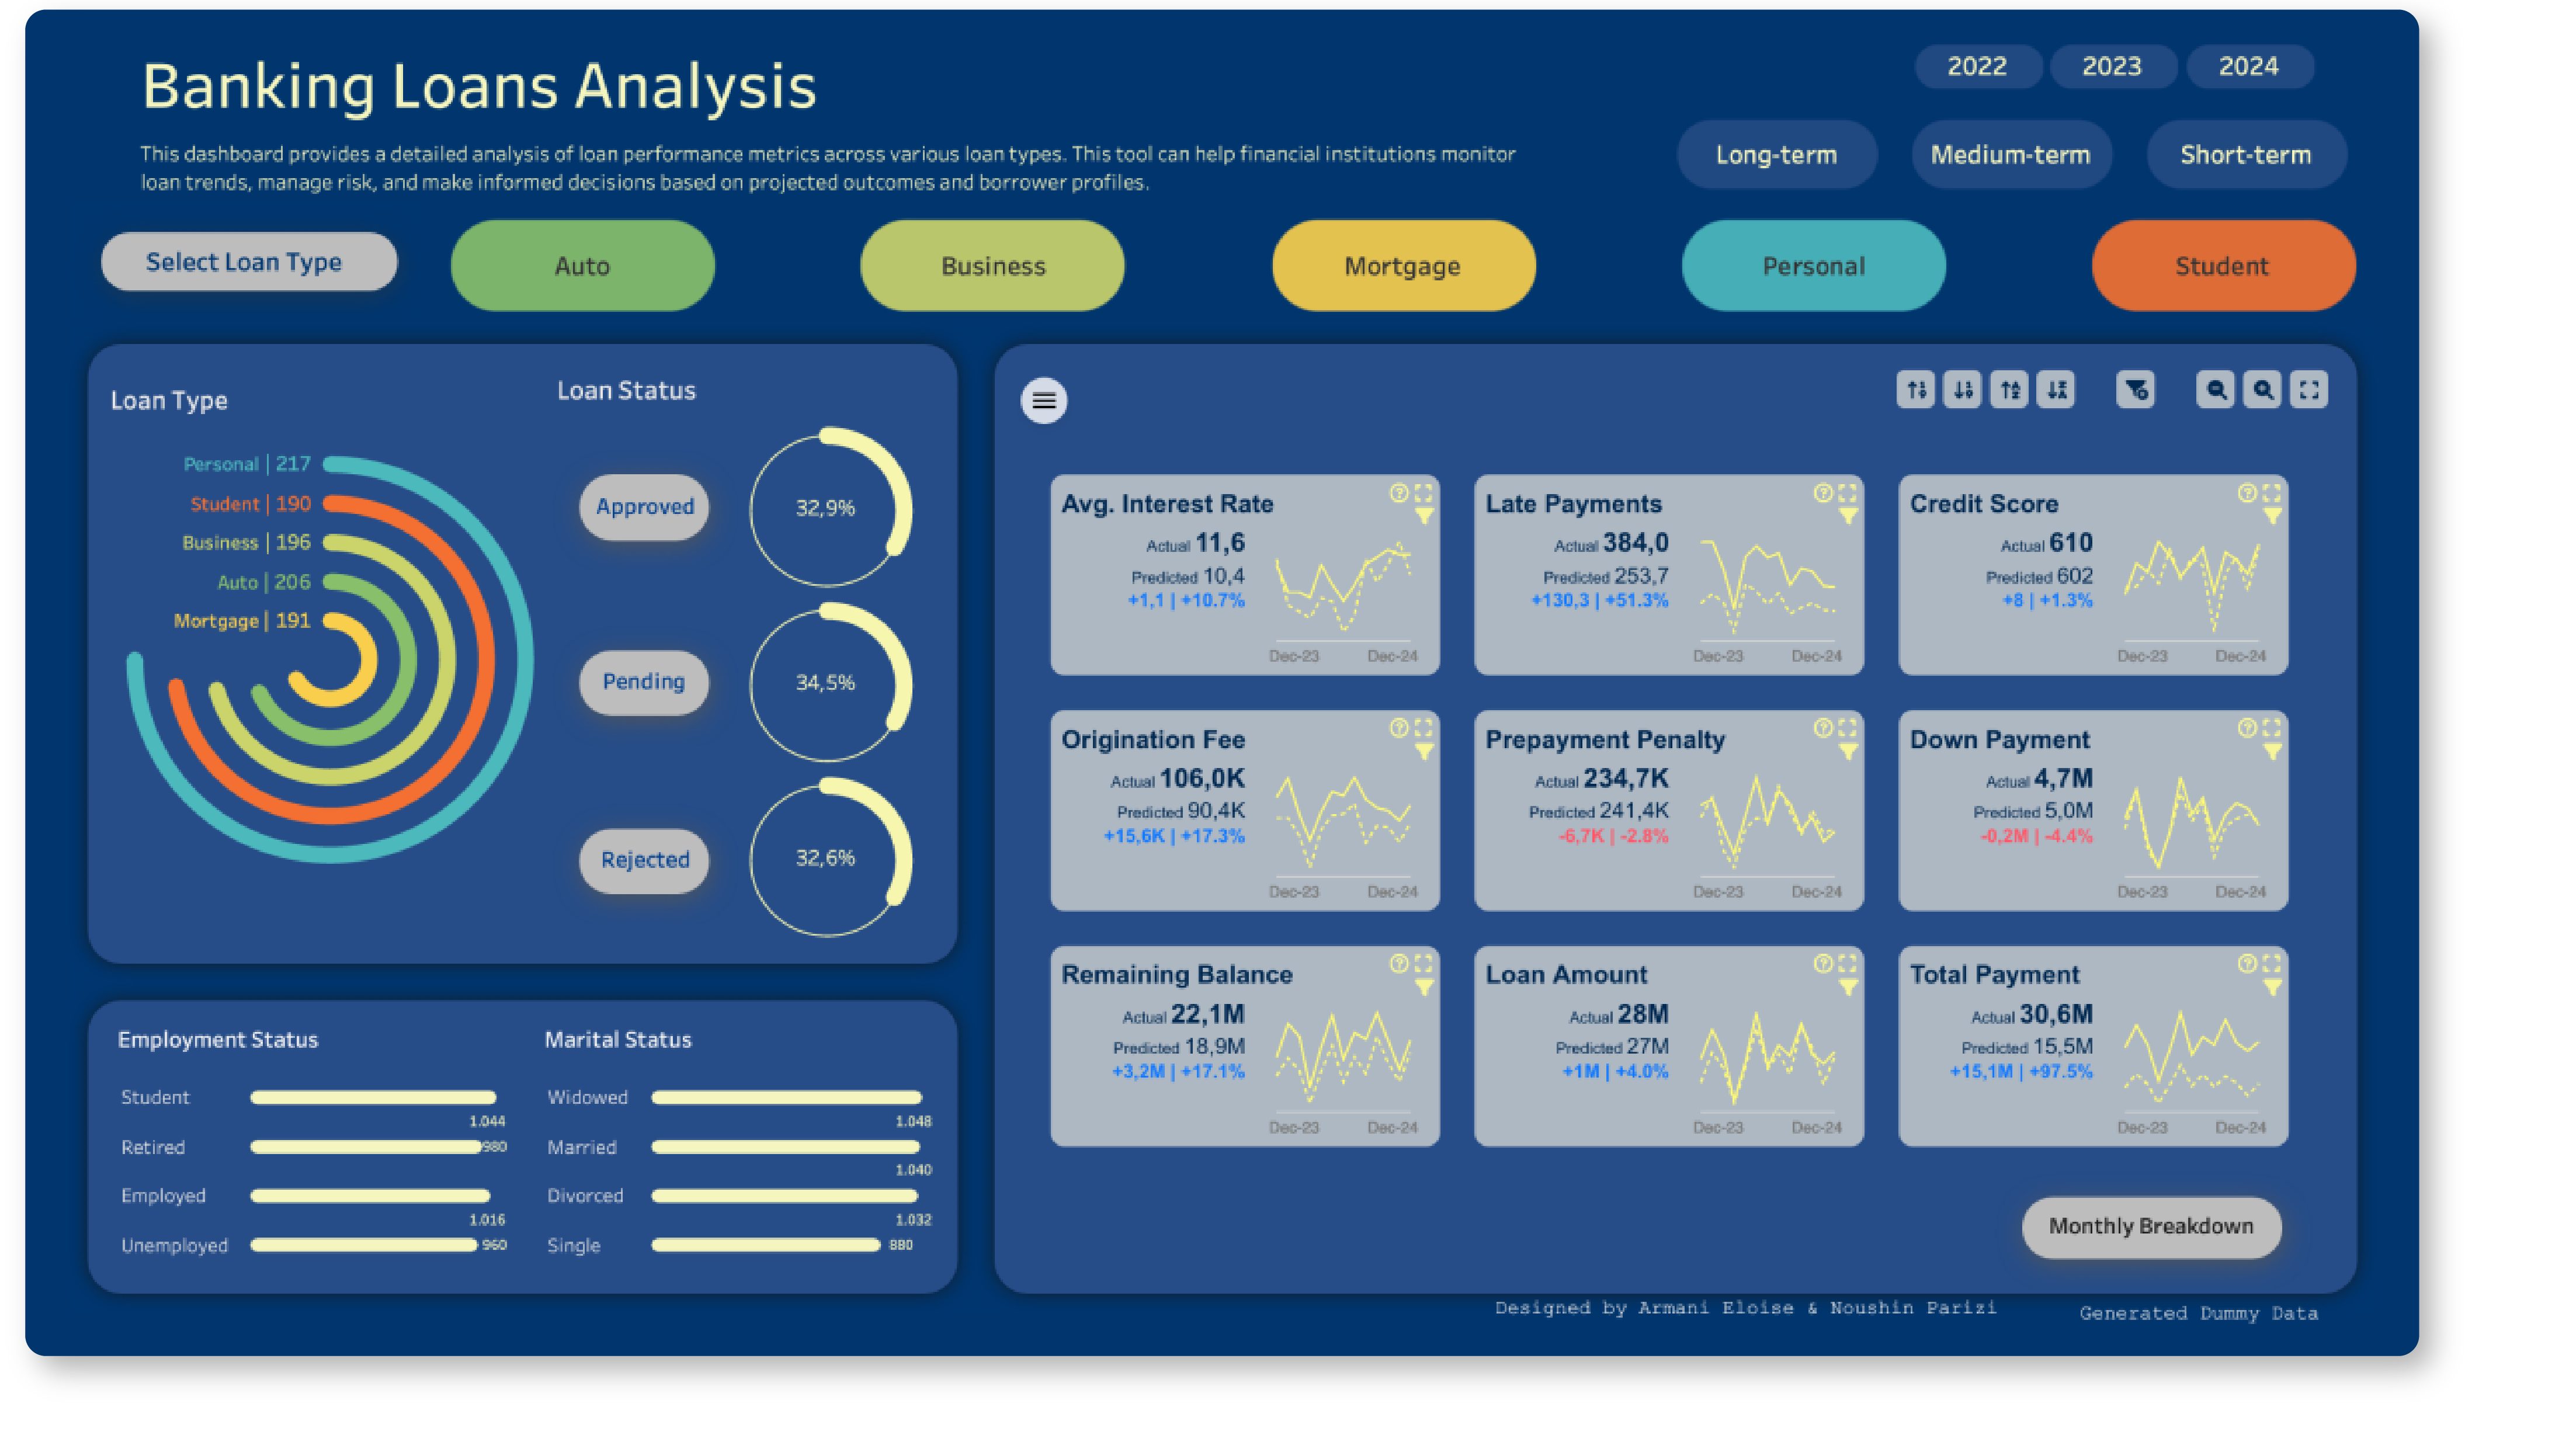
This is an in-depth analysis of banking loan performance across various types powered by SuperTables and PowerKPIs. The first dashboard offers detailed insights, allowing users to filter and explore key metrics like credit score, interest rates, and remaining balances. The second dashboard provides a high-level summary of loan status, trends, and borrower demographics, helping financial institutions track loan health, manage risks, and easily make data-driven decisions. It's a comprehensive solution for strategic insights and efficient loan portfolio management.
Industry leaders who already experienced the power of our solutions.


Creating a Data Community
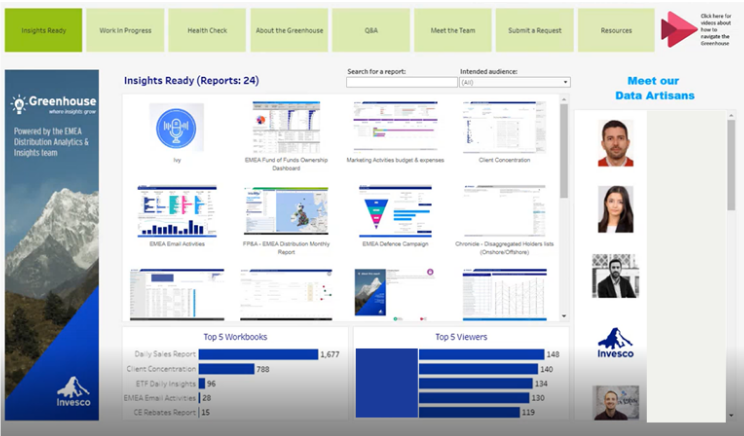
Invesco built a solution called the Greenhouse. This is a landing page in which all the reports within the company are displayed. The landing page shows the dashboards, metadata and its owner. This information prevents people from re-work or building something themselves that can already be found in a particular dashboard. It also makes it easier to navigate the various reports available and find the information you are looking for. Next to that, it sparks the curiosity of people and increases data literacy within the company.
Filtering, sorting and drilling down
With SuperTables, the sales representatives at Reliant Funding can now work directly in Tableau, without having to extract essential data to external Excel files. One of the most significant results that Reliant Funding achieved with the extension is a shift from less than 50% to 100% adoption for the sales team. Currently, all sales representatives can use the data provided in Tableau and work with it in the way they need to complete important deals.


“WriteBackExtreme gives us a very good advantage compared to competitors, as we can provide our customers with dashboards that have editing functionalities”
– Aline Léonard, Data Visualization Specialist at Fraudio
Learn from real life use cases.
Building an Advanced Insurance Portfolio Dashboard using SuperTables and PowerKPIs Viz Extensions

Tradesmith innovating in the fast-paced world of fintech with ShowMeMore
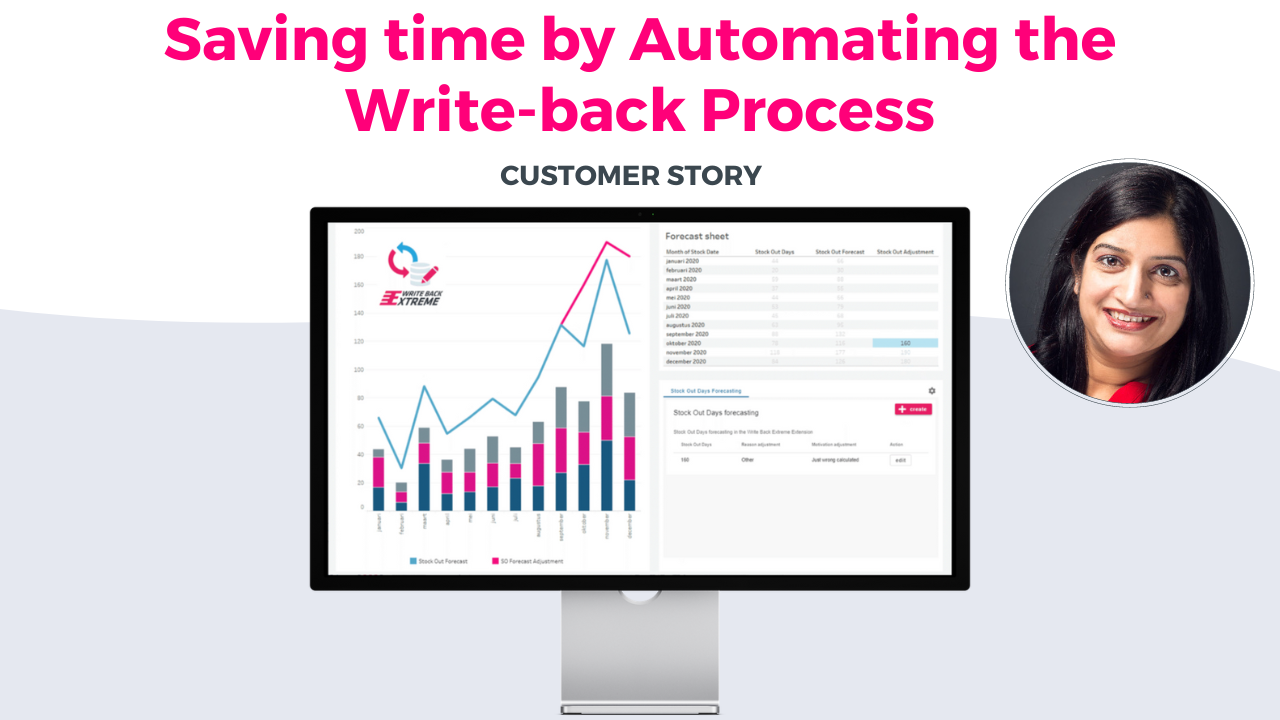
How Automating the Write-back Process in Tableau Save Your Time?

Reliant Funding got 100% end-user adoption with SuperTables


Revolutionize finance data with trusted partners.
The Apps for Tableau partner network is a trusted and experienced team of consulting and reseller partners, dedicated to serving finance professionals worldwide in their native language.
Discover how finance-focused solutions can revolutionize the way you handle data, enabling you to make better-informed decisions and achieve remarkable outcomes in the finance industry. Locate a trustworthy partner and start optimizing your data-driven journey.

FAQ
Yes! Apps for Tableau has officially achieved ISO/IEC 27001:2022 certification.
You can find the information about our data security here.
Absolutely, our primary deployment method for extensions is on-premises. We prioritize your data security and privacy.
Rest assured, your data is completely secure because we never have access to your data or environment. Our solutions run locally on the computer of the client and will not send any data to Apps for Tableau. We also offer on-premises solutions which do not require any internet connection. For more info visit the Data Security page and download the whitepaper.
If you have a unique use-case, our support team is here to assist you. Simply request a demo via the form on this page, and we will work with you to find a solution tailored to your needs.
Yes, you can access a free trial of an alternative extension via our extension manager.