Demo Gallery
Find pre-built workbooks, implement it in your Tableau Environment and align with your use case.
Get Started with SuperTables following the Youtube video

FinanceTables brings P&Ls, budget vs actuals, and management reports into Tableau, delivering structured, IBCS-certified reporting for everyday finance workflows.

A demonstration workbook for the WriteBackExtreme solution. Please be aware that data will be purged every day. Use this password in the workbook: demodemo
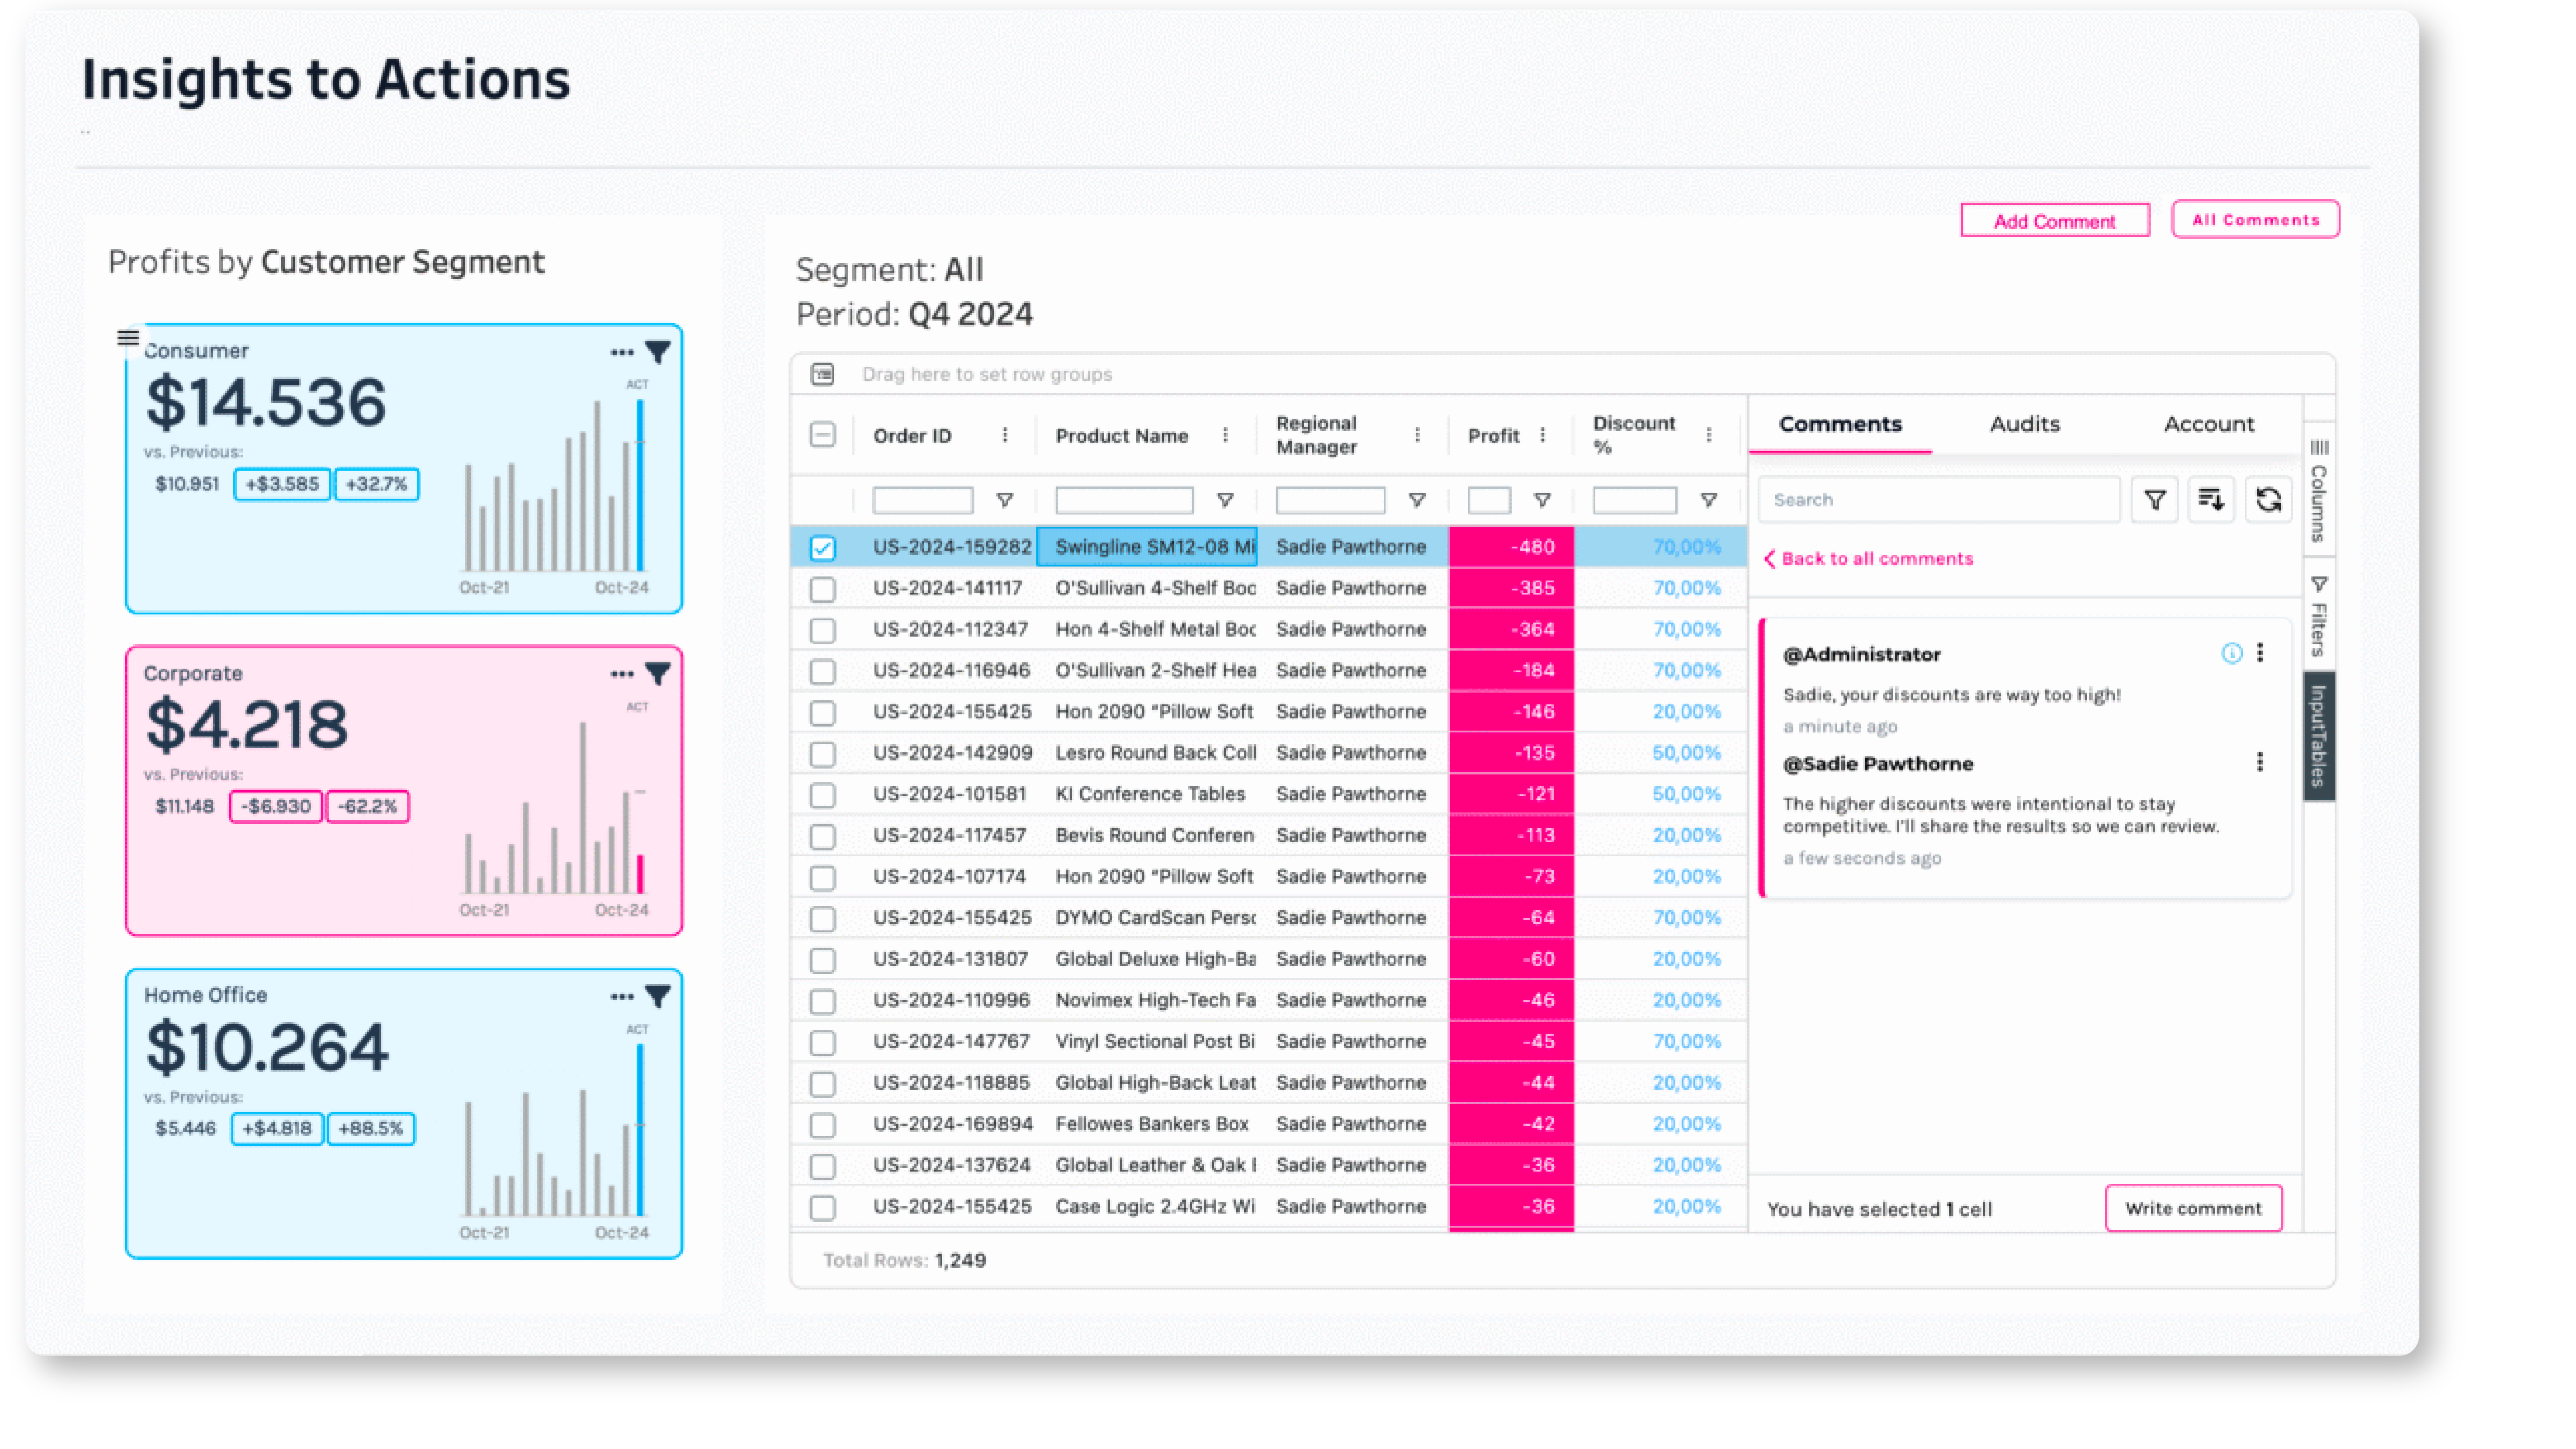
This is a general demoworkbook that shows a full cycle of spotting outliers, analysing the root cause, taking action and message a fellow dashboard user.
Keep track of all dashboard interactions. Monitor user properties, dashboard actions, filter changes, parameter changes and mark selections.
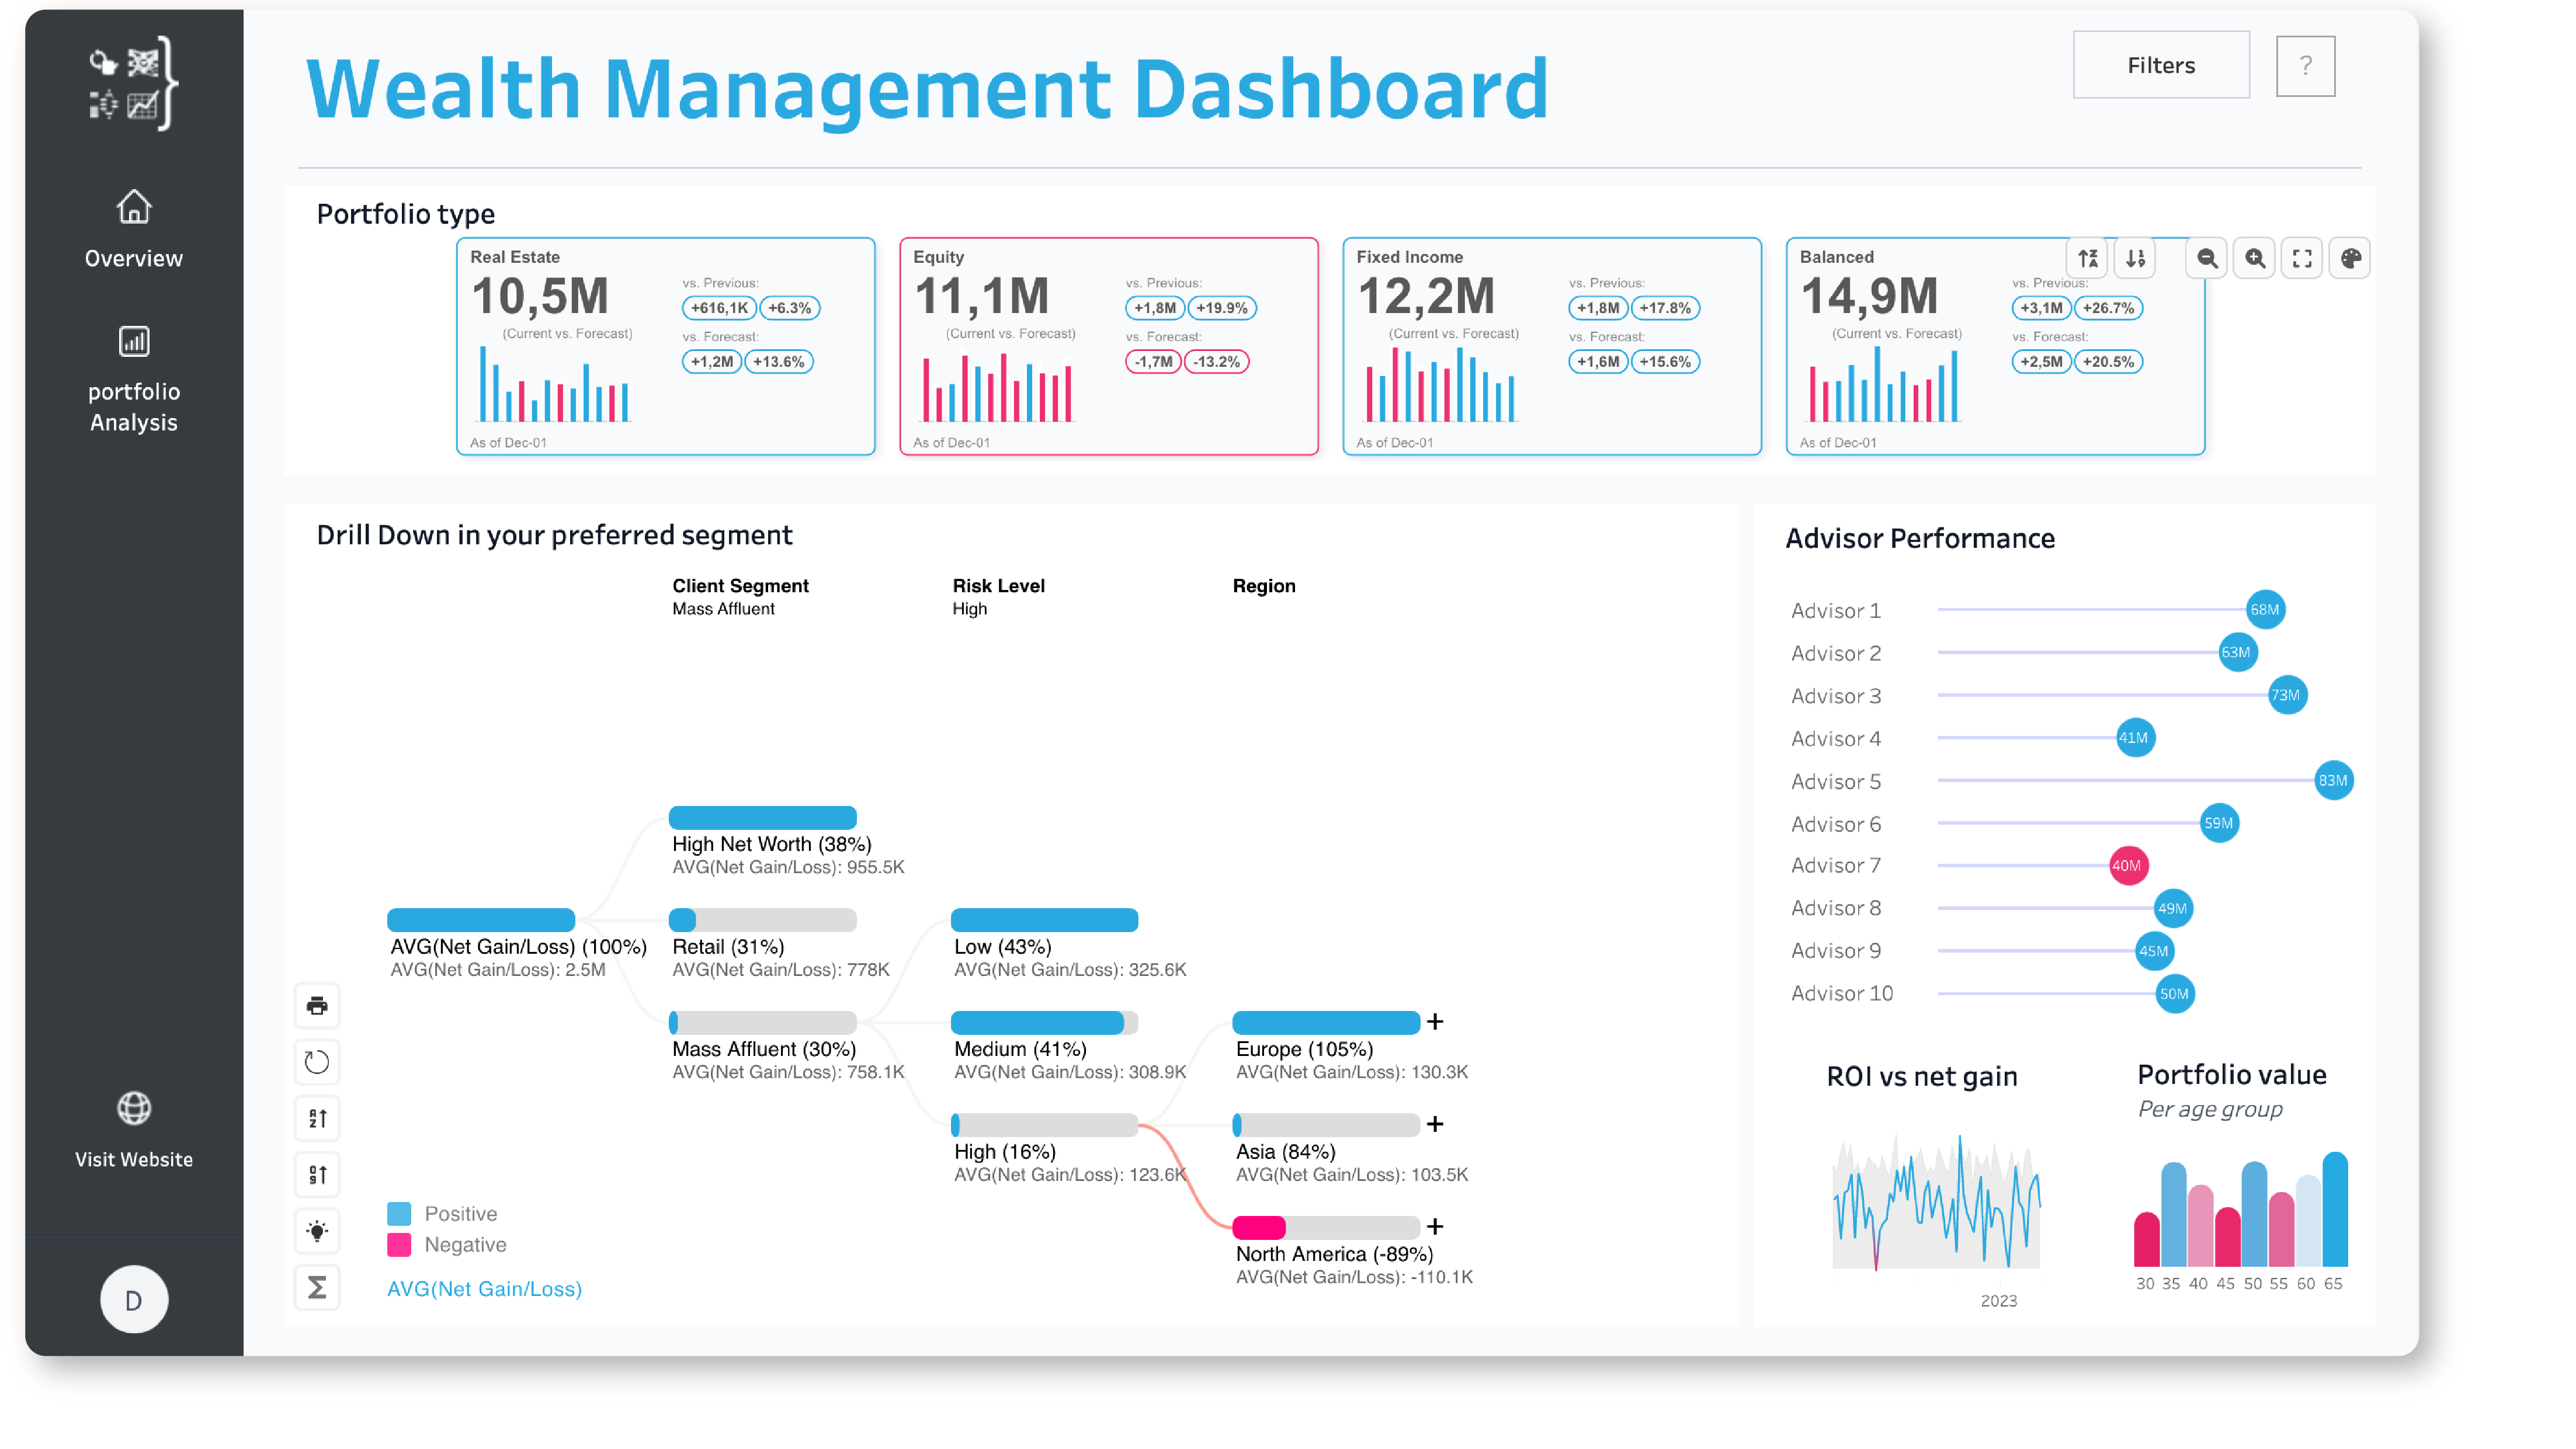
The Wealth Management Dashboard provides comprehensive portfolio insights through intuitive visualizations. This solution empowers wealth managers to analyze their investment portfolios in-depth, and uncover key trends to make informed decisions. Download to experience the power of Waterfall chart, PowerKPIs and DrillDownTree.

Make people better understand your dashboard by offering highly formatted help screens or inline content. Explain the goals of your dashboard or visualization to all your users with a highly configurable editor.

The EasyDesigns Extension helps you to create beautiful Dashboards in Tableau to show your business results on a next level!

This extension visualizes flat or recursive data into a Hierarchy filter. Instead of having multiple filters in your dashboard, you can create a hierarchy filter with only one.
Enrich your dashboards with dynamic product images or example thumbnails right from your dataset. Your dashboards never looked this appealing!
Drill Down power to the Dashboard user! Allow your dashboard users to visually drill down on any dimension in any order they want. Save space by using pop-up mode...
Add new visualization types like the Sankey Diagram, Network diagram and Radar Chart to your Tableau Dashboards. Your complex vizzes can now be done in minutes instead of hours or days.
Add new visualization types like the Sankey Diagram, Network diagram and Radar Chart to your Tableau Dashboards. Your complex vizzes can now be done in minutes instead of hours or days.

Enrich your dashboards with dynamic product images or example thumbnails right from your dataset. Your dashboards never looked this appealing!
Drill Down power to the Dashboard user! Allow your dashboard users to visually drill down on any dimension in any order they want. Save space by using pop-up mode...

Offer flexible Excel like tables in your Tableau Dashboards. Embed self service flexibility on datagrids with your Tableau governed data!

Offer flexible Excel like tables in your Tableau Dashboards. Embed self service flexibility on datagrids with your Tableau governed data!

Transform your insurance analytics with this powerful, ready-to-use Insurance Portfolio Dashboard! Designed to simplify complex data and drive actionable insights, this solution helps you monitor key metrics like customer retention, profitability, and policy performance—all at a glance. By combining Tableau's native capabilities with advanced extensions like SuperTables and PowerKPIs, this dashboard offers unmatched clarity and flexibility for data-driven decision-making. Whether you're tracking churn rates, analyzing broker performance, or visualizing profitability trends, this dashboard is your all-in-one tool for success. Download it now and start making smarter, faster decisions for your insurance portfolio!
The general PowerKPIs demo workbook with different use cases and data examples.
The general PowerKPIs demo workbook build with VizExtensions
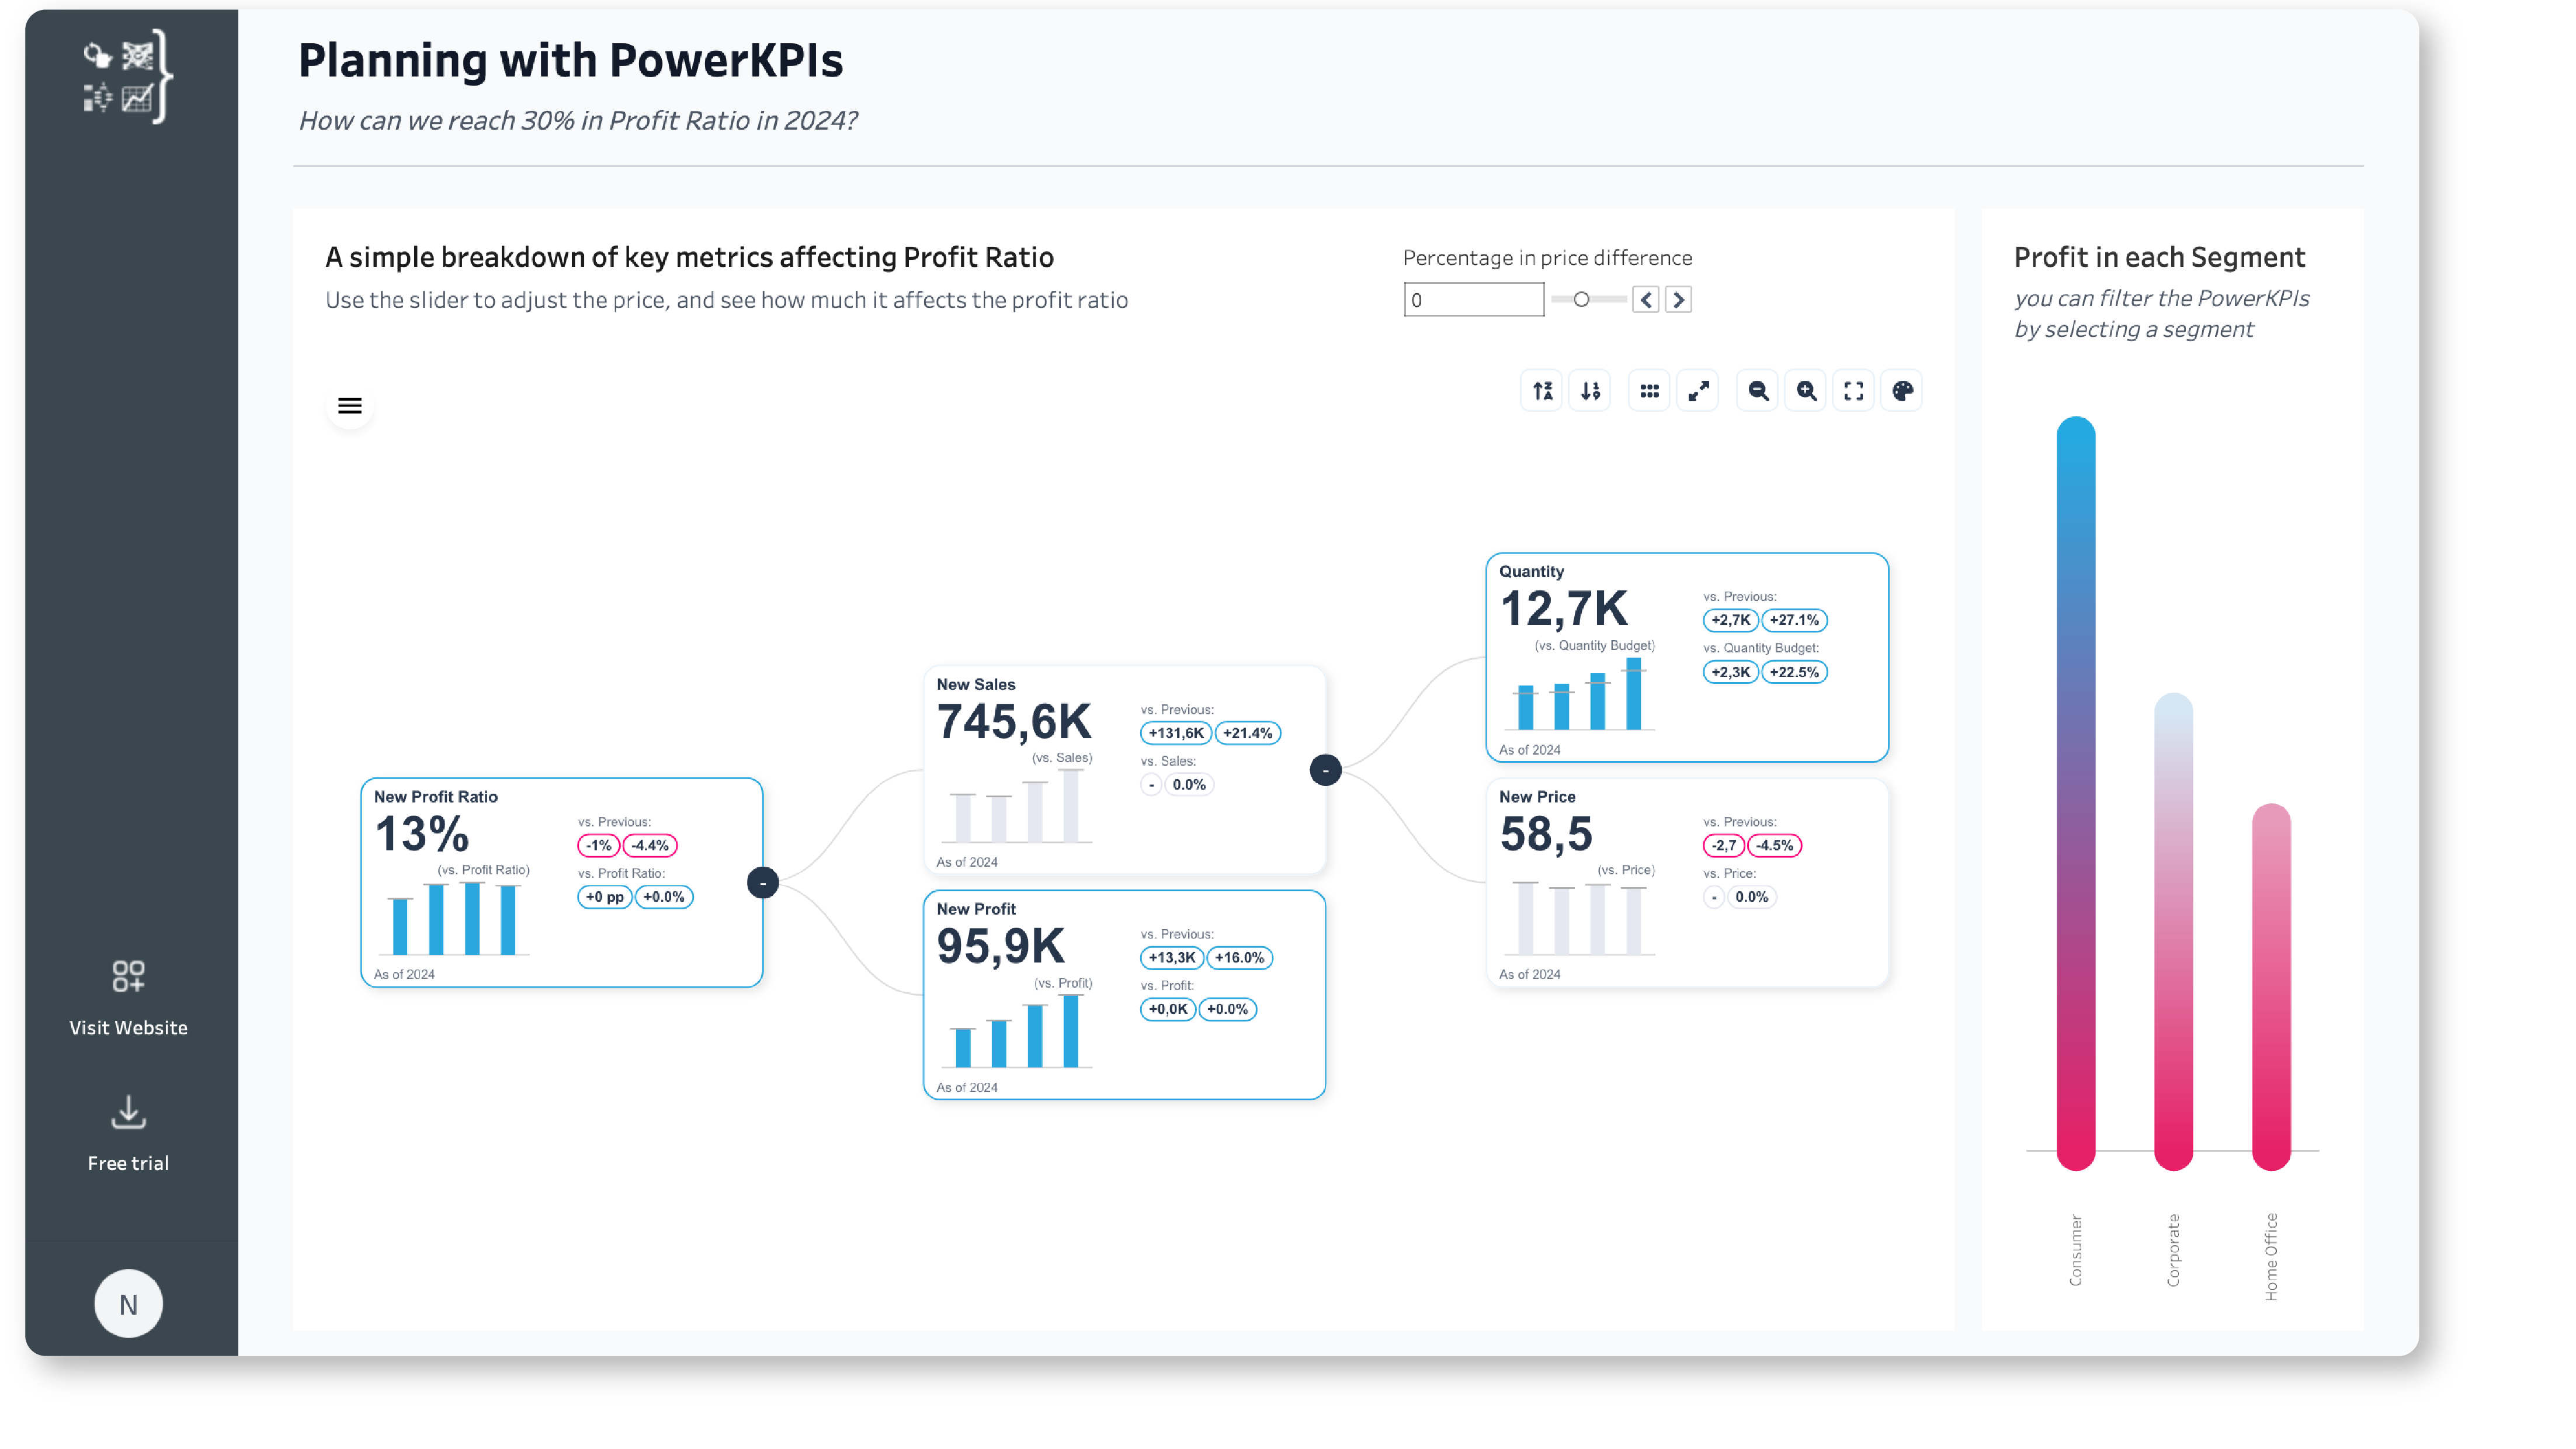
This dashboard gives you a simple breakdown of the key metrics that affect your Profit Ratio. You can use the slider to adjust the price and see how it impacts your profit. The dashboard also shows your current year's Quantity, New Sales, New Profit, and New Price data compared to last year. This makes it easy to explore "what-if" scenarios and plan ahead.
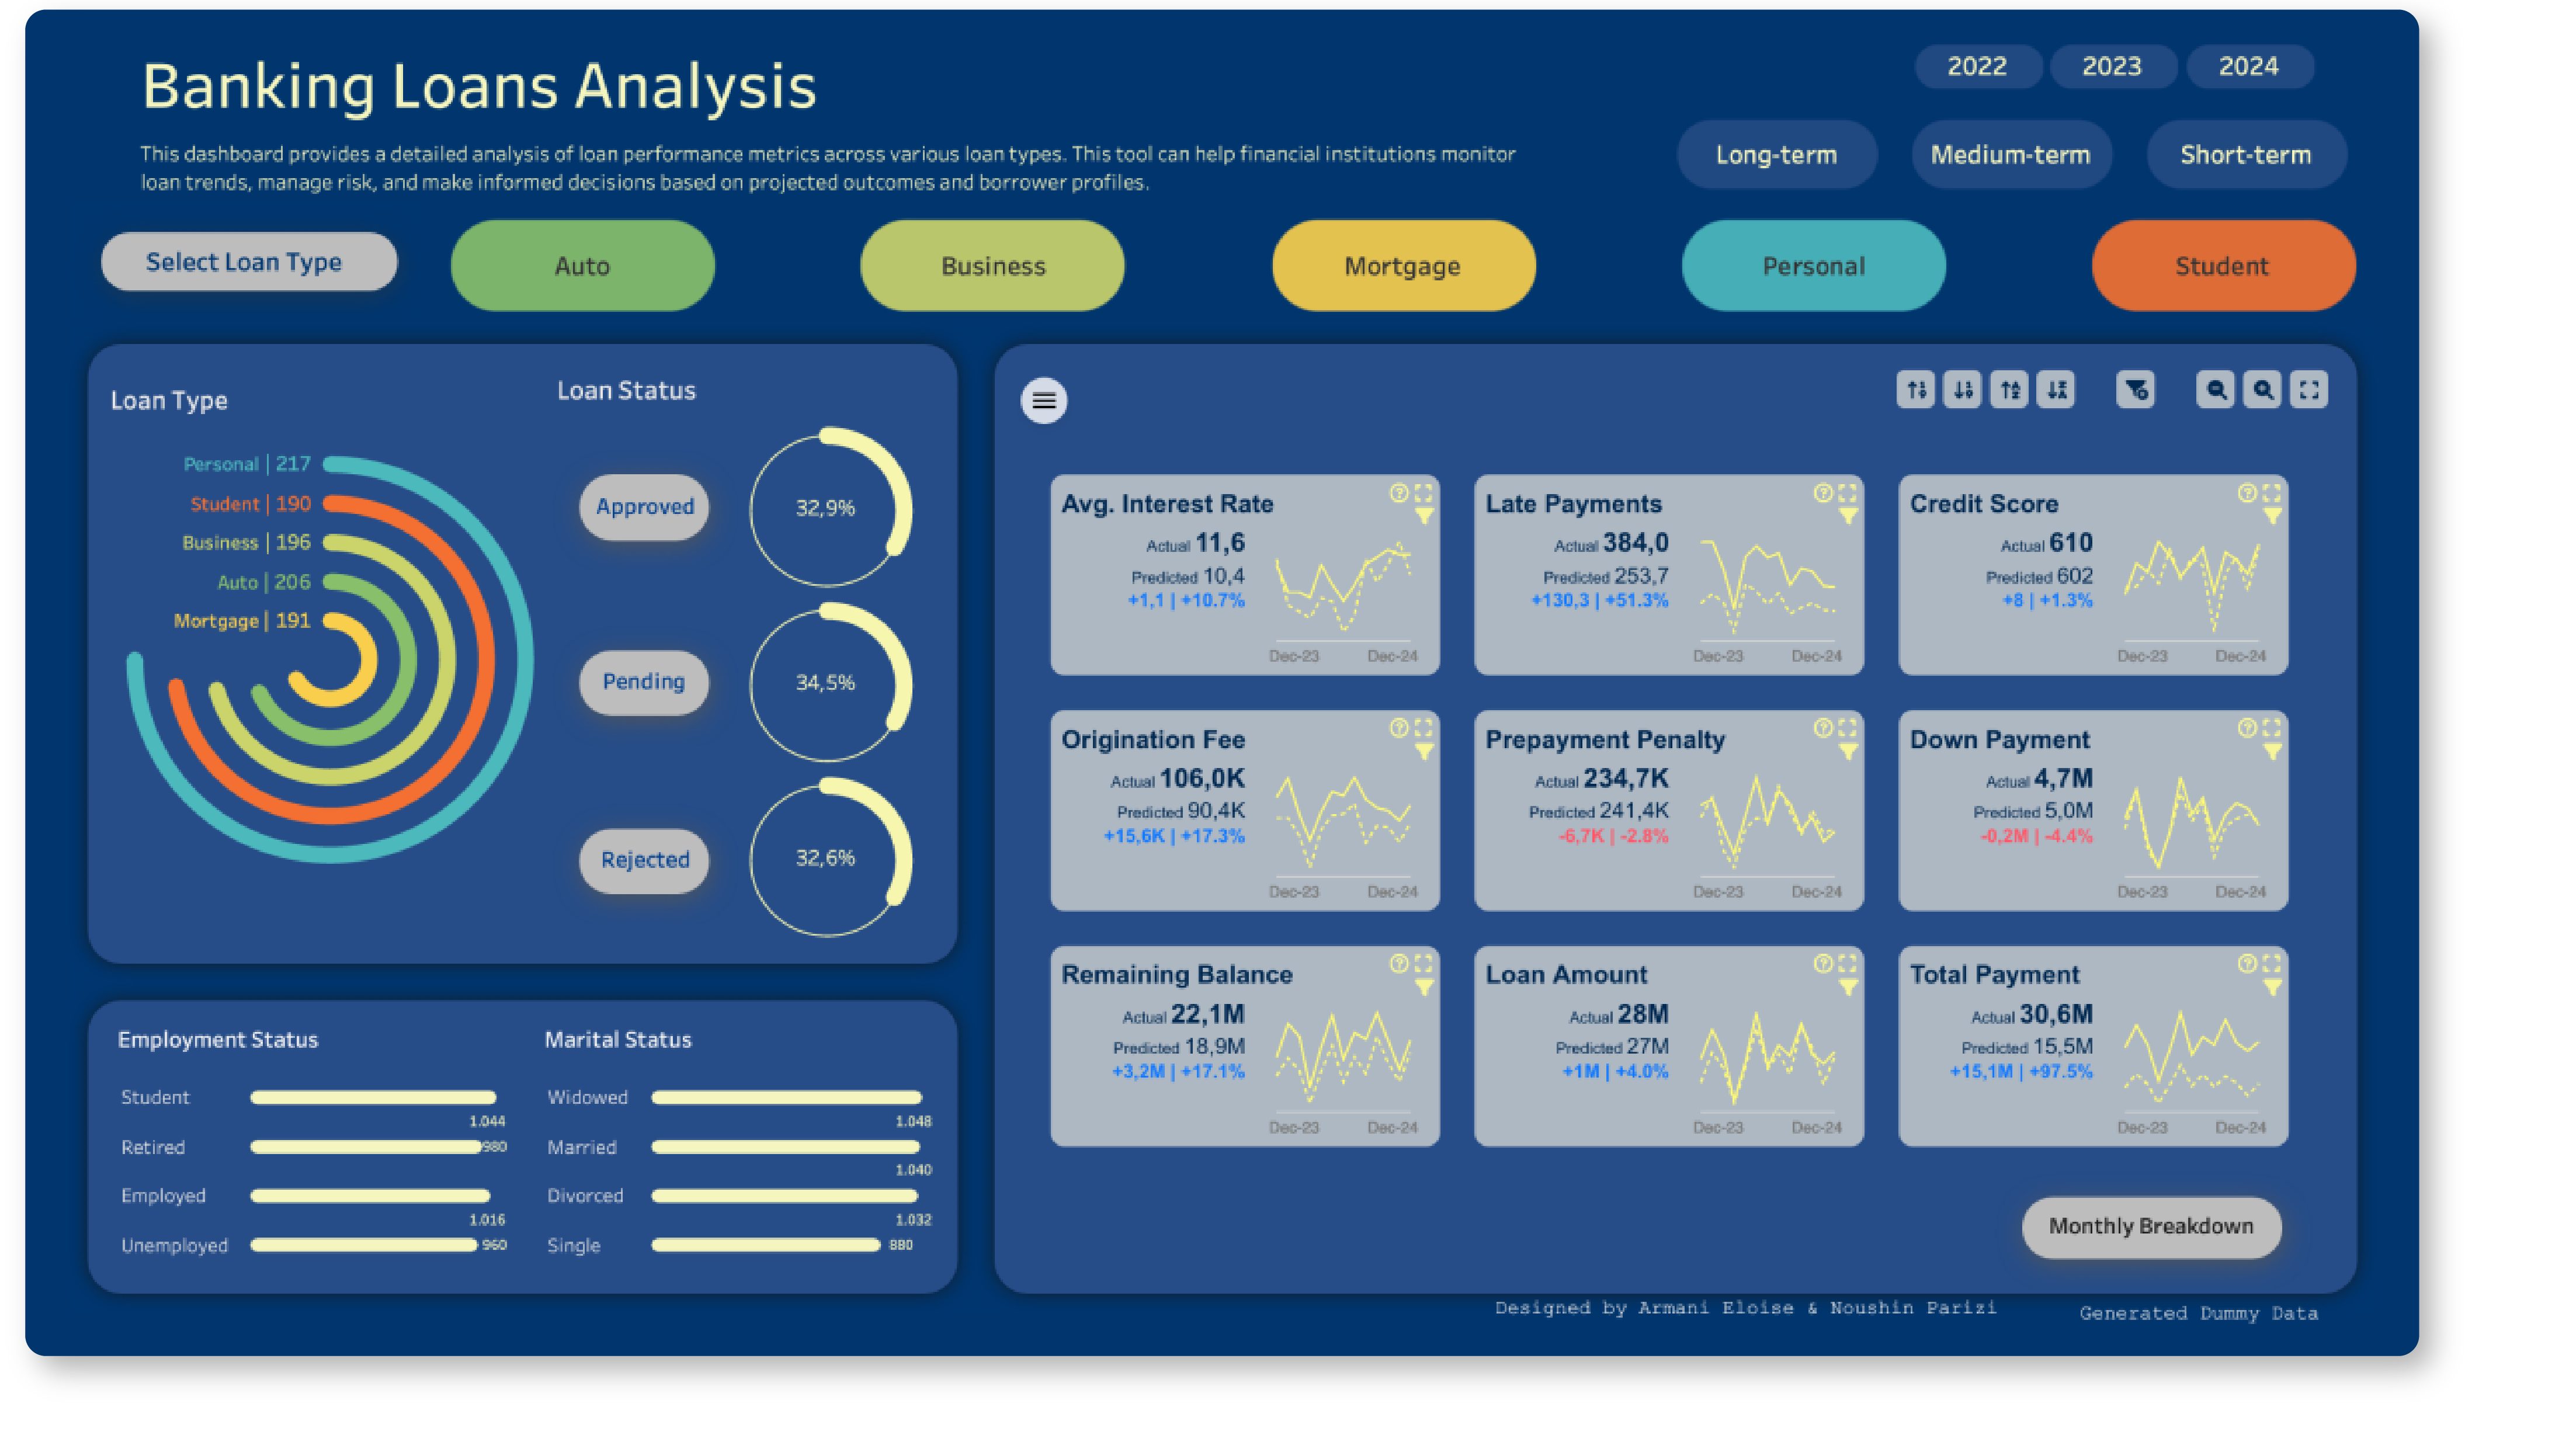
This is an in-depth analysis of banking loan performance across various types powered by SuperTables and PowerKPIs. The first dashboard offers detailed insights, allowing users to filter and explore key metrics like credit score, interest rates, and remaining balances. The second dashboard provides a high-level summary of loan status, trends, and borrower demographics, helping financial institutions track loan health, manage risks, and easily make data-driven decisions. It's a comprehensive solution for strategic insights and efficient loan portfolio management.

This solution, powered by the PowerKPIs and Sankey Viz extensions, provides a clear snapshot of educational funding and performance for institutions in 2024. It visually breaks down funding sources, tracks financial metrics like cost and revenue growth, and highlights grant distribution and student demographics. It's an essential solution for stakeholders to monitor financial health and make data-driven decisions easily.

Monitor business activity across Europe with our interactive dashboard, featuring the powerful PowerKPIs Extension. This solution enables you to assess lending interest, taxation, and business vitality across different countries. Track key performance indicators and explore historical patterns with ease. Download the workbook now to enhance your business analysis and decision-making.

Discover the ultimate hotel management dashboard with our new solution. This powerful and user-friendly workbook allows you to filter hotels by rating and availability, assess guest reviews, view check-in details and availability and change them. Download now and elevate your hotel management experience.

MySQL Database Password: demodemo Check out the top 20 must-try restaurants in your area right here in Tableau! Just like your favourite food-ordering app, this interactive Tableau dashboard allows you to explore local spots, read real reviews, rate your dining experiences, and share your feedback. Powered with PictureThis and WritebackExtreme Extensions, this solution makes your experience easy and fun!

Explore our dynamic dashboard showcasing global electricity production, clean fuel accessibility, and energy consumption, with a focus on the Netherlands. Using innovative charts like horizon and Sankey, we offer a clear view of the world's energy landscape. Dive into shifting power generation sources, track clean fuel access, and monitor CO2 emissions from coal. download this dahsboard for understanding the complexities of our energy future.

We understand the numerous responsibilities you manage, from leading teams to monitoring performance metrics. That's why we've developed PowerKPIs—to streamline your decision-making process and make your job easier.
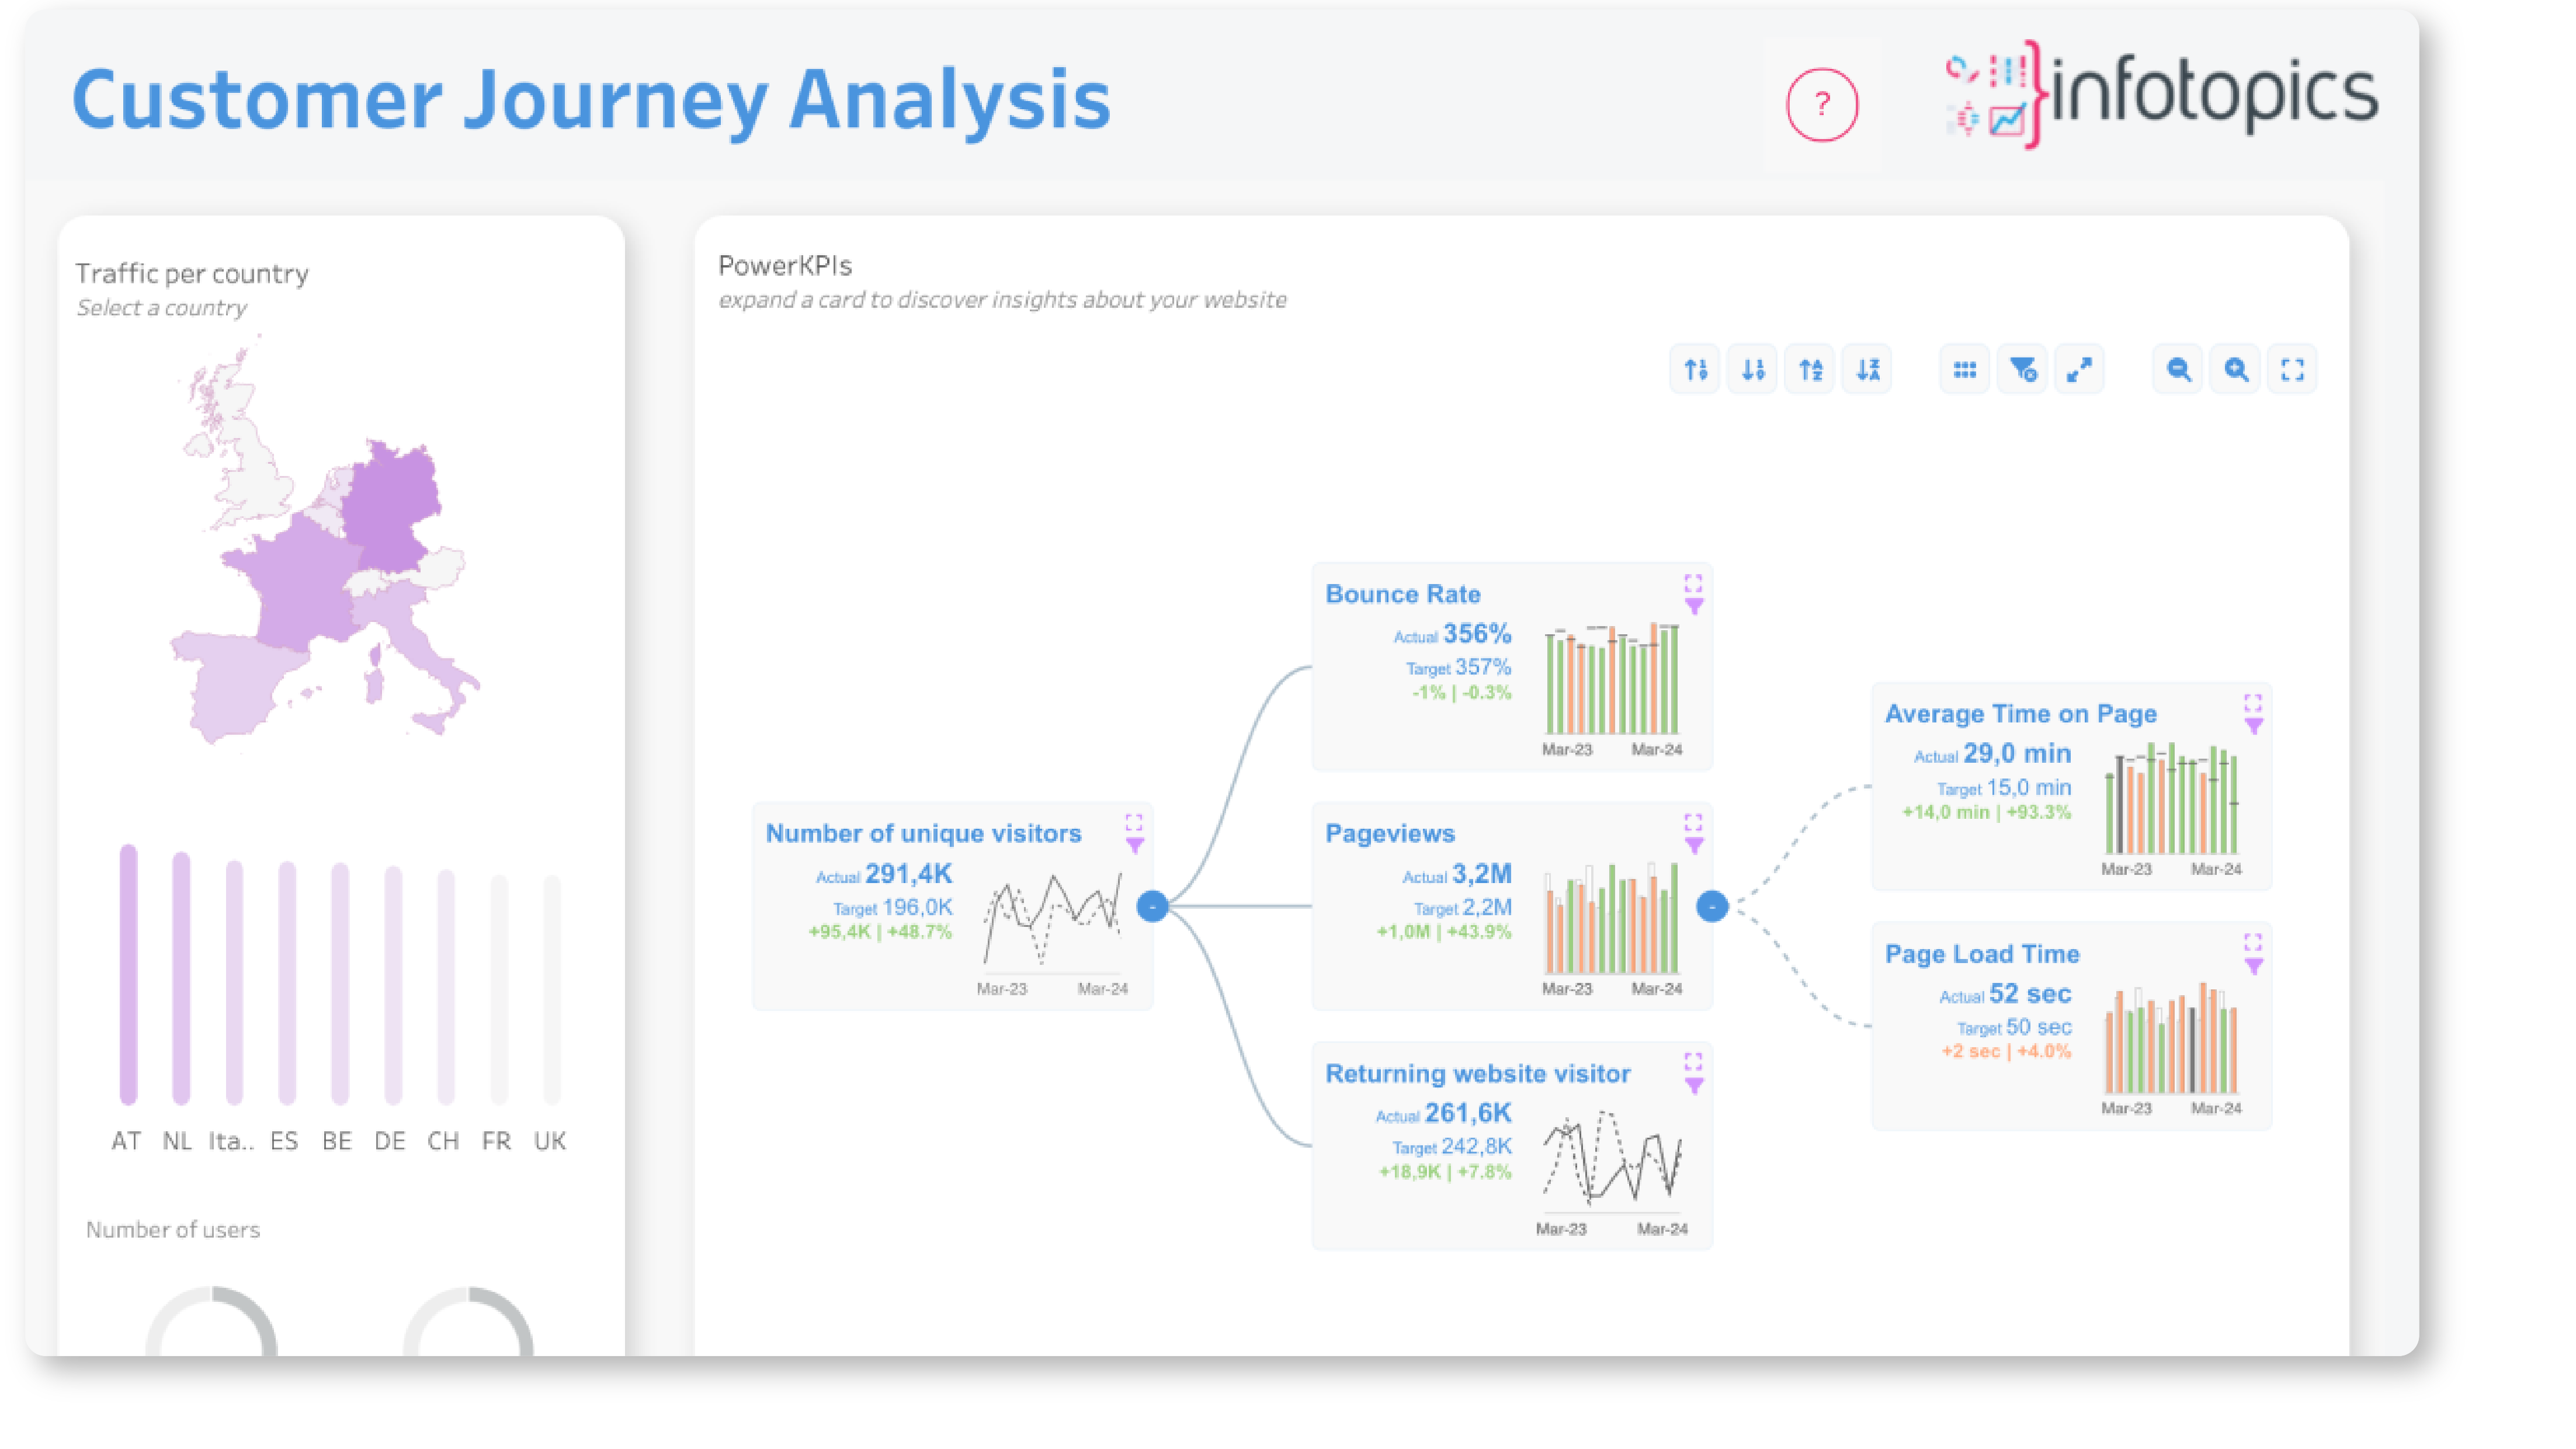
We understand the numerous responsibilities you manage, from optimising your website to monitoring performance metrics. That's why we've developed PowerKPIs—to streamline your decision-making process and make your job easier.
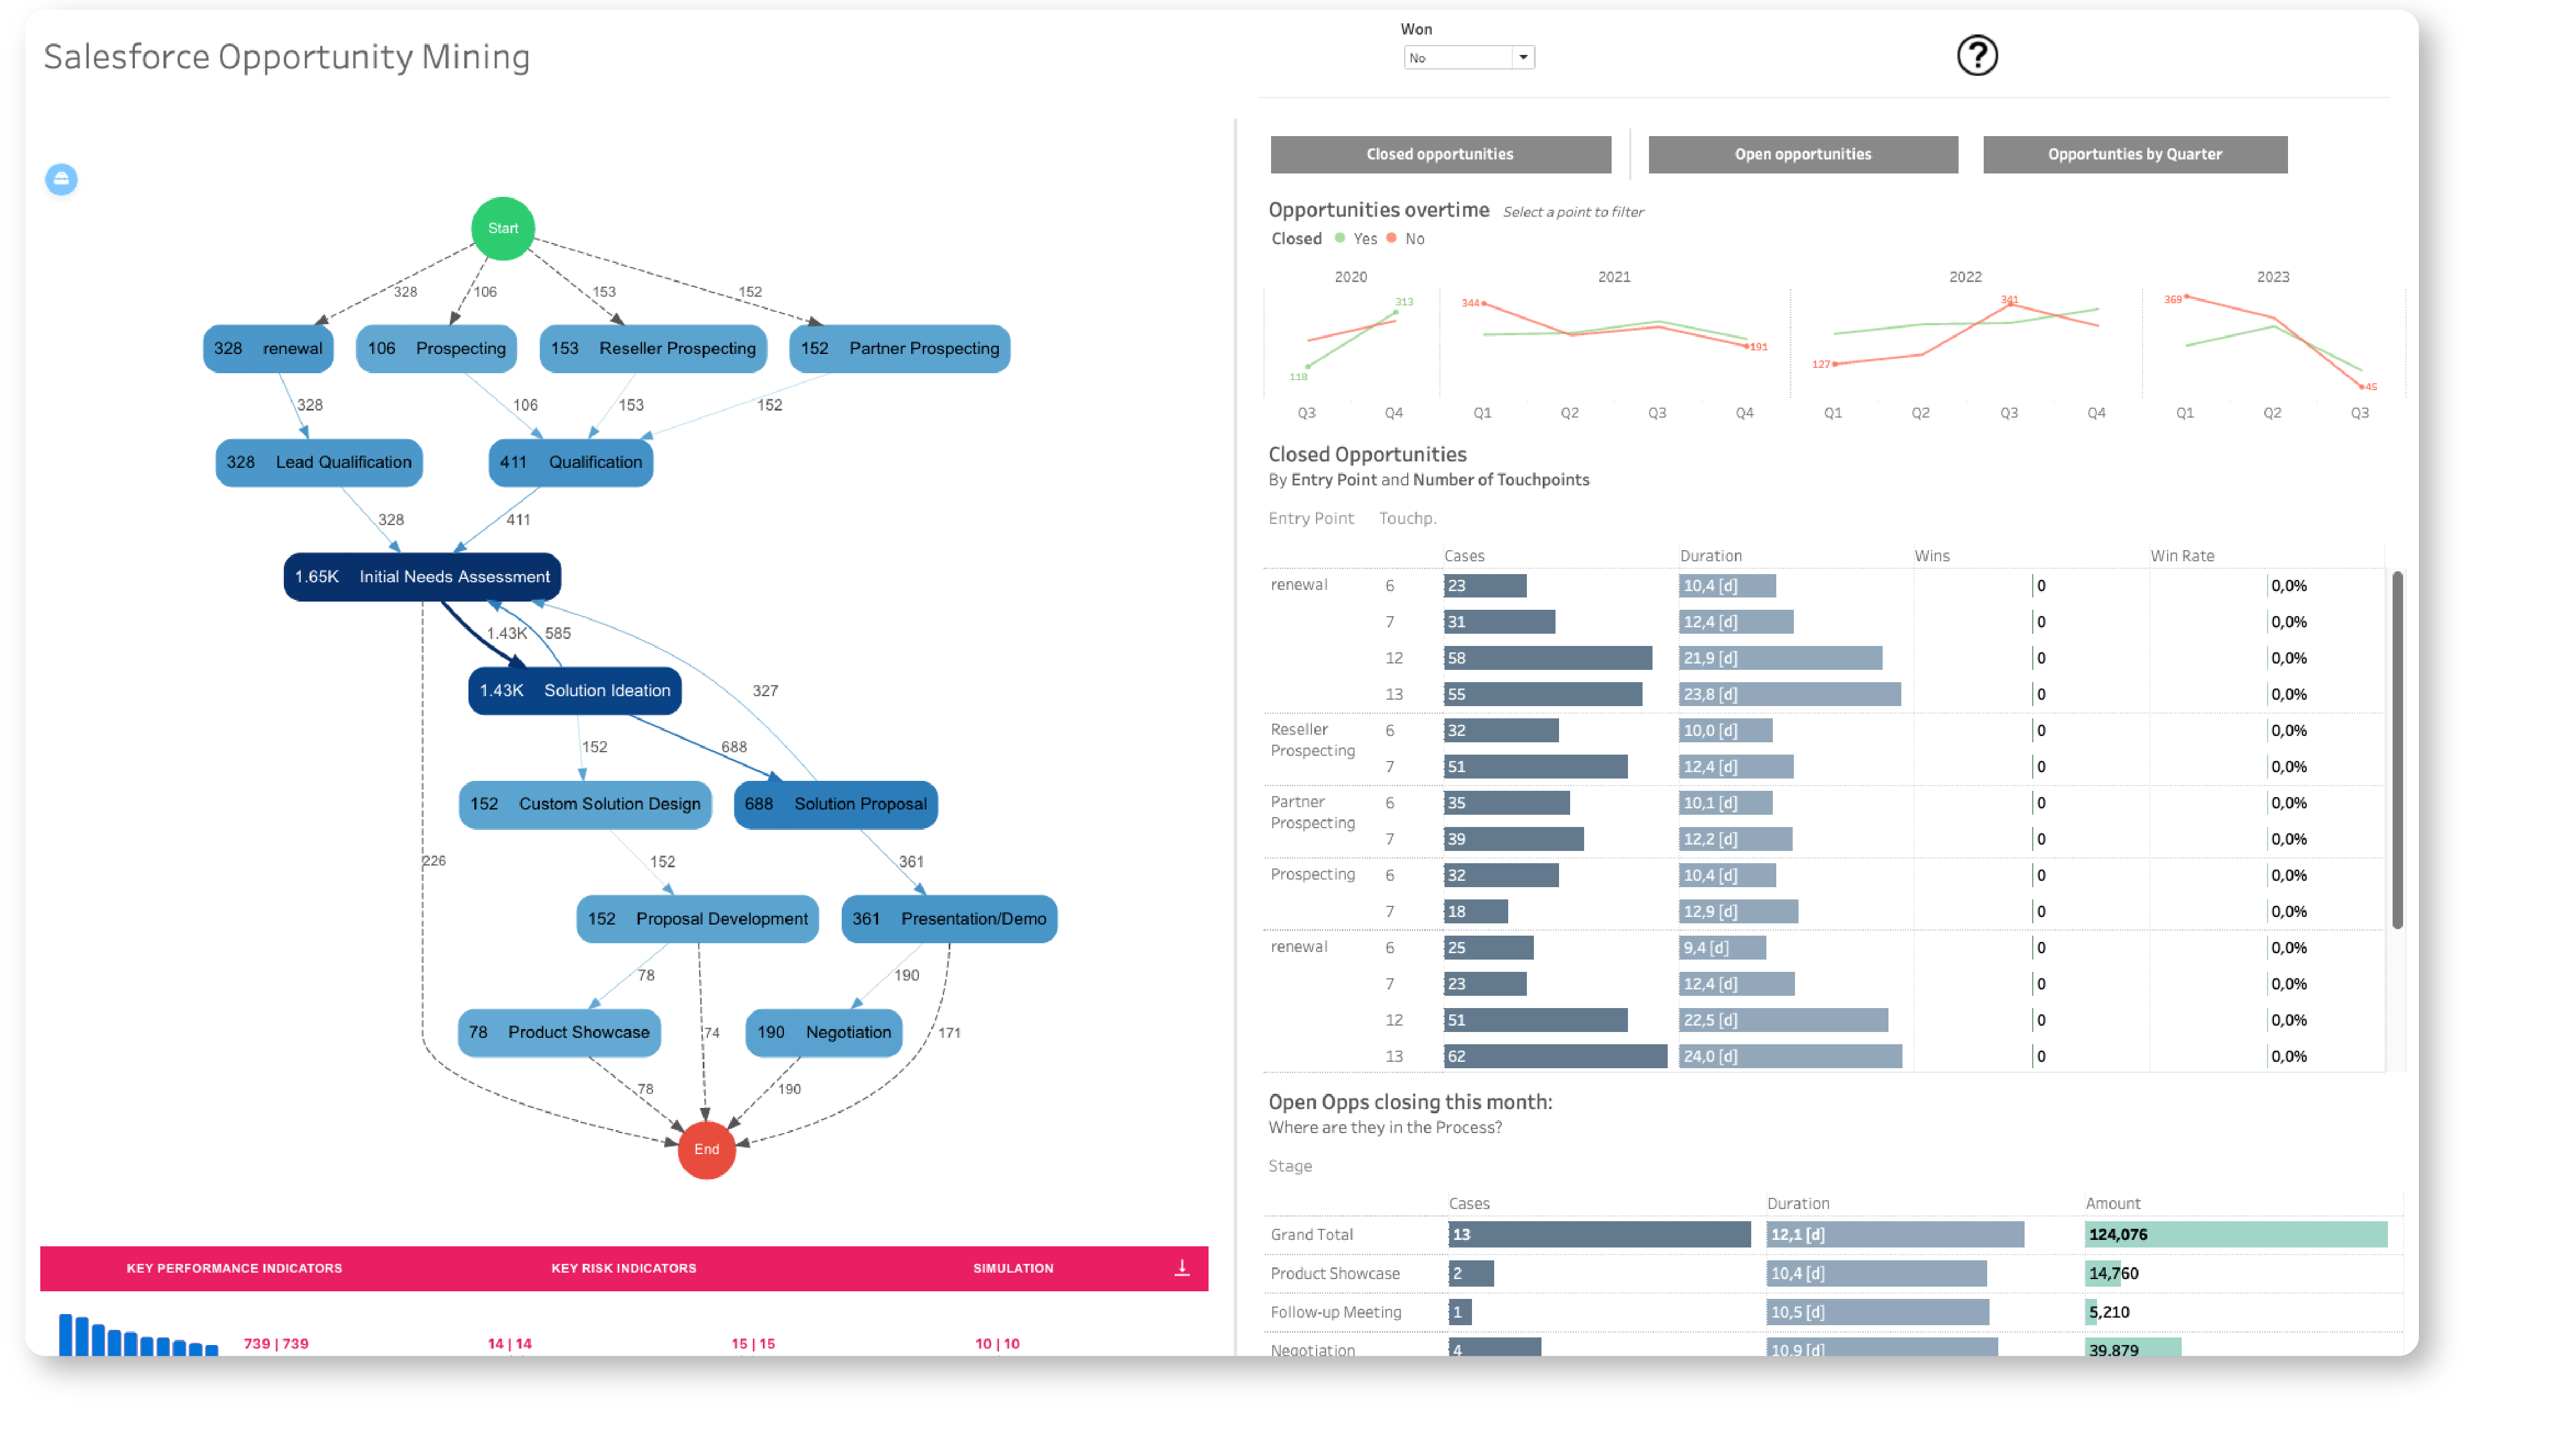
This Solution, empowered with the ProcessMining extension in Tableau, enables you to analyze Salesforce data and gain insights into opportunity conversion, identify bottlenecks, and improve process efficiency. This dashboard includes four visualizations: a process mining view of the entire opportunity flow, a chart showing opportunity transactions over time, a breakdown of closed opportunities by entry point and the number of touchpoints, and a view of activities and their stages in the current month. This dashboard tracks and analyzes opportunities, identifies bottlenecks, and understands the conversion process.
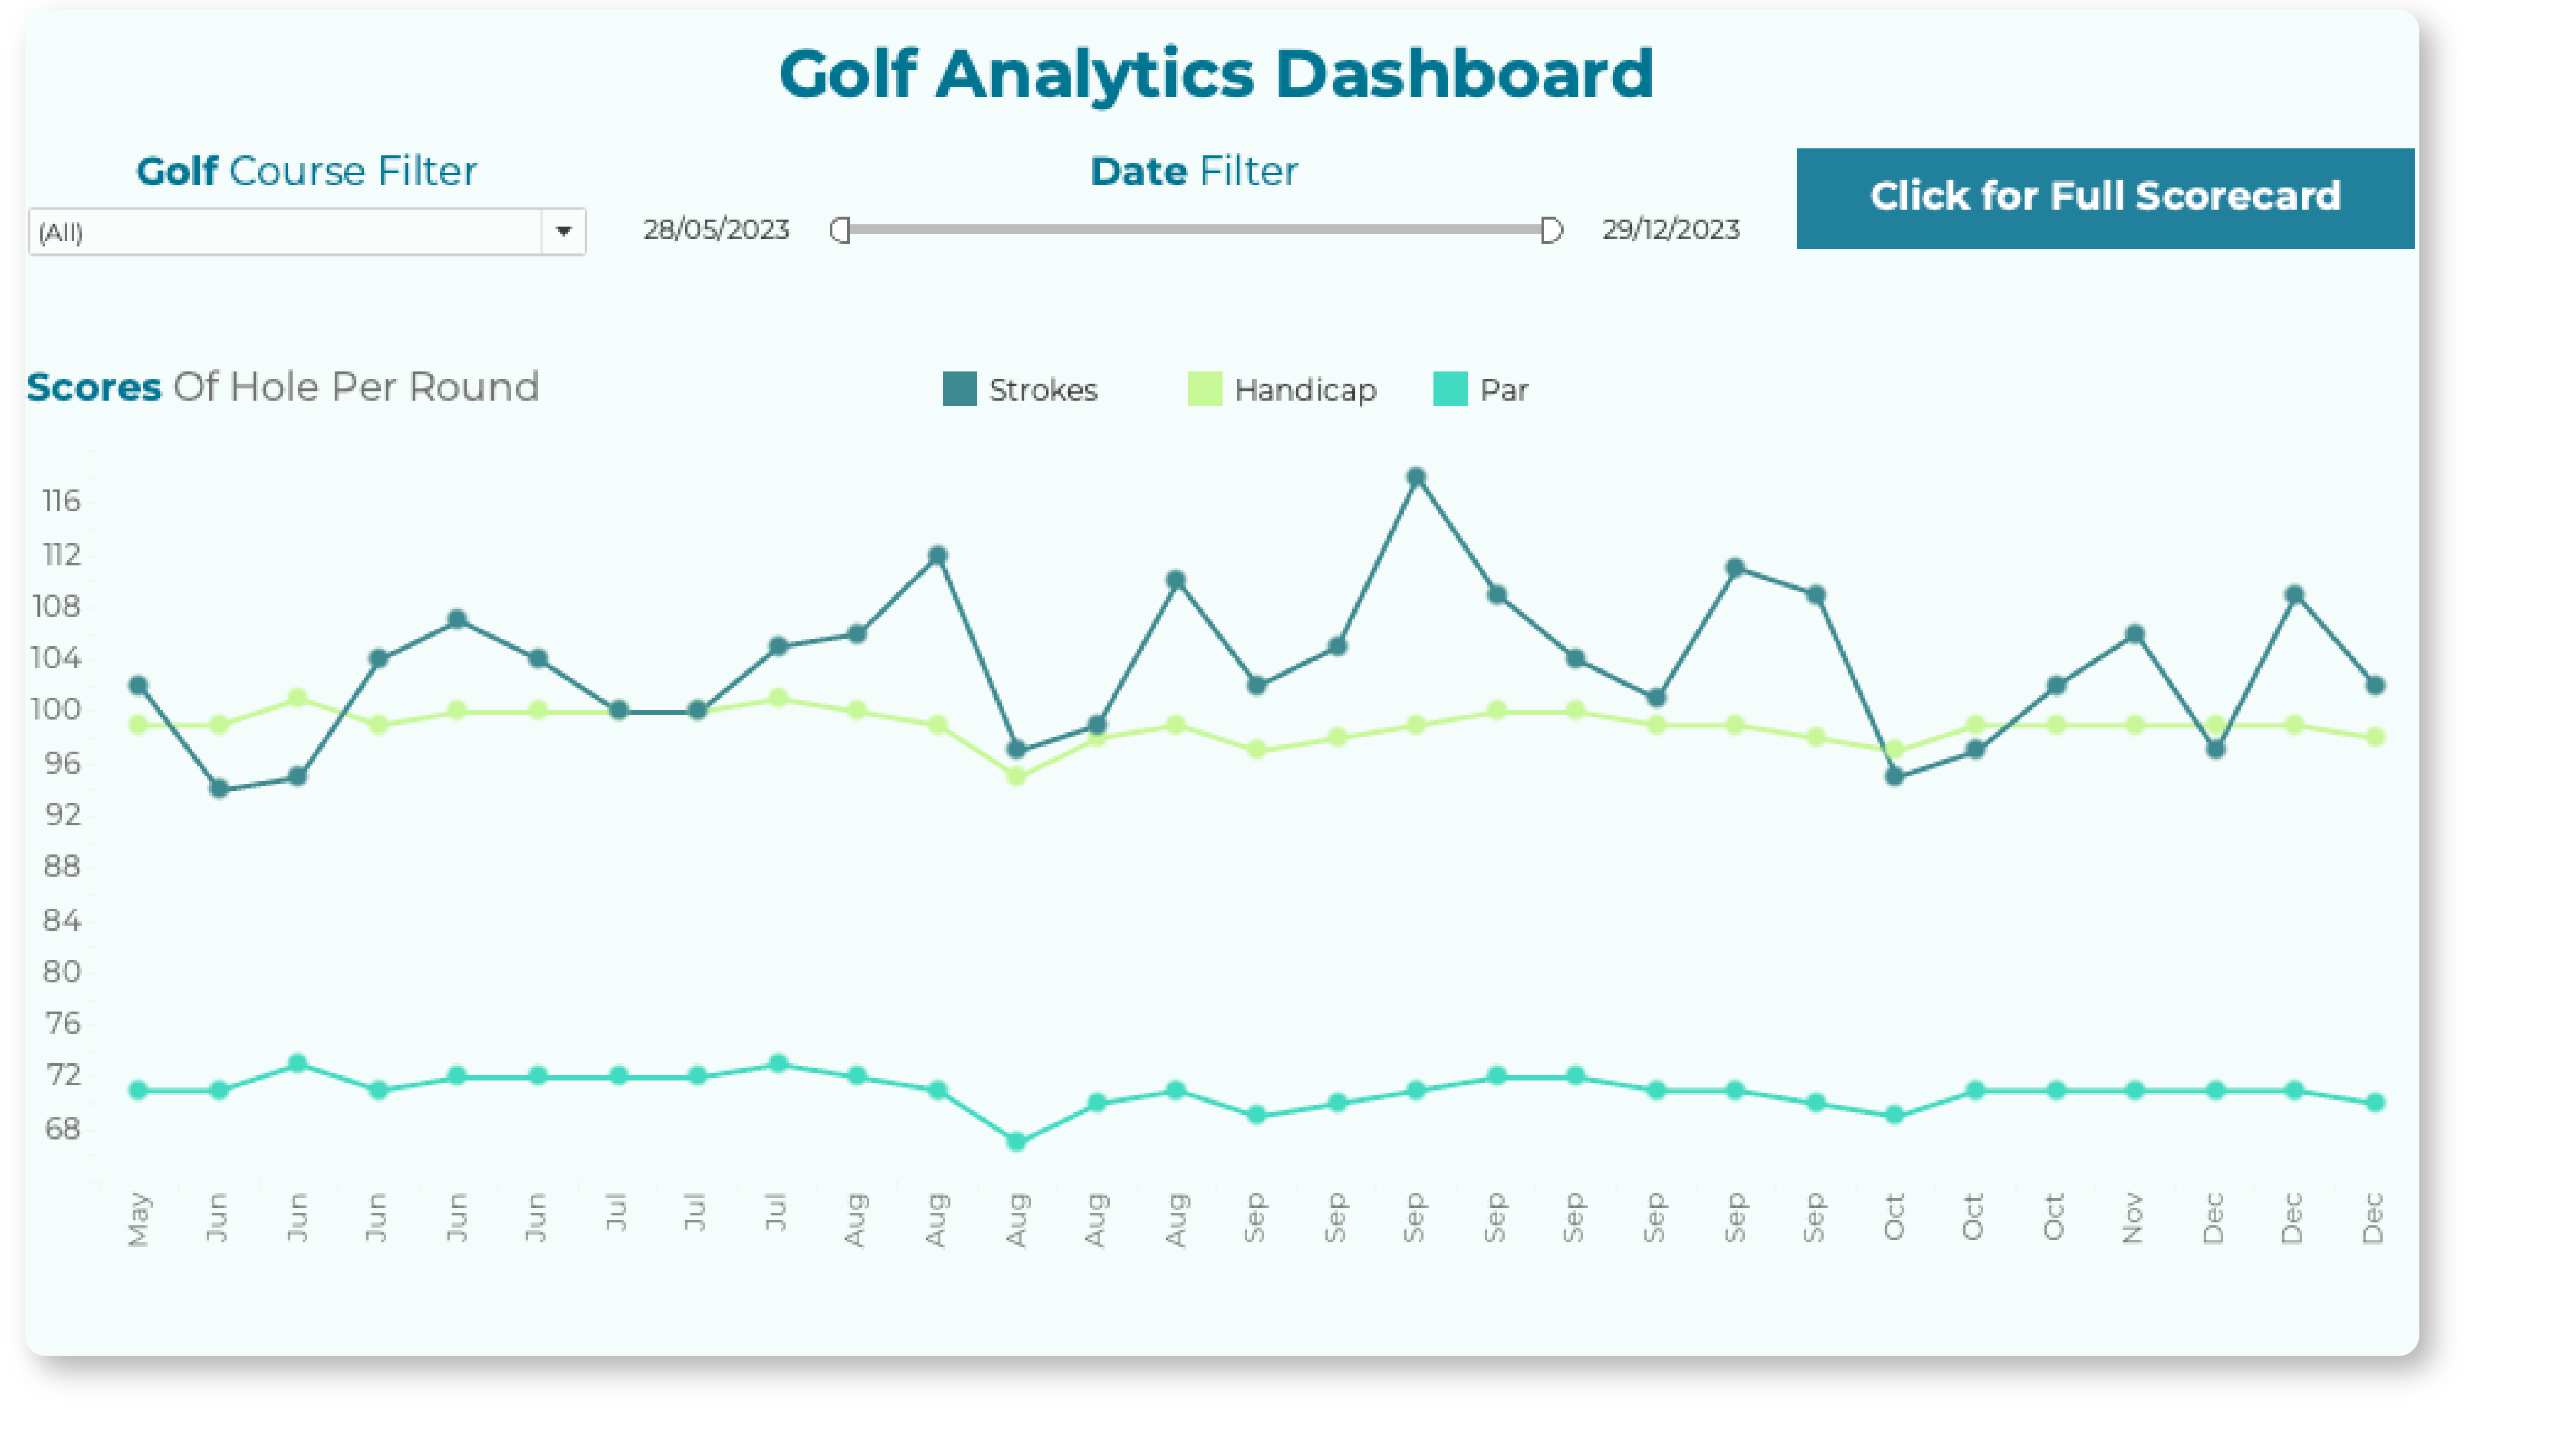
All golfers seek ways to improve their game, whether it be a new set of golf clubs, lessons from a club pro or playing as often as they can. With this dashboard, users can use Tableau to check if their game improvements are making a difference. The highlight of the dashboard is Apps for Tableau’s Sunburst Diagram showing what scores they got on each par, giving great insight in to which par they need to improve in.
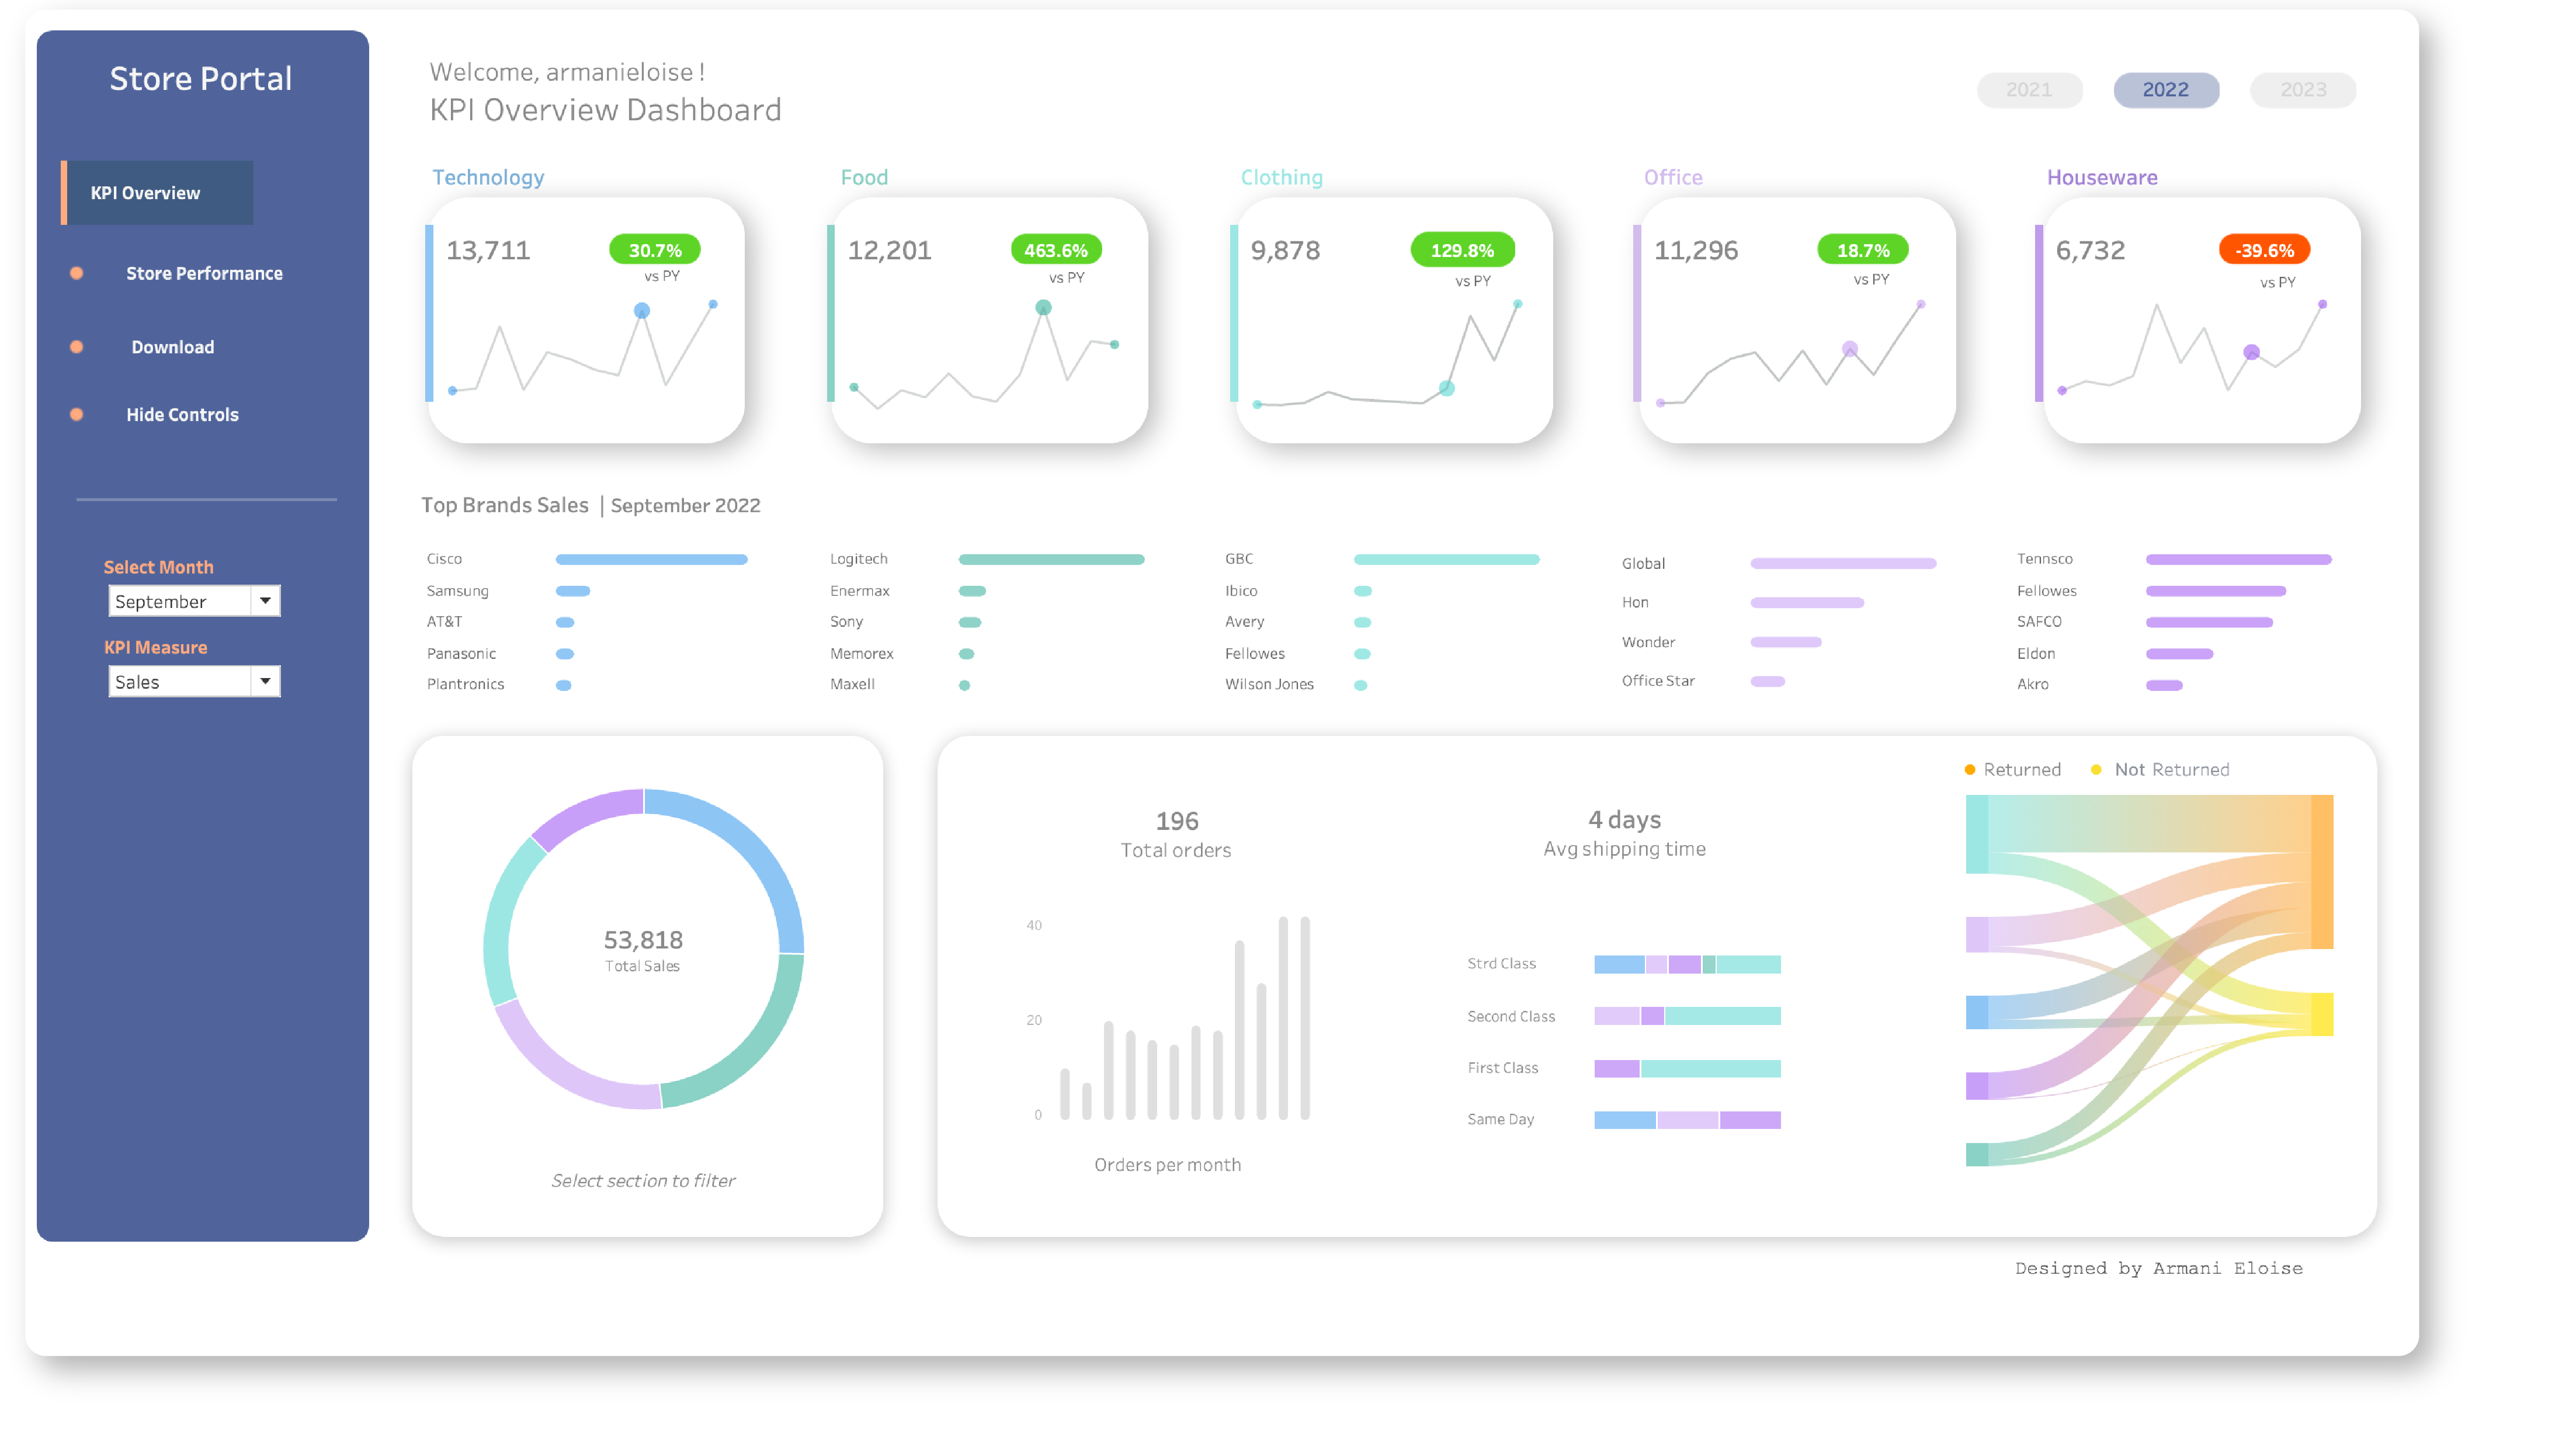
Elevate your business insights with our Retail Store Performance Dashboard, a powerful solution that effortlessly tracks year-over-year performance across departments. Instantly toggle between years and gain a quick overview of top brands. The customizable Showmemore extension offers a comprehensive view of returns and non-returns. With sleek parameter selections, effortlessly switch between sales and profit views. Accessible through a user-friendly portal interface, this versatile solution adds precision and style to your retail analytics, unlocking deeper insights and maximising your retail success.

Unlock the world of global game sales with our ShowMeMore Tableau dashboard! Dive into North America, Japan, and Europe's gaming trends using a radar chart and supertable for a quick, insightful adventure. Elevate your understanding of sales distribution and genre dynamics.
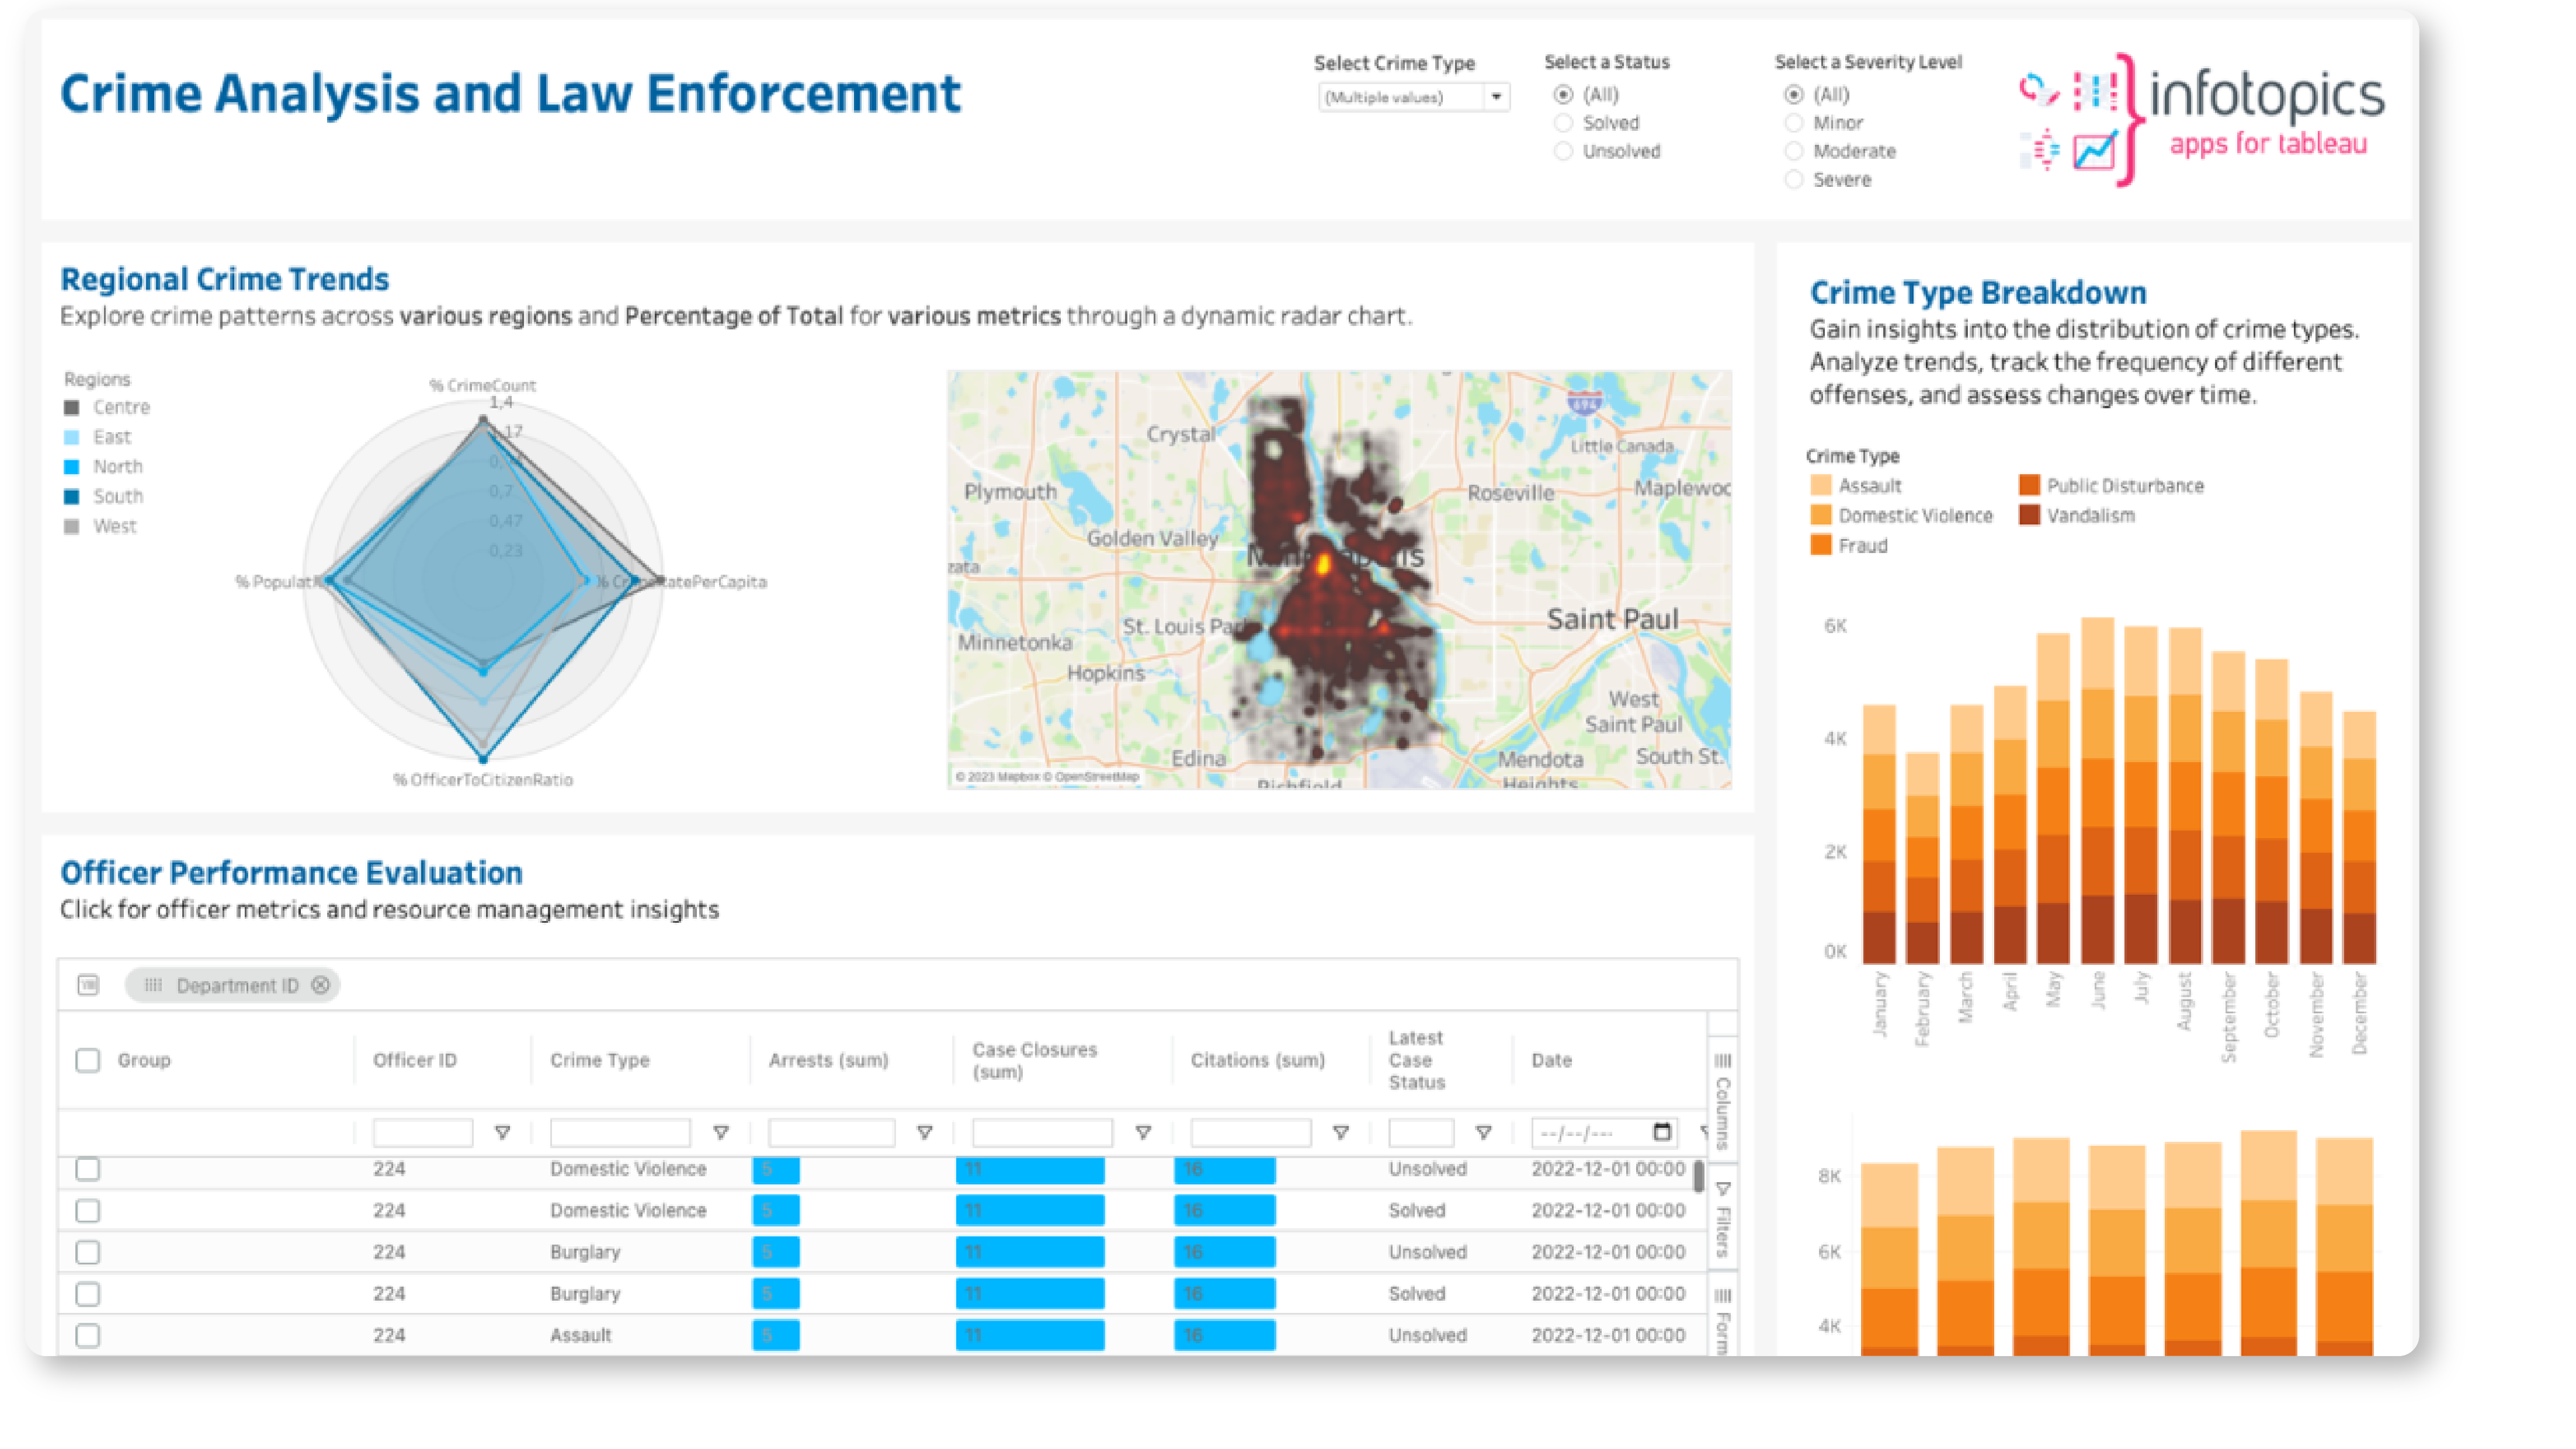
Empower your law enforcement agency with this Crime Analysis Dashboard, a robust solution designed to revolutionise crime management, optimize resource allocation, and enhance community safety. Delve into intricate crime patterns across regions using dynamic radar chart and interactive maps for proactive policing. The Stacked Bar Charts unveil crime type distribution, aiding in trend analysis for informed decision-making. With SuperTables Tableau extension, evaluate officer performance with granular detail, allowing tailored column order, grouping, and customised bar charts for optimised resource allocation. Interactive features promote community engagement, enhance resource deployment efficiency, reduce response times, and foster transparency, trust, and collaboration for safer neighborhoods.
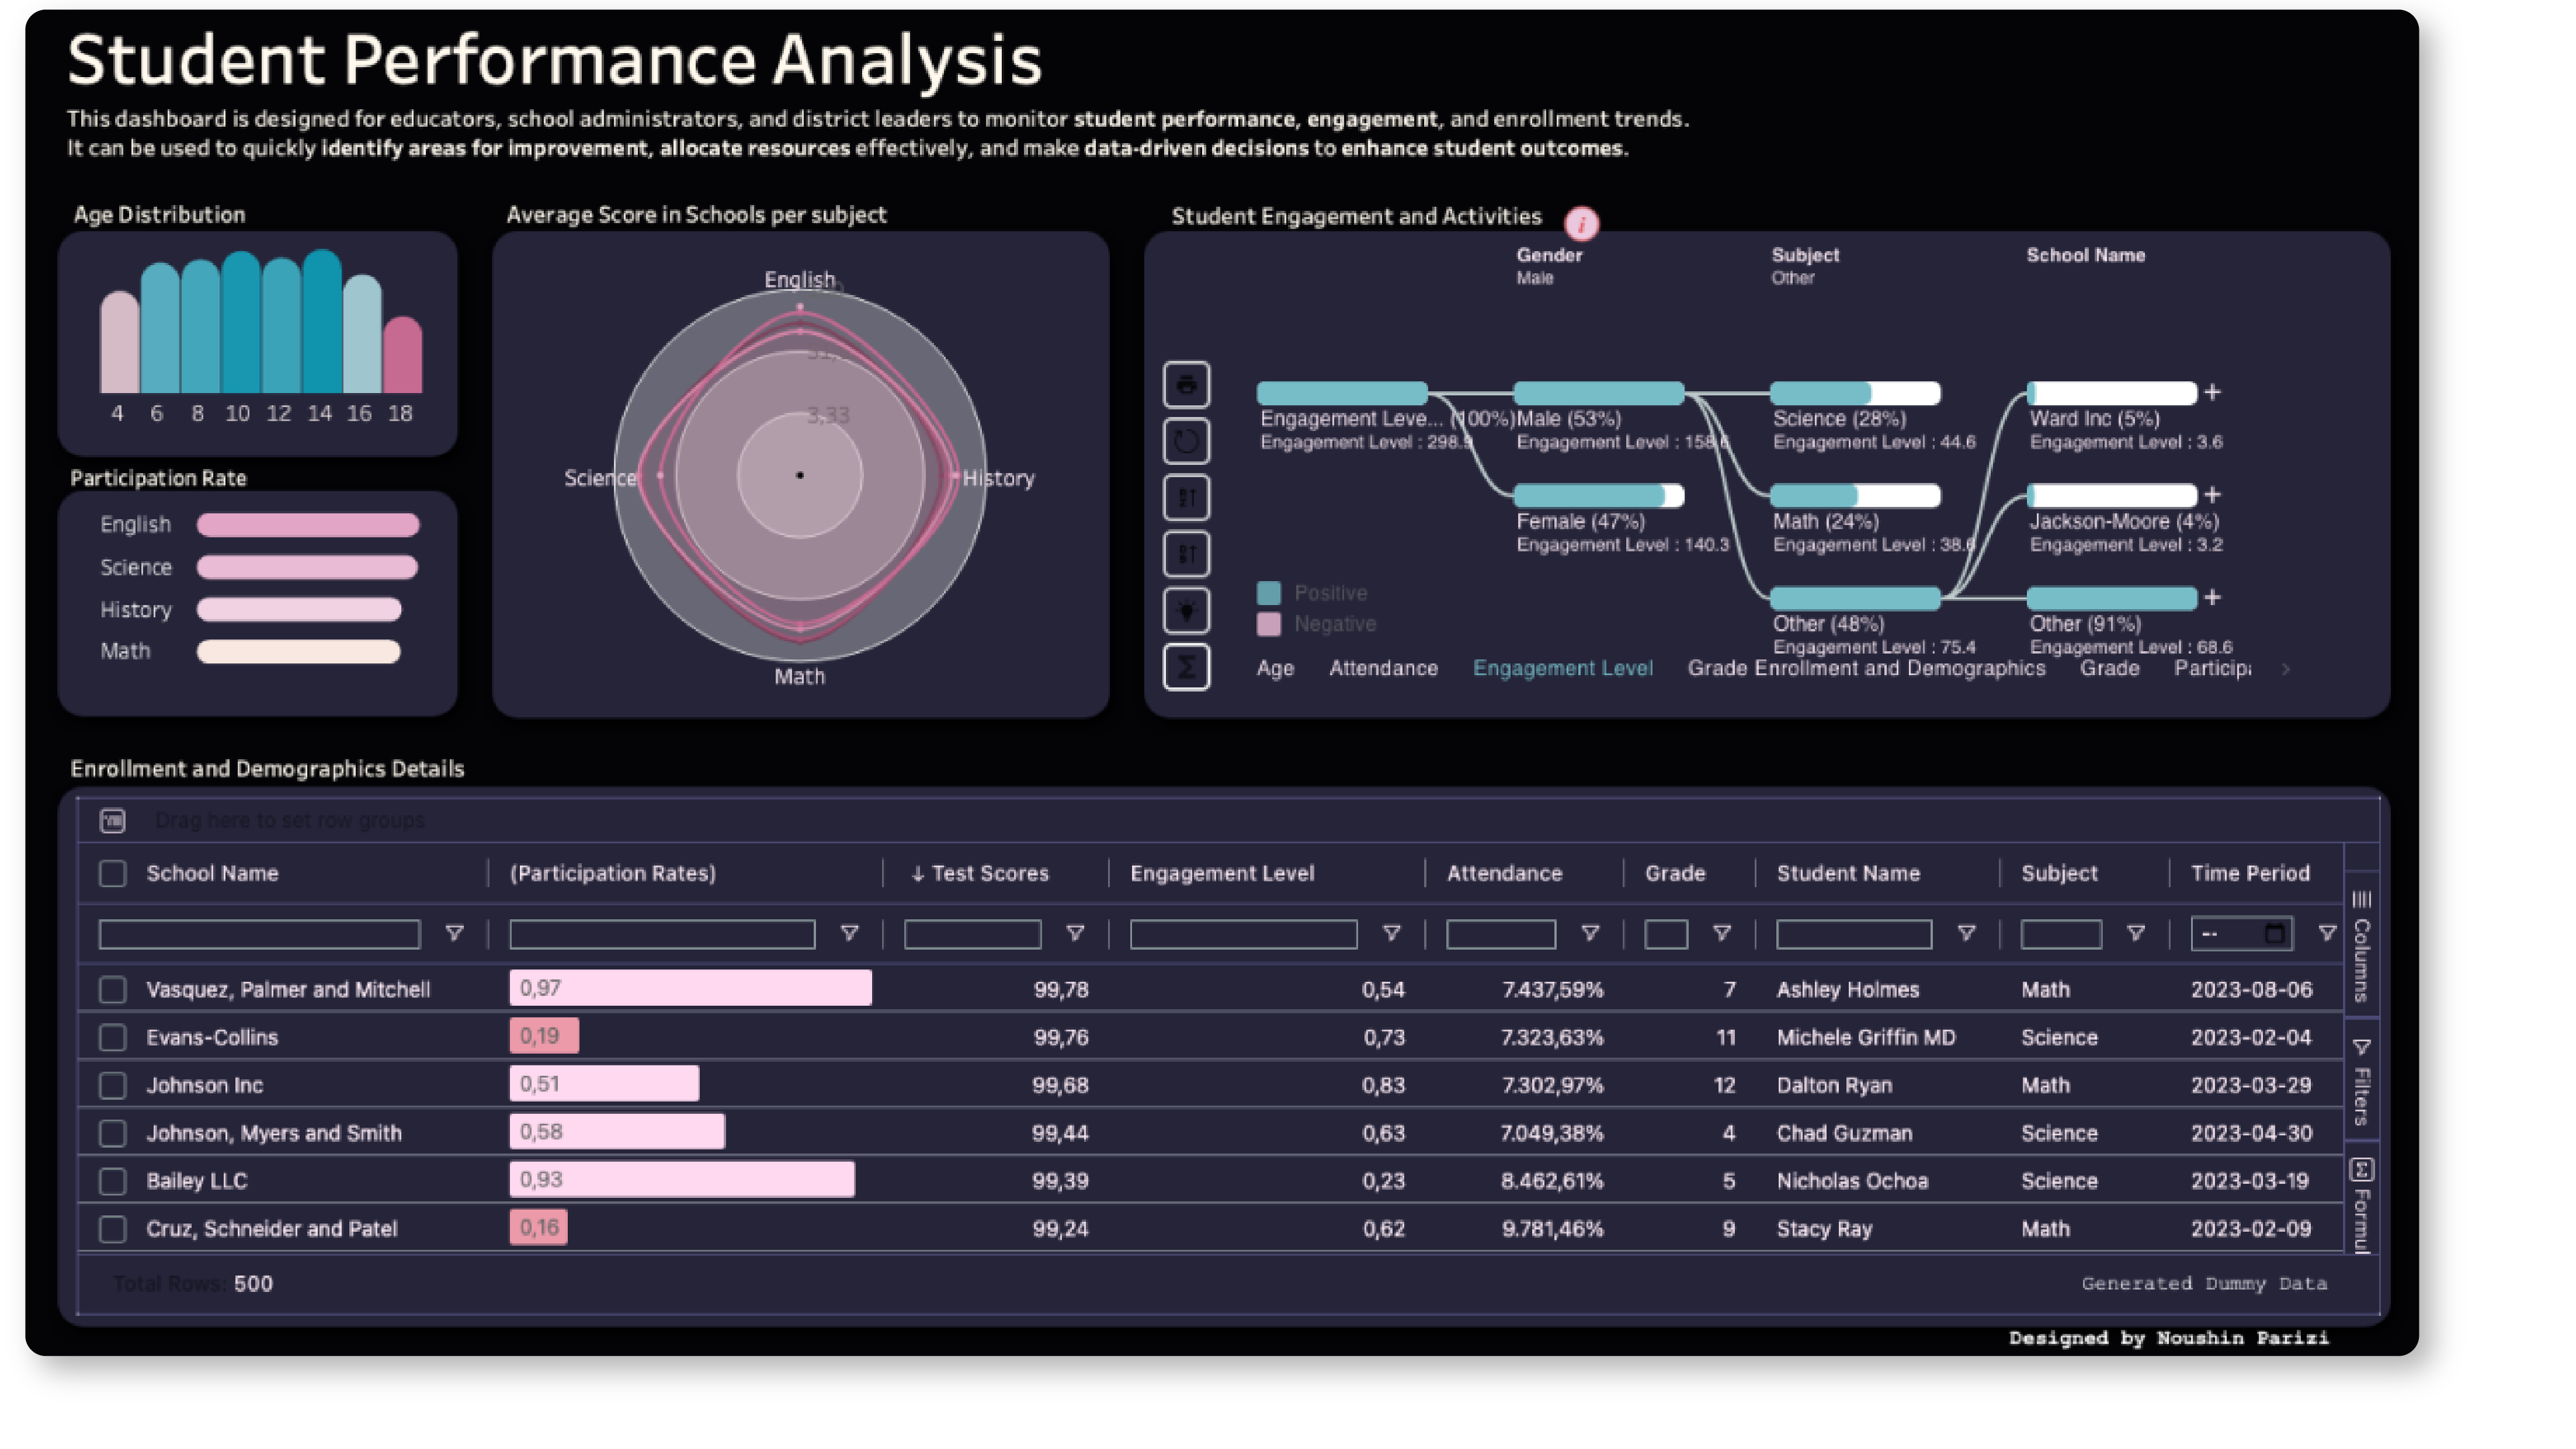
Discover the power of insights with our interactive dashboard! Designed for educators and school leaders, this solution helps you visualise key trends in student engagement, participation, and scores across subjects. Easily spot areas for improvement and make data-driven decisions to boost student outcomes. Download now and see how it can elevate your education strategy.
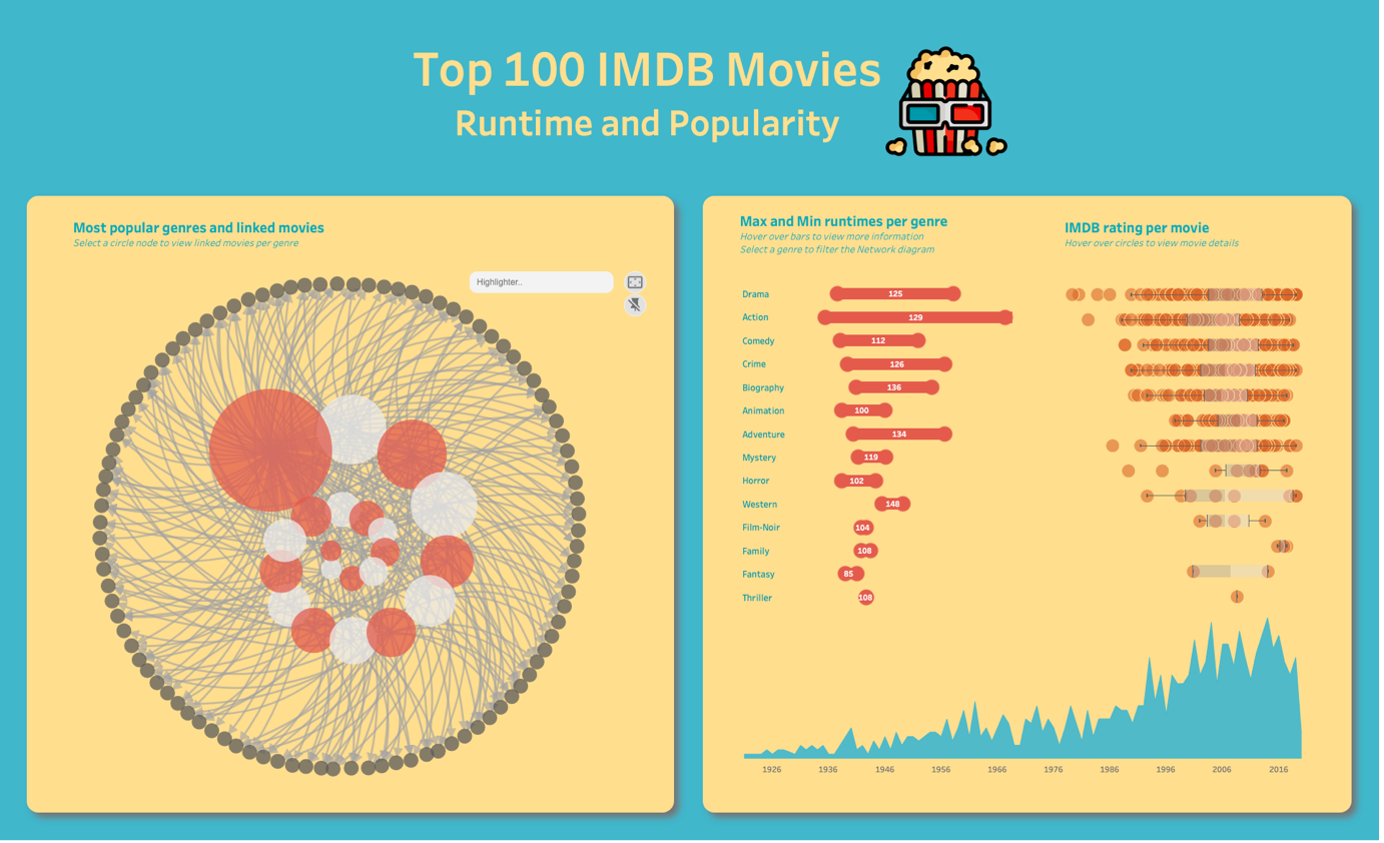
Dive into the world of movies with our dynamic dashboard. The ShowMeMore network chart connects each movie to its genres, with genres serving as central nodes, dynamically adjusting in size based on the number of associated movies. On the right, explore the runtime distribution per genre, ranging from minimum to maximum, and average ratings. let the fun begin as you explore and find fun facts about your beloved movies and genres!

This solution for financial statements offers dynamic dashboards for real-time monitoring, strategic resource allocation, and scenario modelling. Easily explore “What-If” scenarios, monitor financial health in real-time, and optimize resource allocation game-changing capabilities in SuperTables. Use the ShowMeMore Waterfall Chart to model various financial scenarios, from cost reductions to market expansions, making informed choices. Uncover opportunities and address risks with this solution.
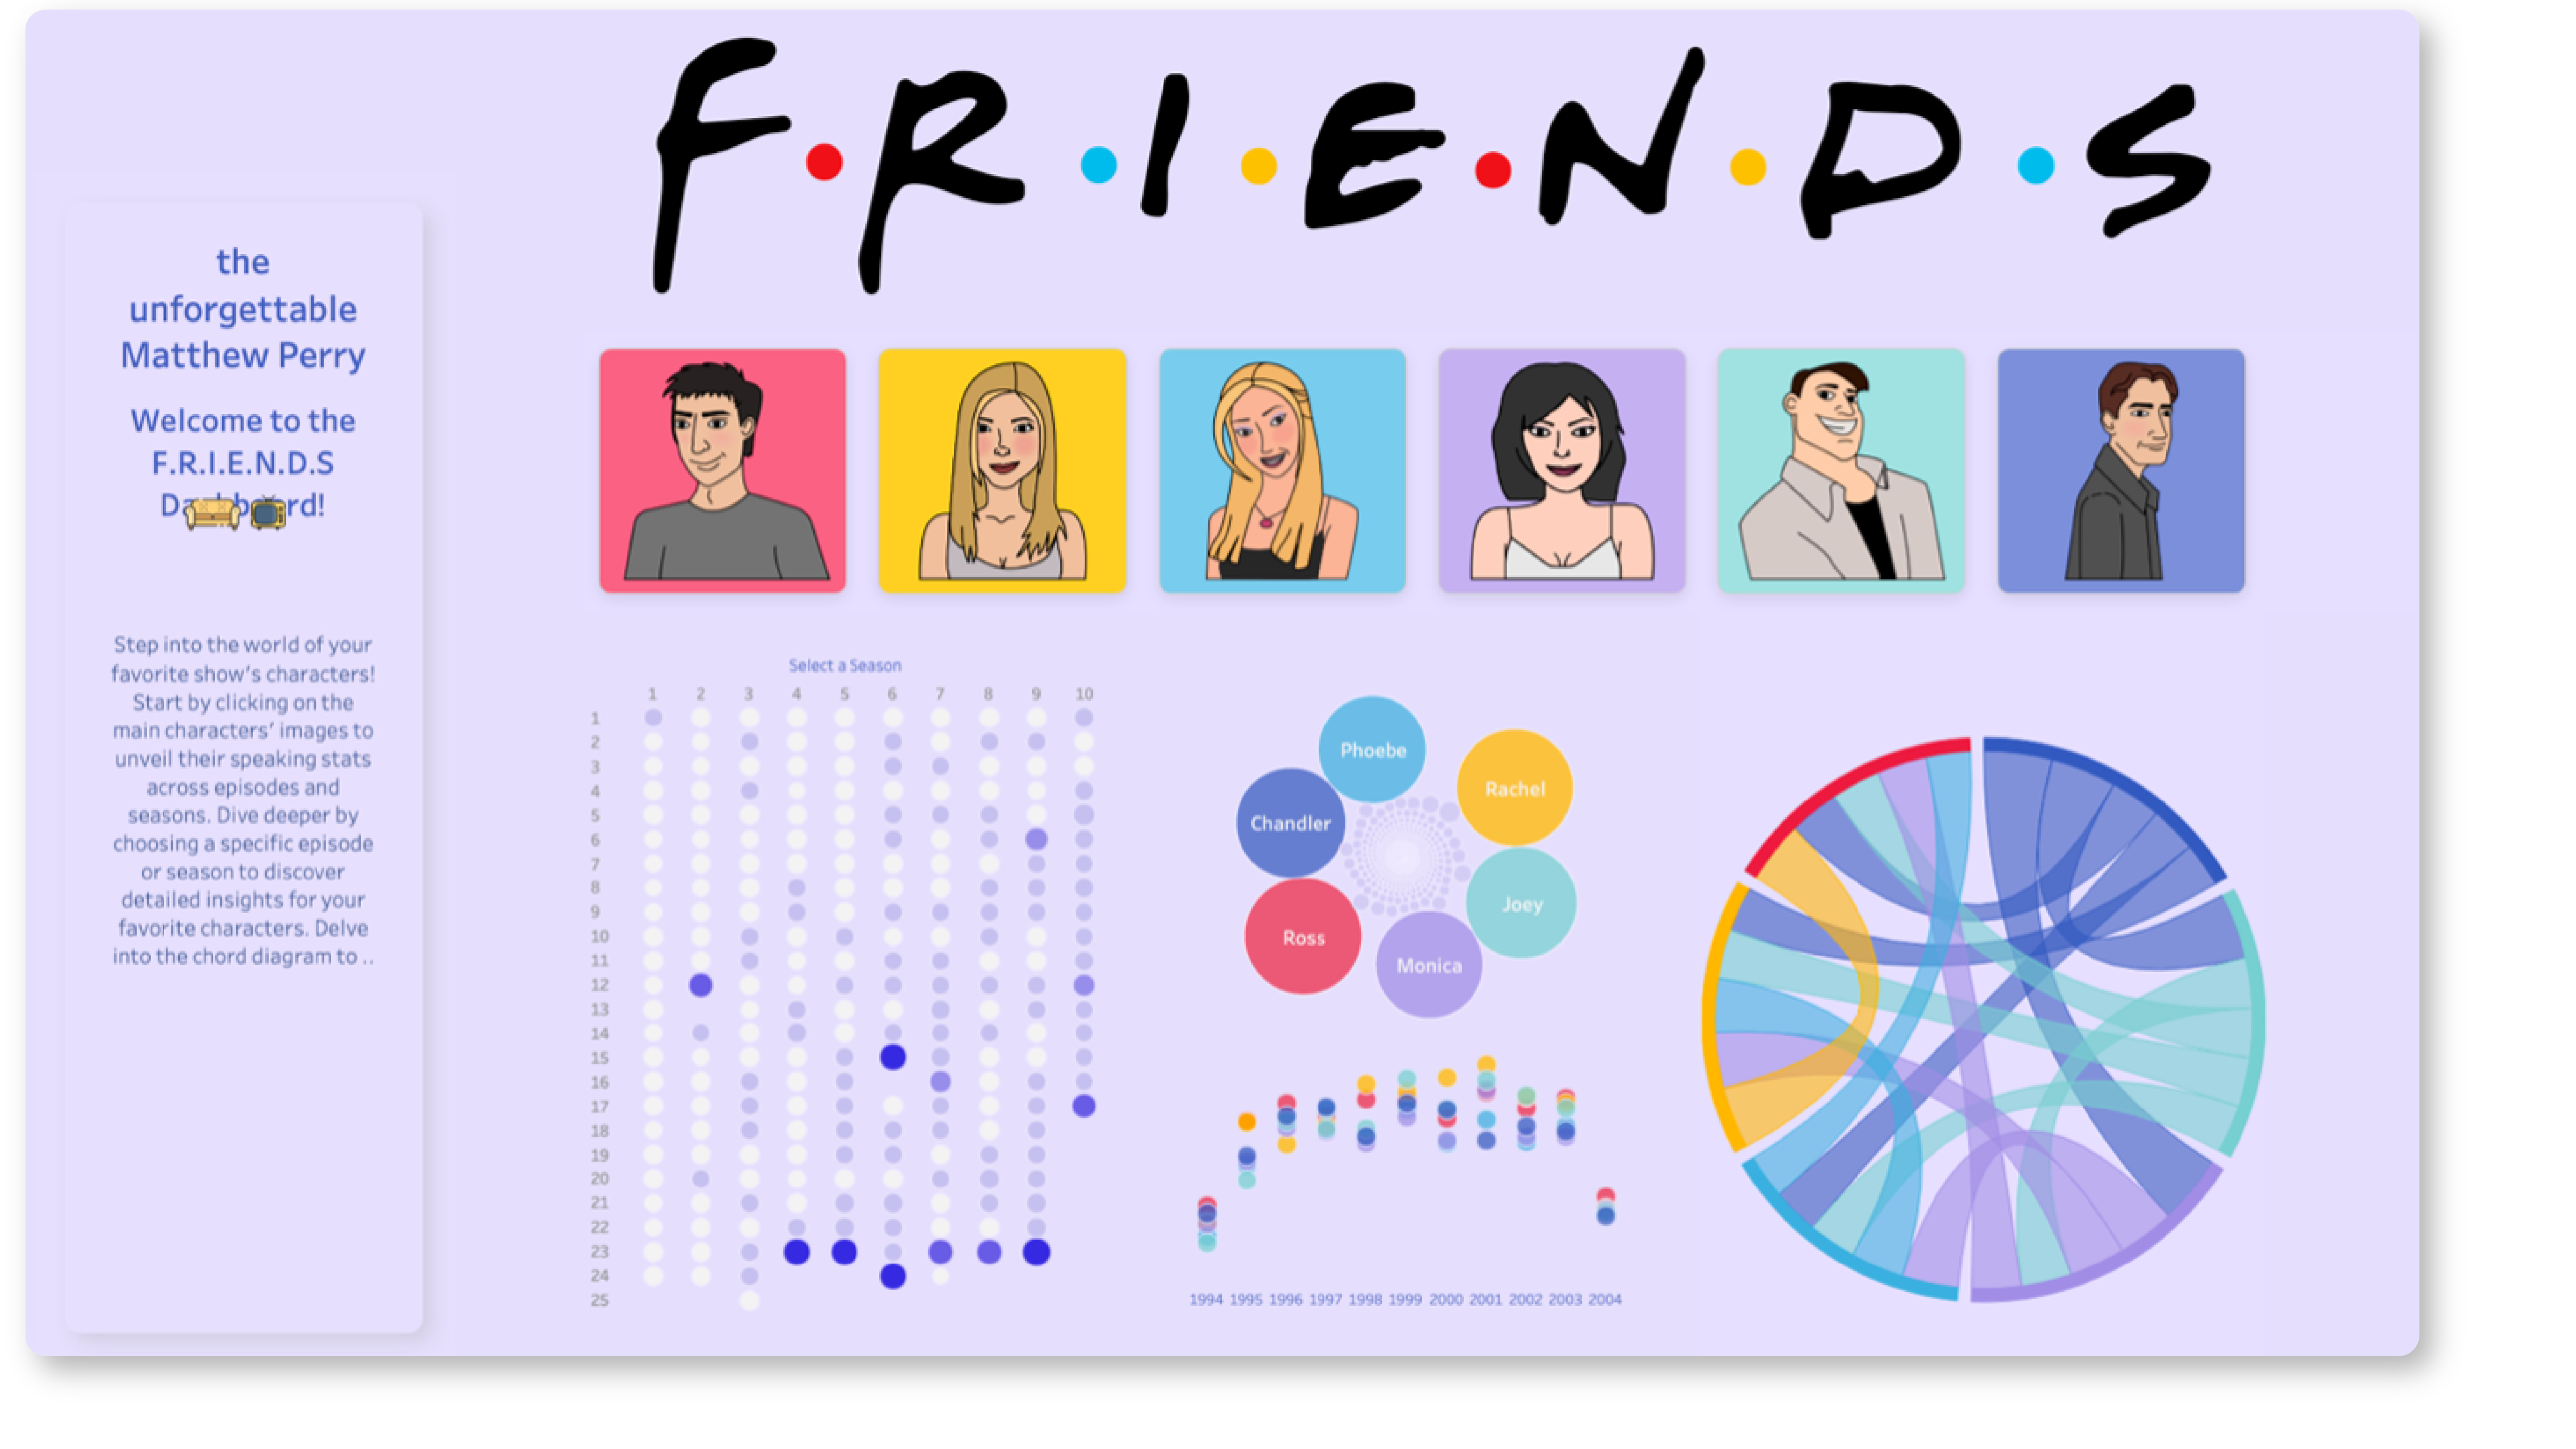
In tribute to the Unforgerrable Matthew Perry, welcome to the F.R.I.E.N.D.S Dashboard! Explore the F.R.I.E.N.D.S Dashboard for a nostalgic journey, and explore their speaking stats across episodes and seasons. Click on main characters' images to unveil personalized insights. Dive deeper by selecting a specific episode or season, revealing detailed information. Explore the chord diagram to see the frequency of character interactions in the chosen episode. Enjoy the journey with this interactive dashboard.
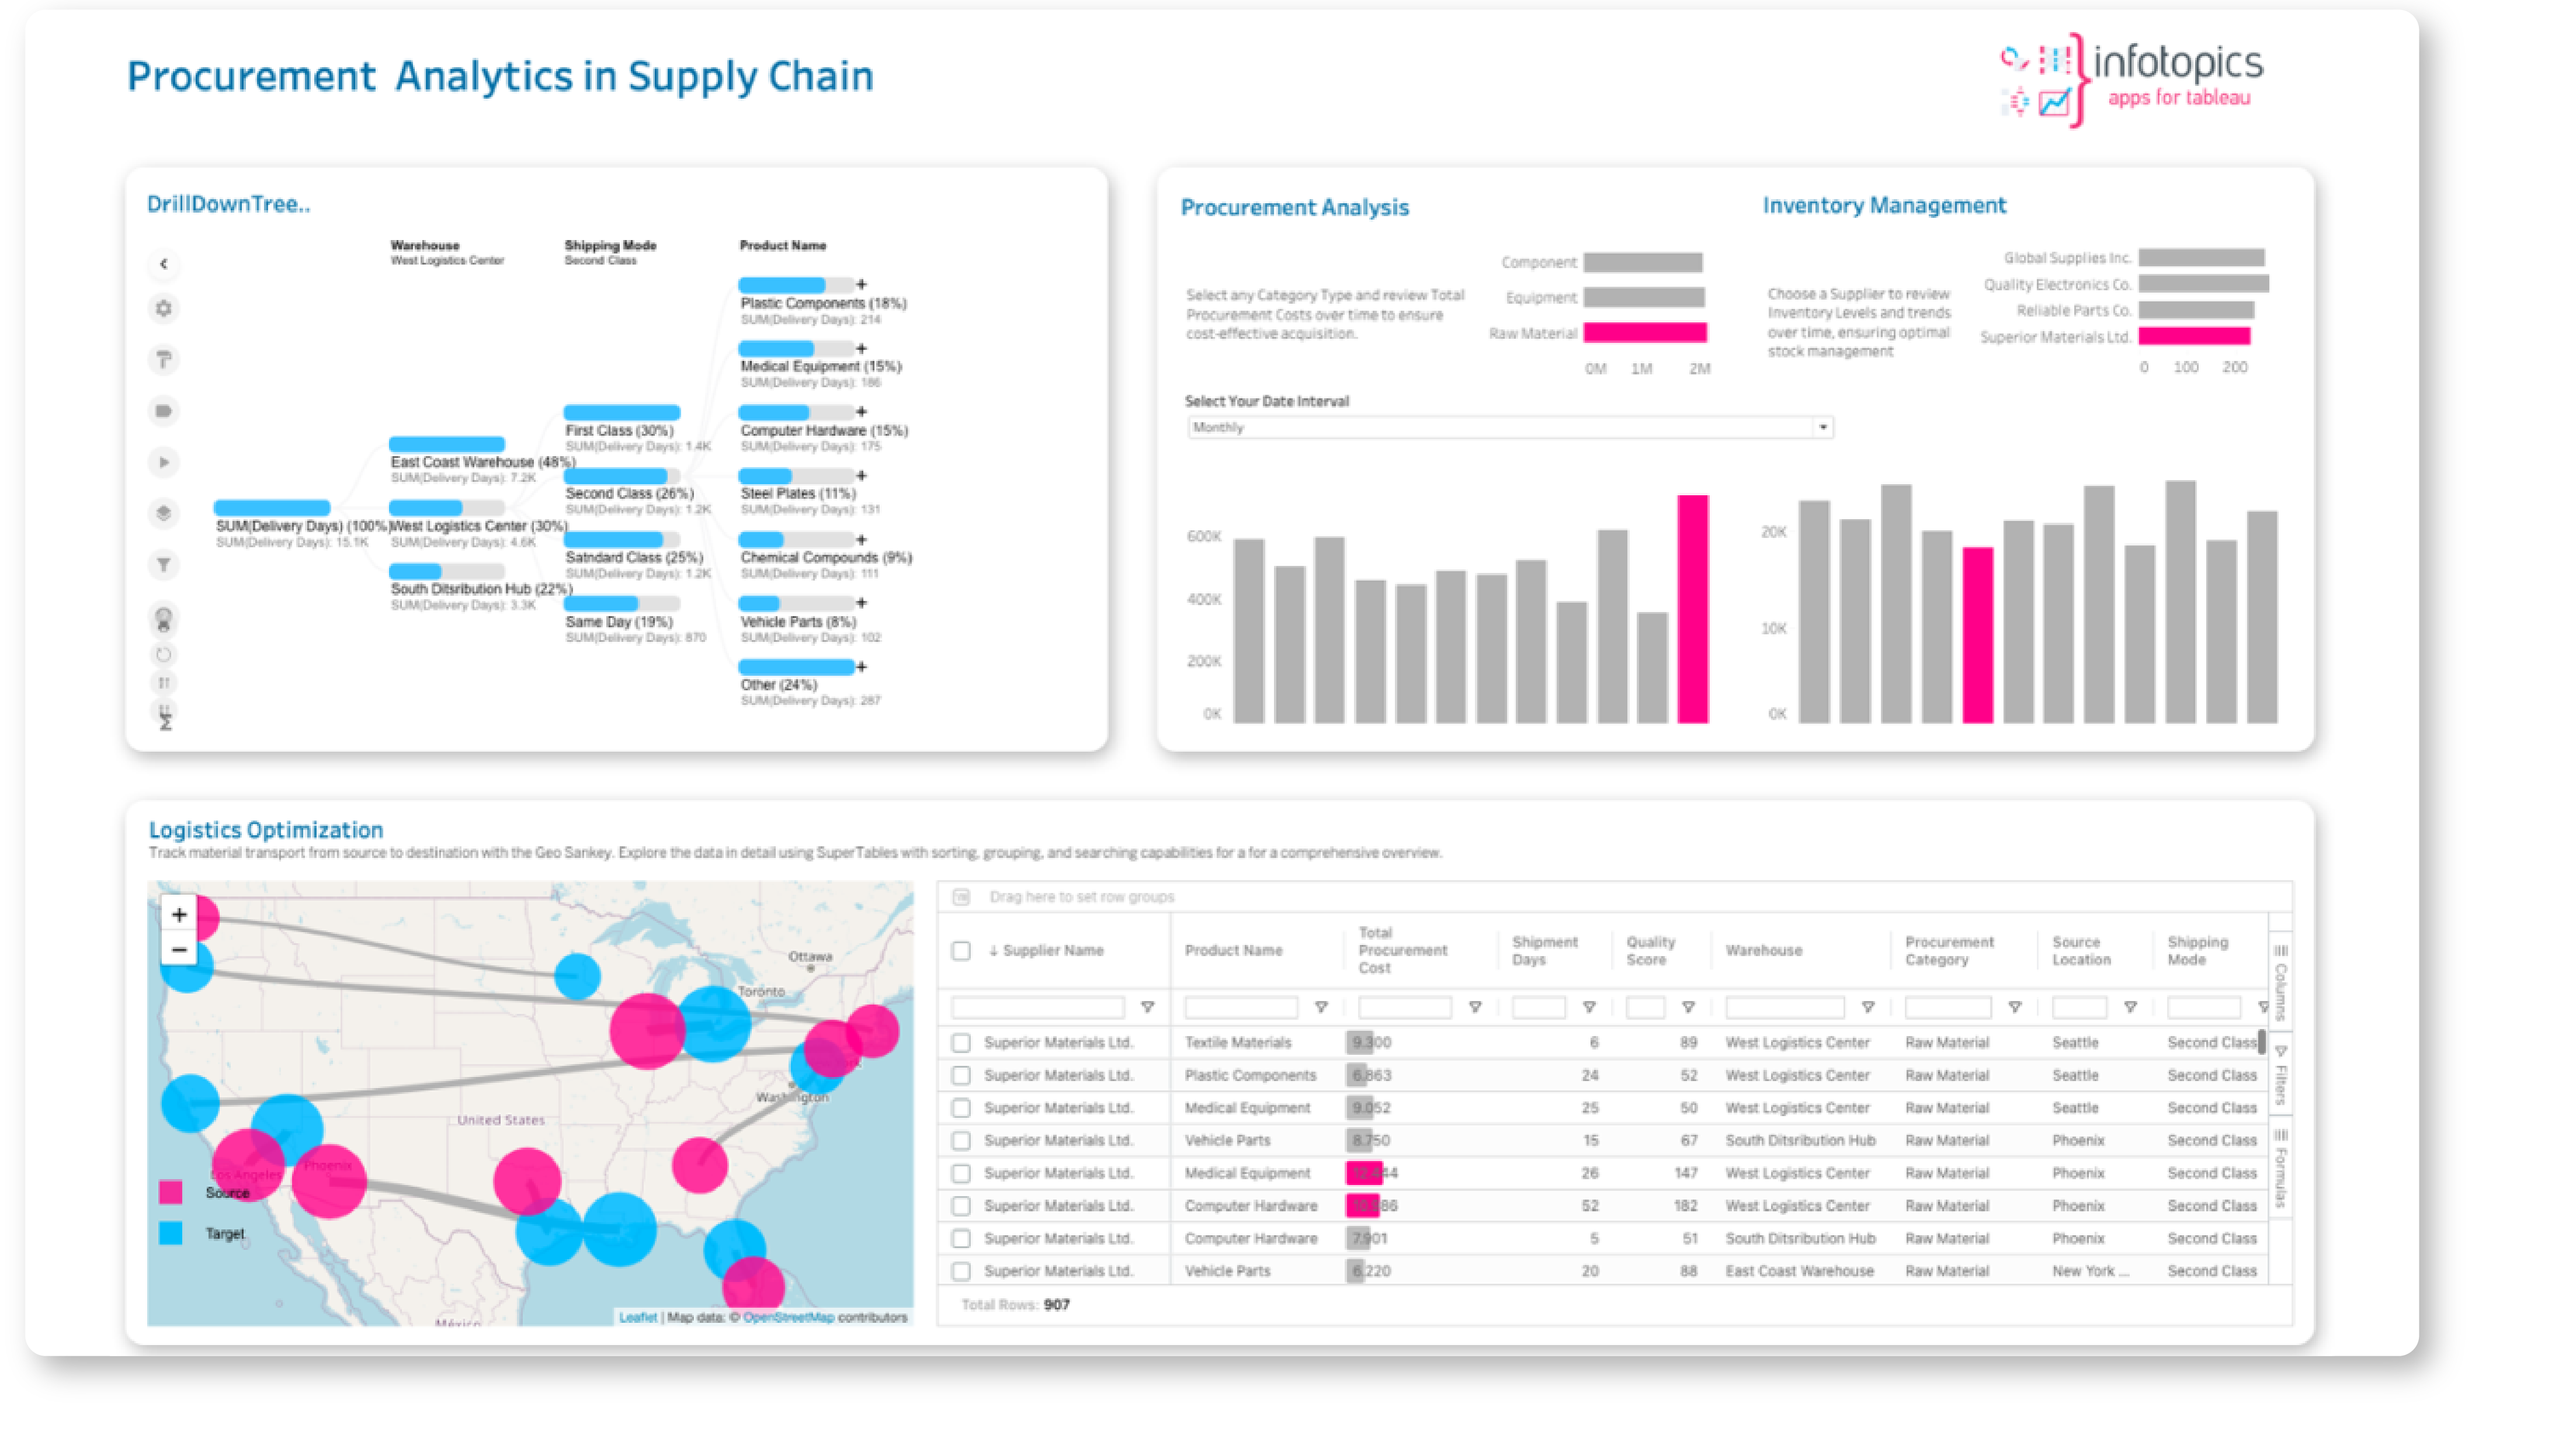
Explore this solution to simplify the complexities of supply chain management. Whether you're in manufacturing or logistics, this dashboard is tailored for you. With an intuitive overview and DrillDownTree, it offers insights into your entire supply chain. The Performance Metrics Dashboard tracks key metrics, and Geo Sankey visualizes material flow for optimized transportation routes. SuperTables at the bottom right create a user-friendly space for easy exploration, streamlined logistics, enhanced category-based performance, and informed decision-making. This dashboard, powered by extensions, adds immense value by providing insights for a seamless supply chain operation.
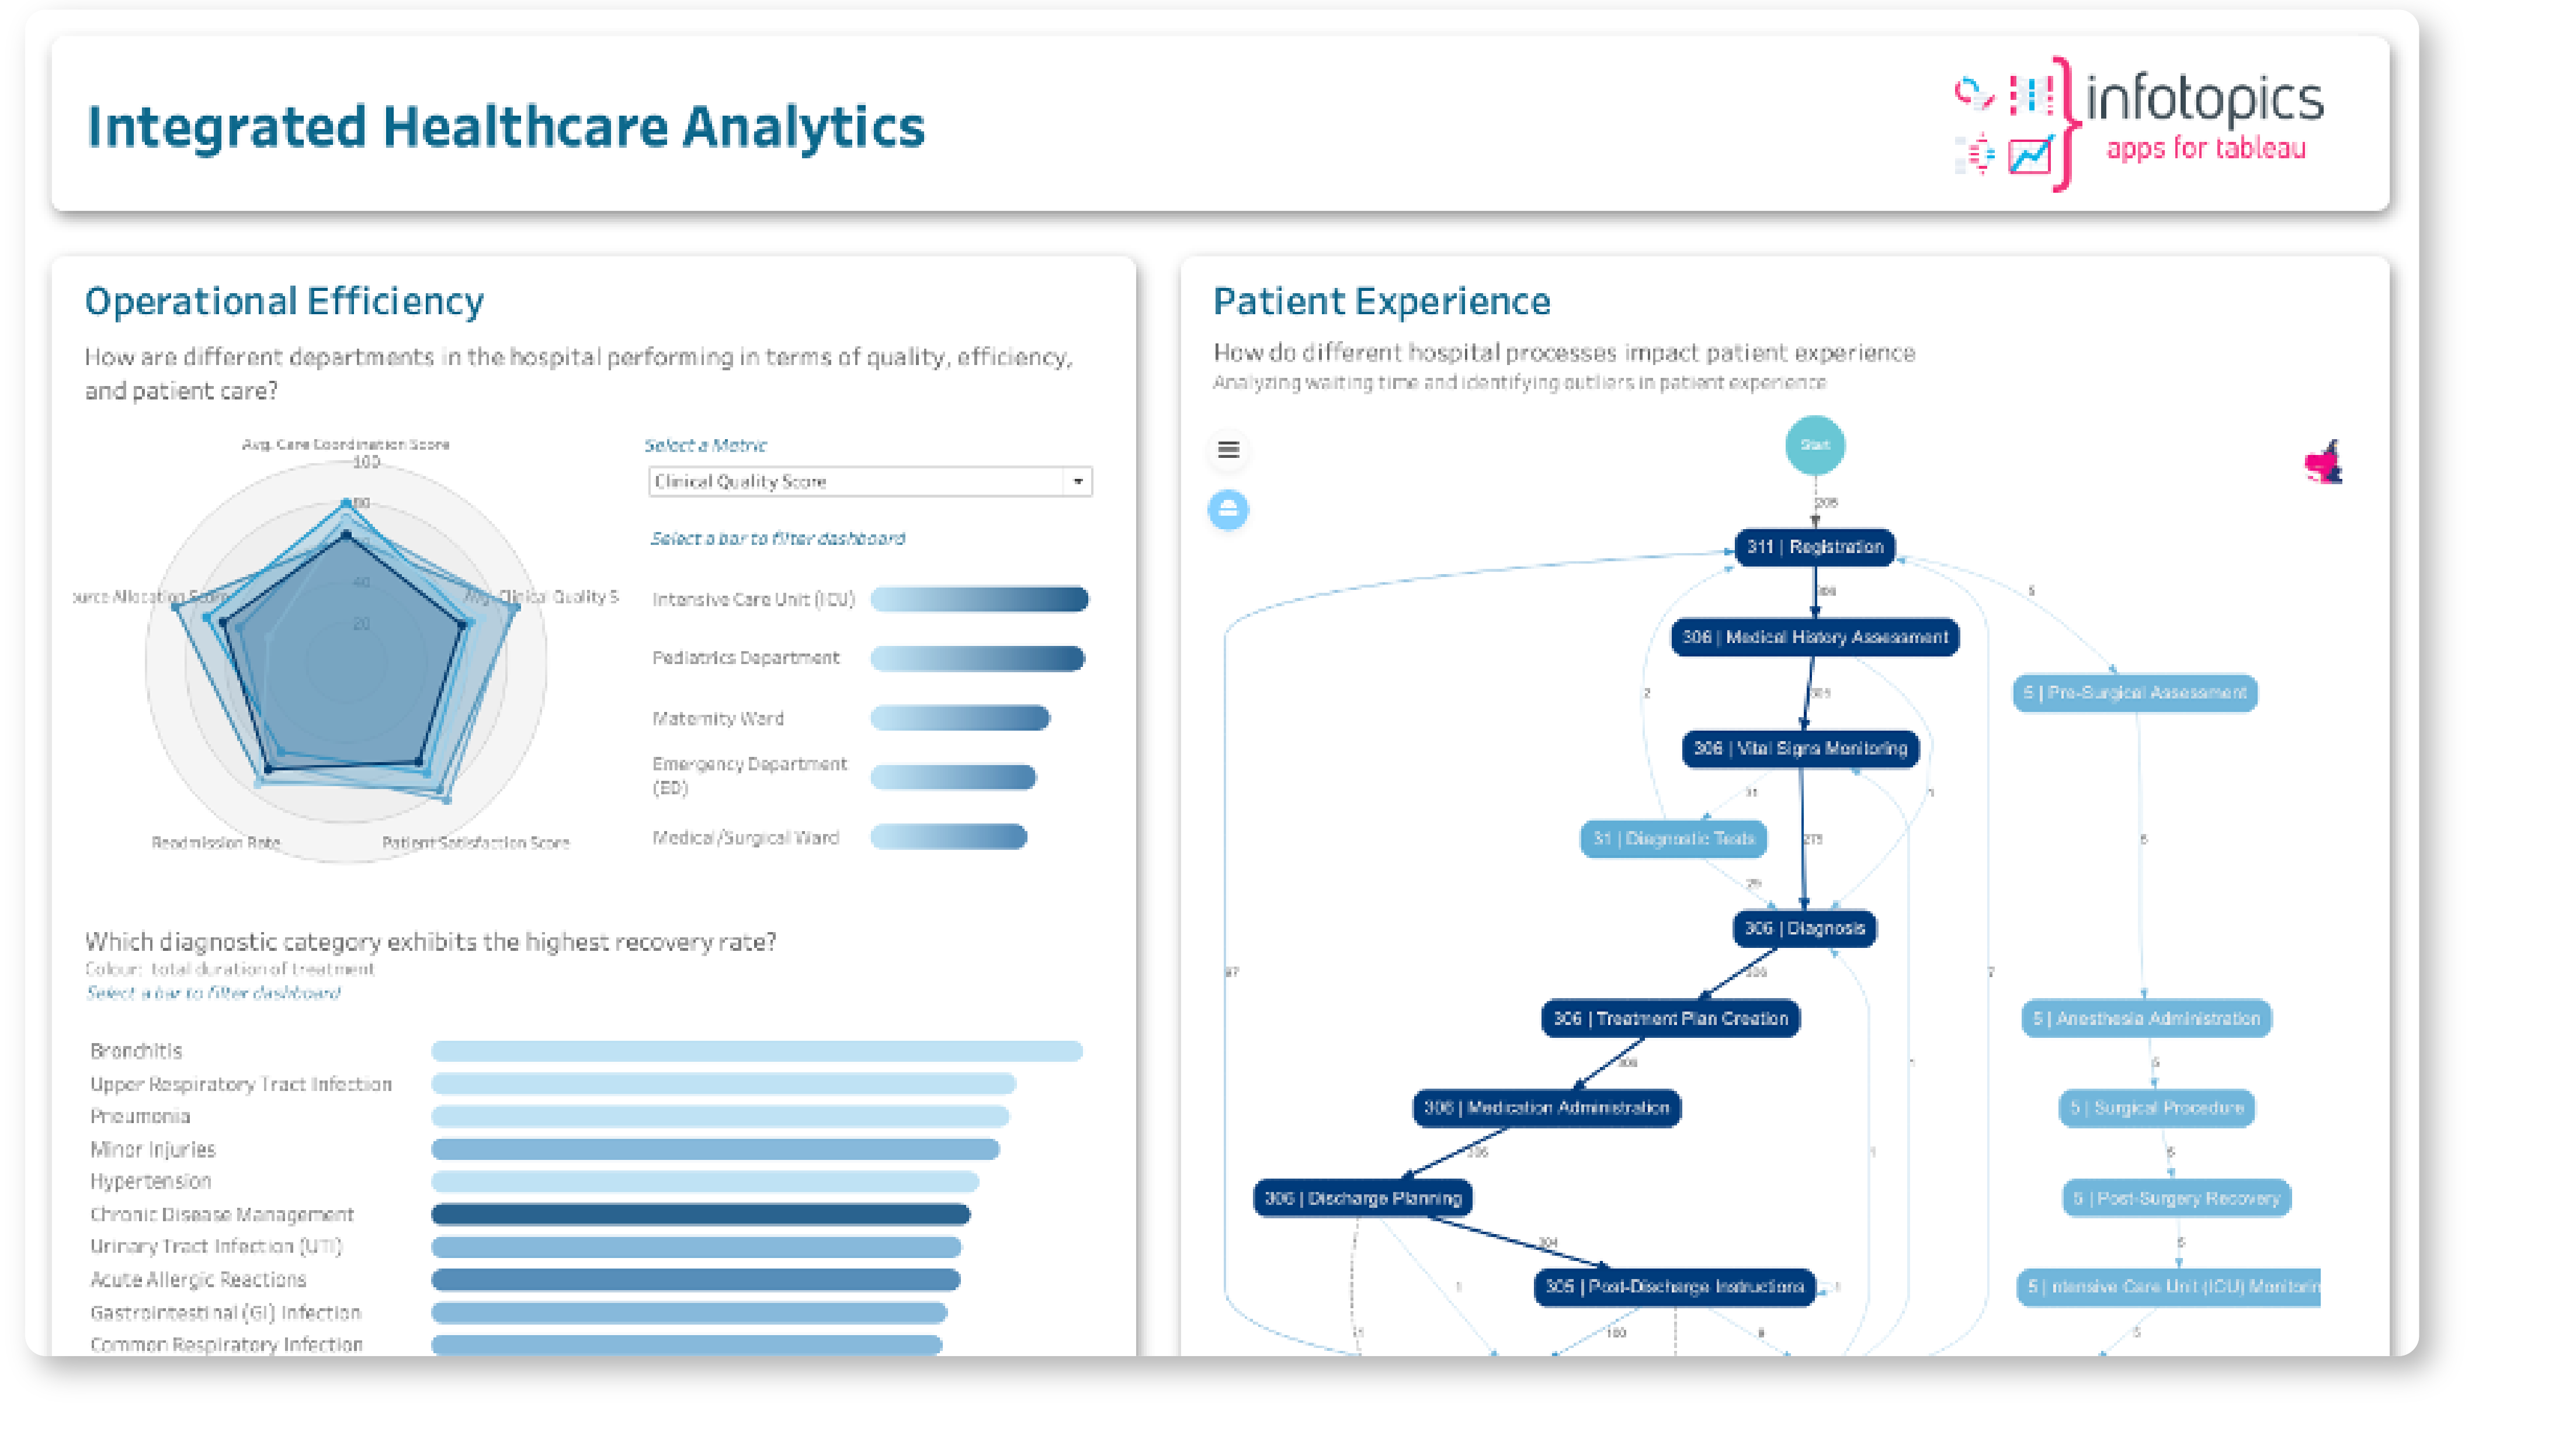
Introducing our advanced healthcare analytics dashboard, a powerful solution enabling users to compare ward performance with a real-time Radar Chart and explore detailed recovery rates for diagnosis groups. With seamless integration of Process Mining, you can efficiently analyze root causes, optimize problem areas, and gain valuable insights into patient journeys. This workbook with revolutionary capabilities of Process Mining, empower you to optimize processes and gain invaluable insights.

Discover how Americans spend time and money in relationships. The spotlight is on the Sankey chart—a powerful visualization effortlessly set up in minutes with ShowMeMore Tableau extension. Uncover captivating insights, from the steady rise in solo living to the shifting dynamics of time spent with friends and family as age progresses. Discover and understand more in minutes with our simple Sankey chart!

Explore the world of agriculture through our dynamic dashboard. Use the Hierarchy Filter for seamless data refinement, and discover regional insights with the interactive map and horizon chart from ShowMeMore. Uncover valuable agricultural trends effortlessly. Plus, the SuperTables on the right offer in-depth analysis with flexible layouts, empowering you to make informed decisions. Download now to dive into a wealth of data-driven decision-making.

Supercharge your marketing campaigns with our Tableau Marketing Campaign solution, the key to unlocking real-time insights and maximizing ROI. Utilize the intuitive DrillDownTree for in-depth exploration; The DrillDownTree functionality empowers you to delve deeper into campaign specifics, facilitating a granular understanding and strategic refinement of your marketing initiatives. The Marketing Campaign Analysis dashboard is your secret for actionable insights, enabling data-driven decisions and optimizing campaign effectiveness. Elevate efficiency, enhance decision-making, and embrace the power of data-driven marketing with Tableau.