ShowMeMore
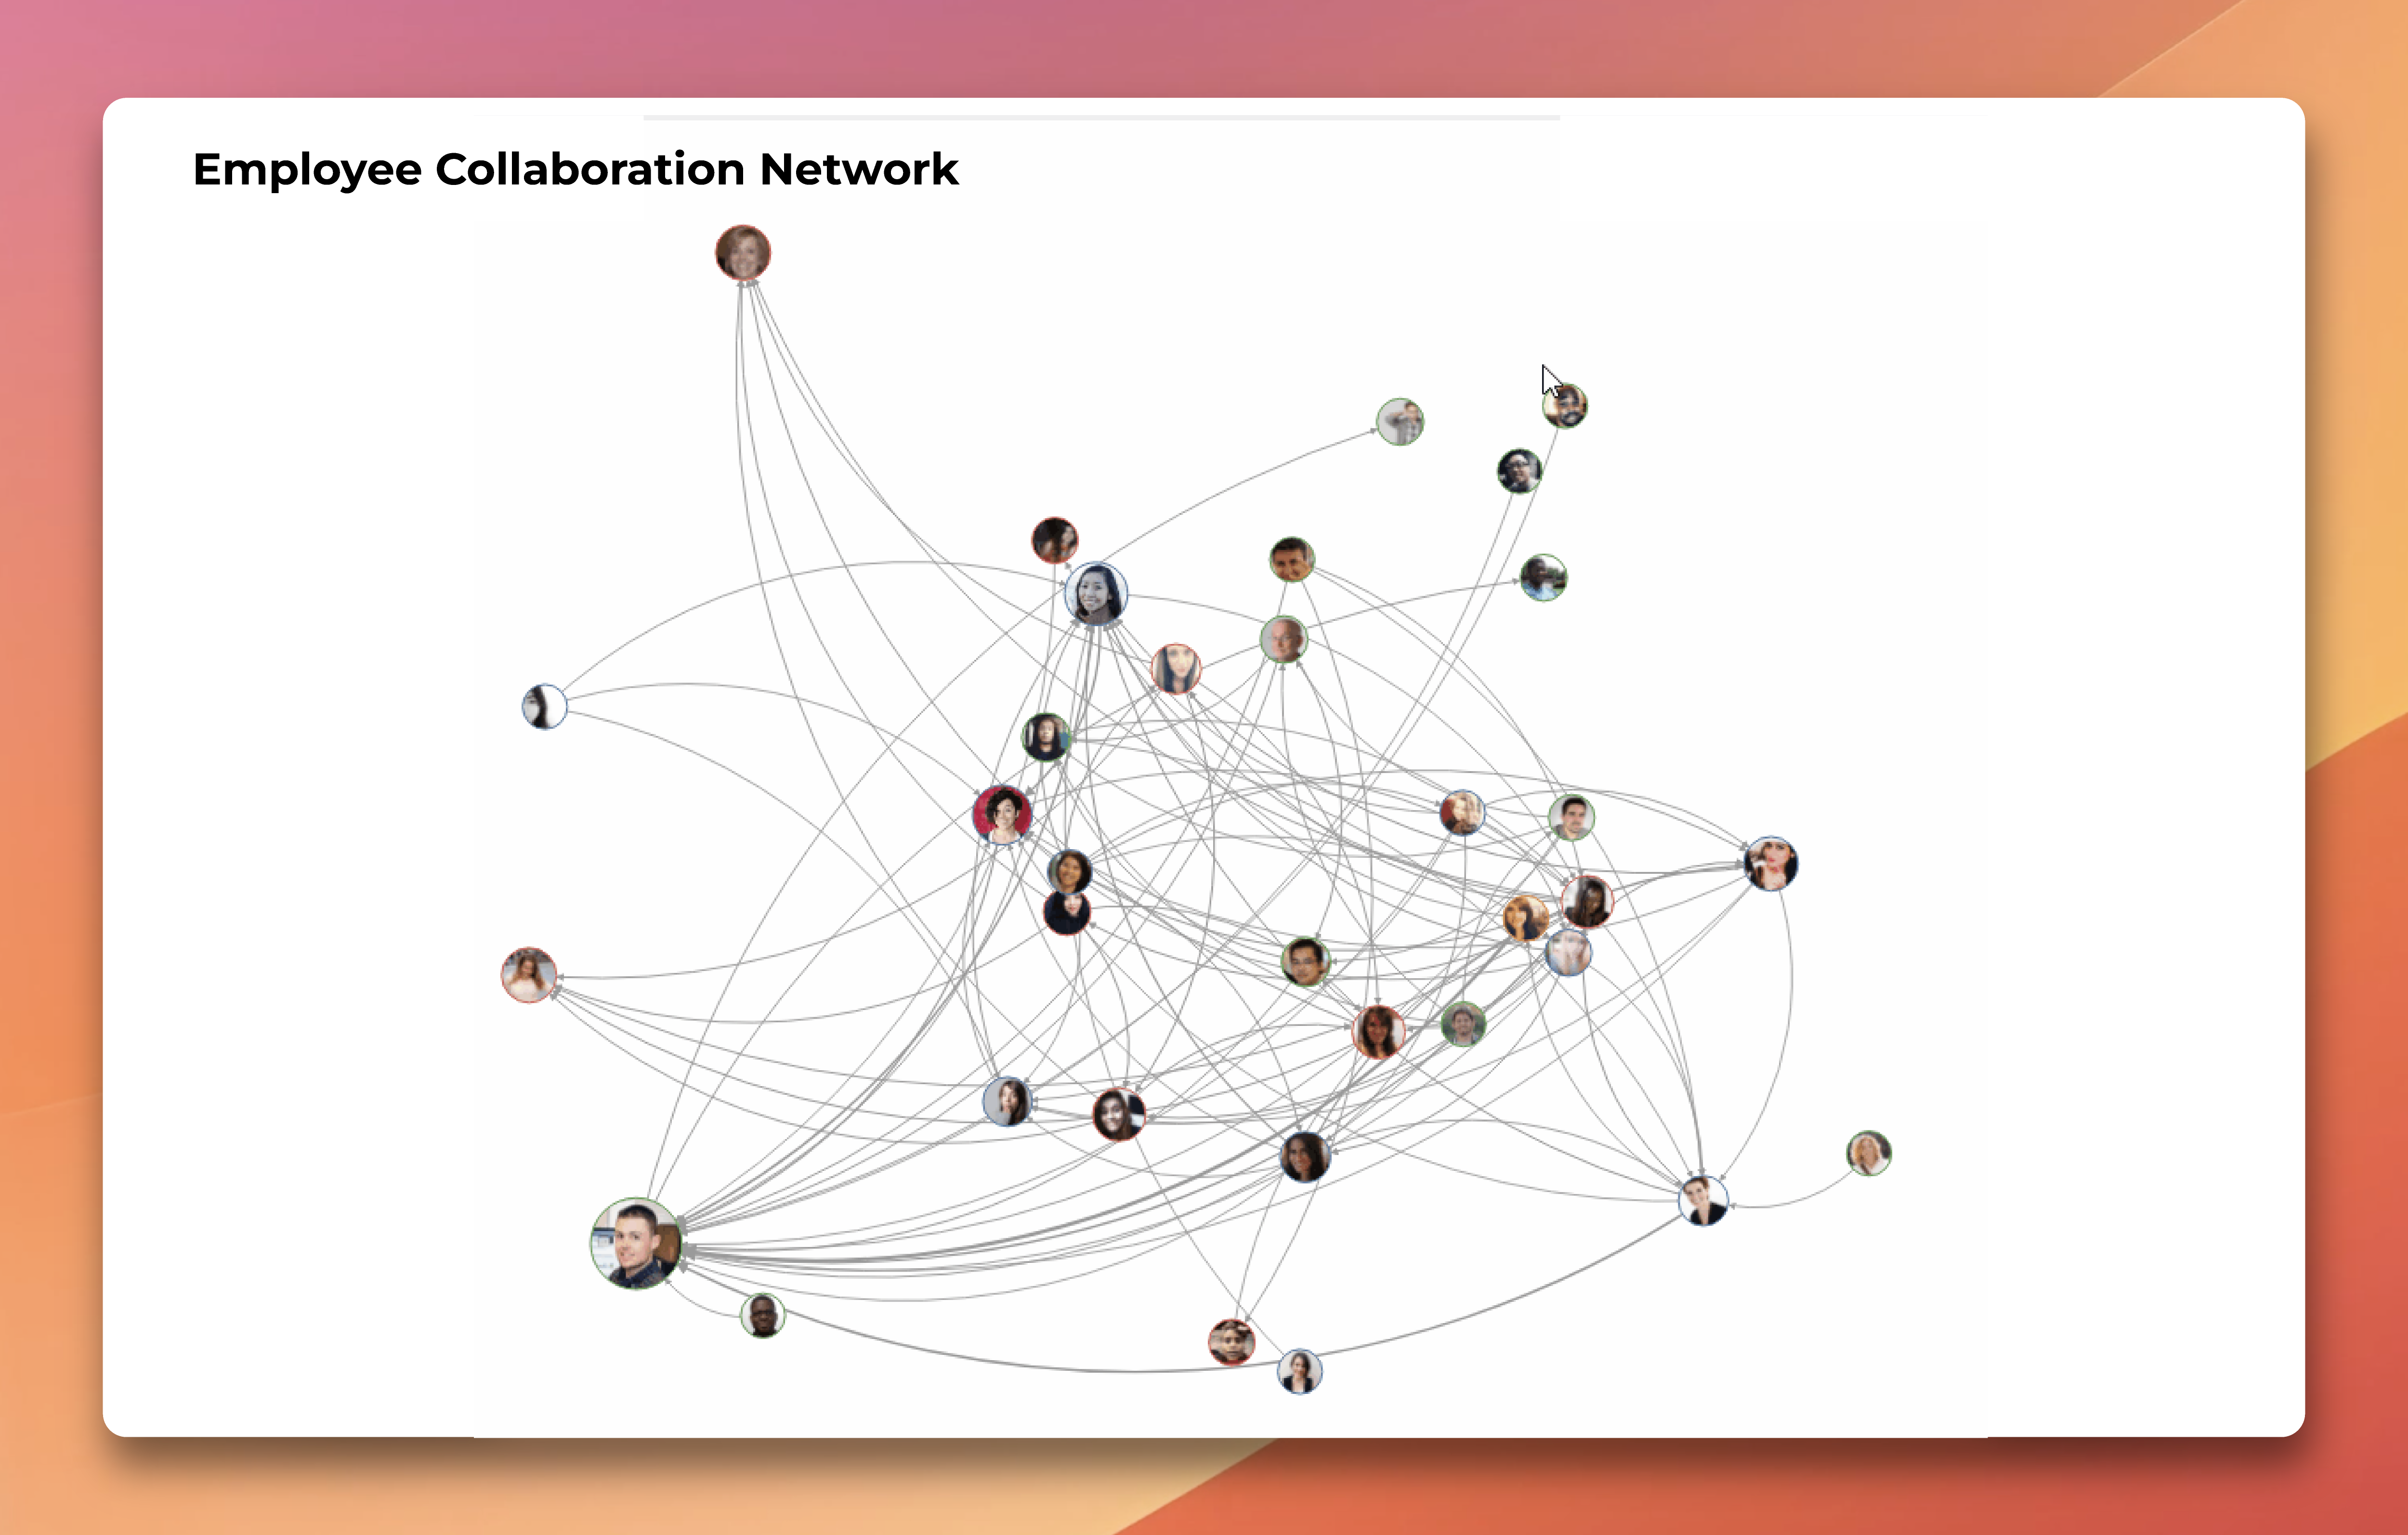
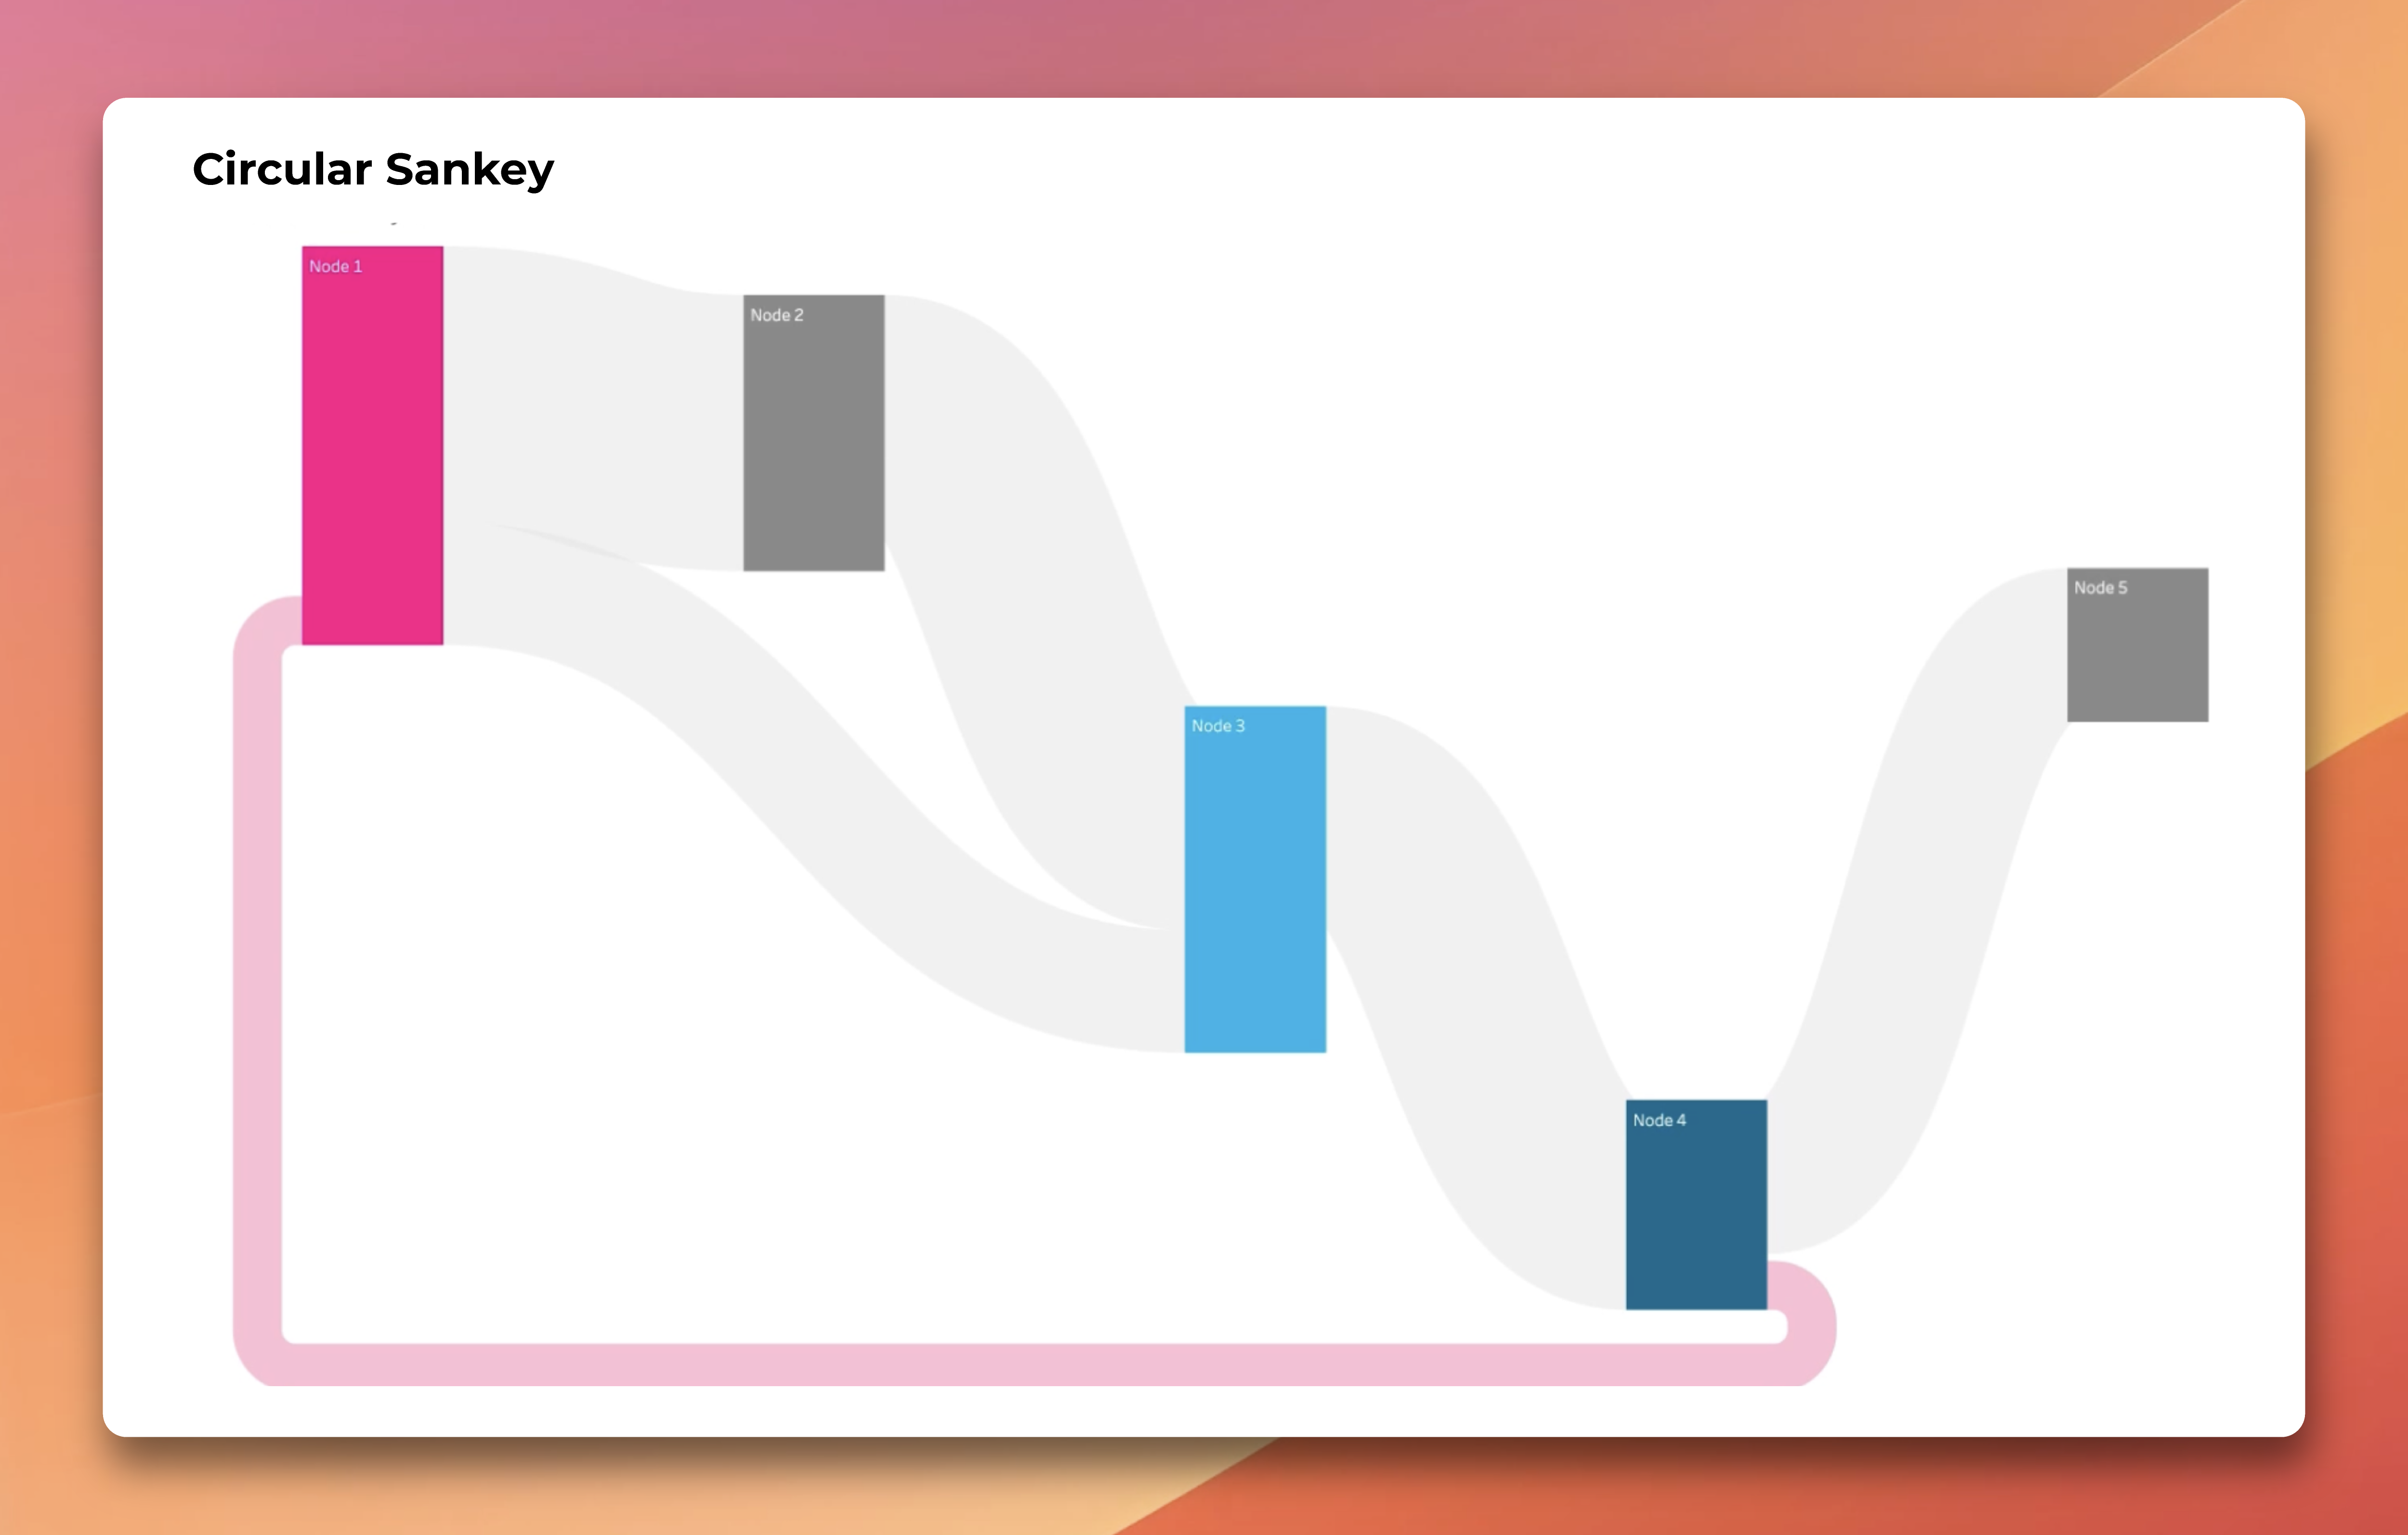
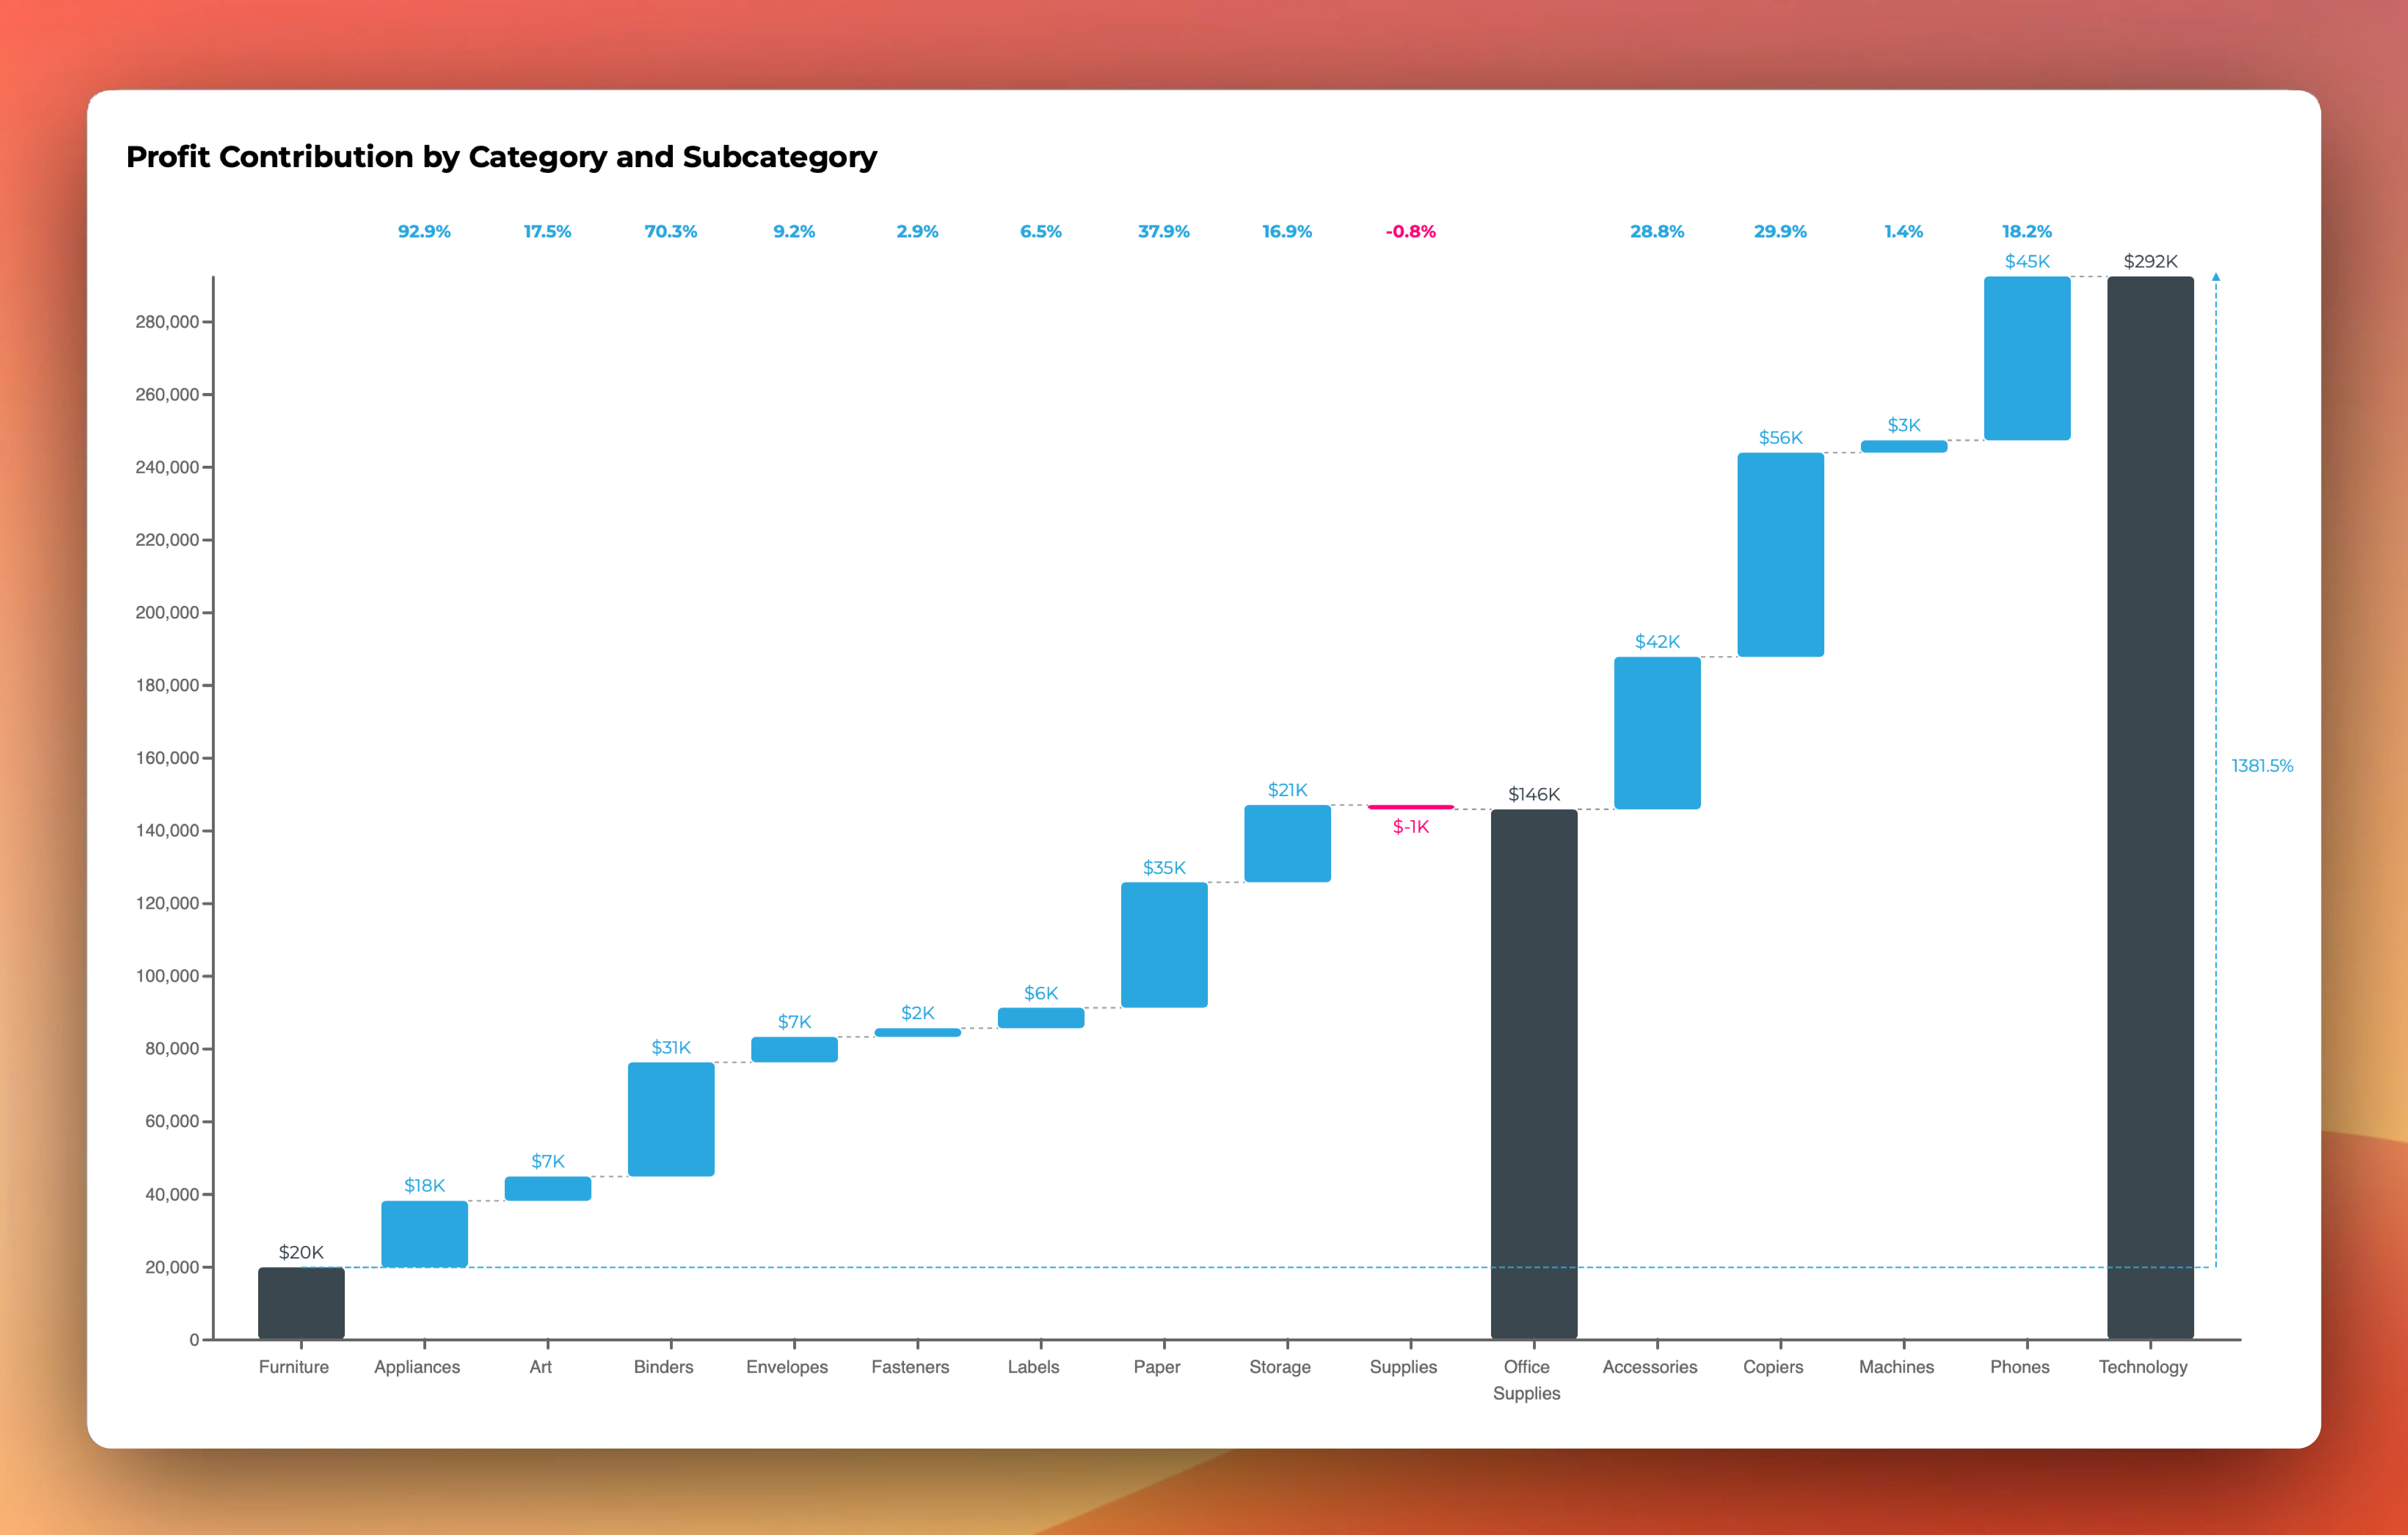
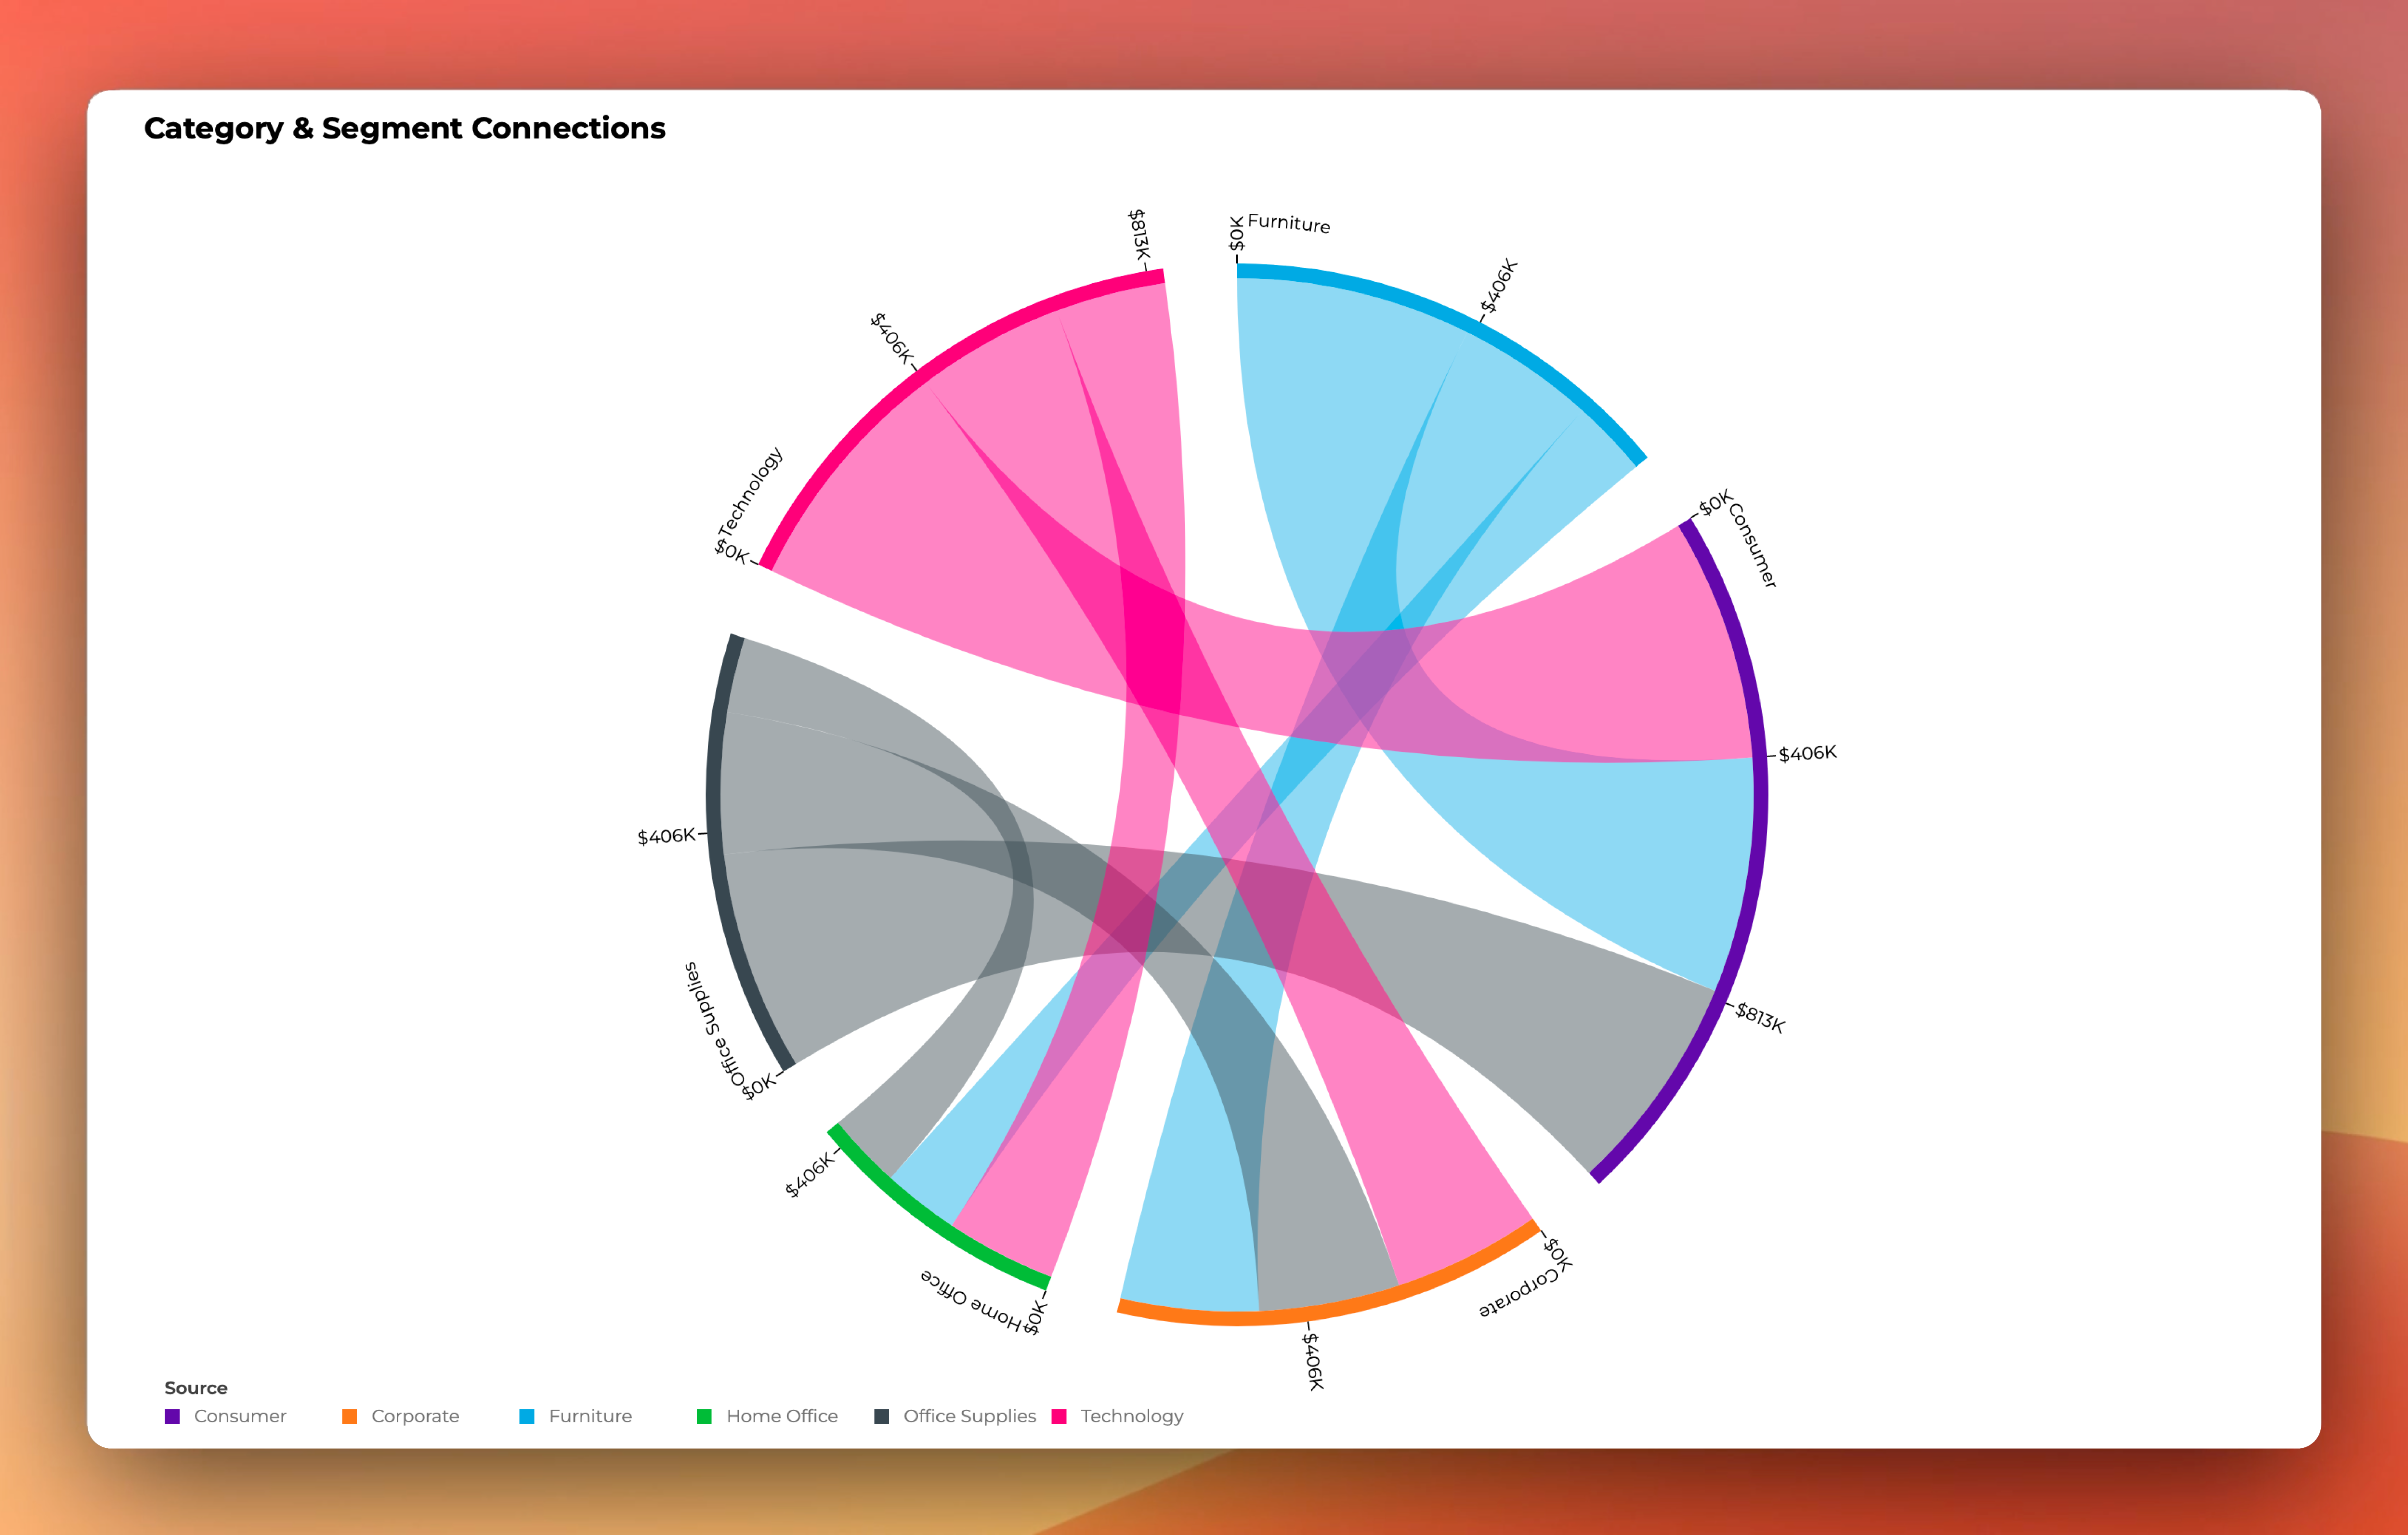
15+ stunning visuals

Learn from real-life use cases.


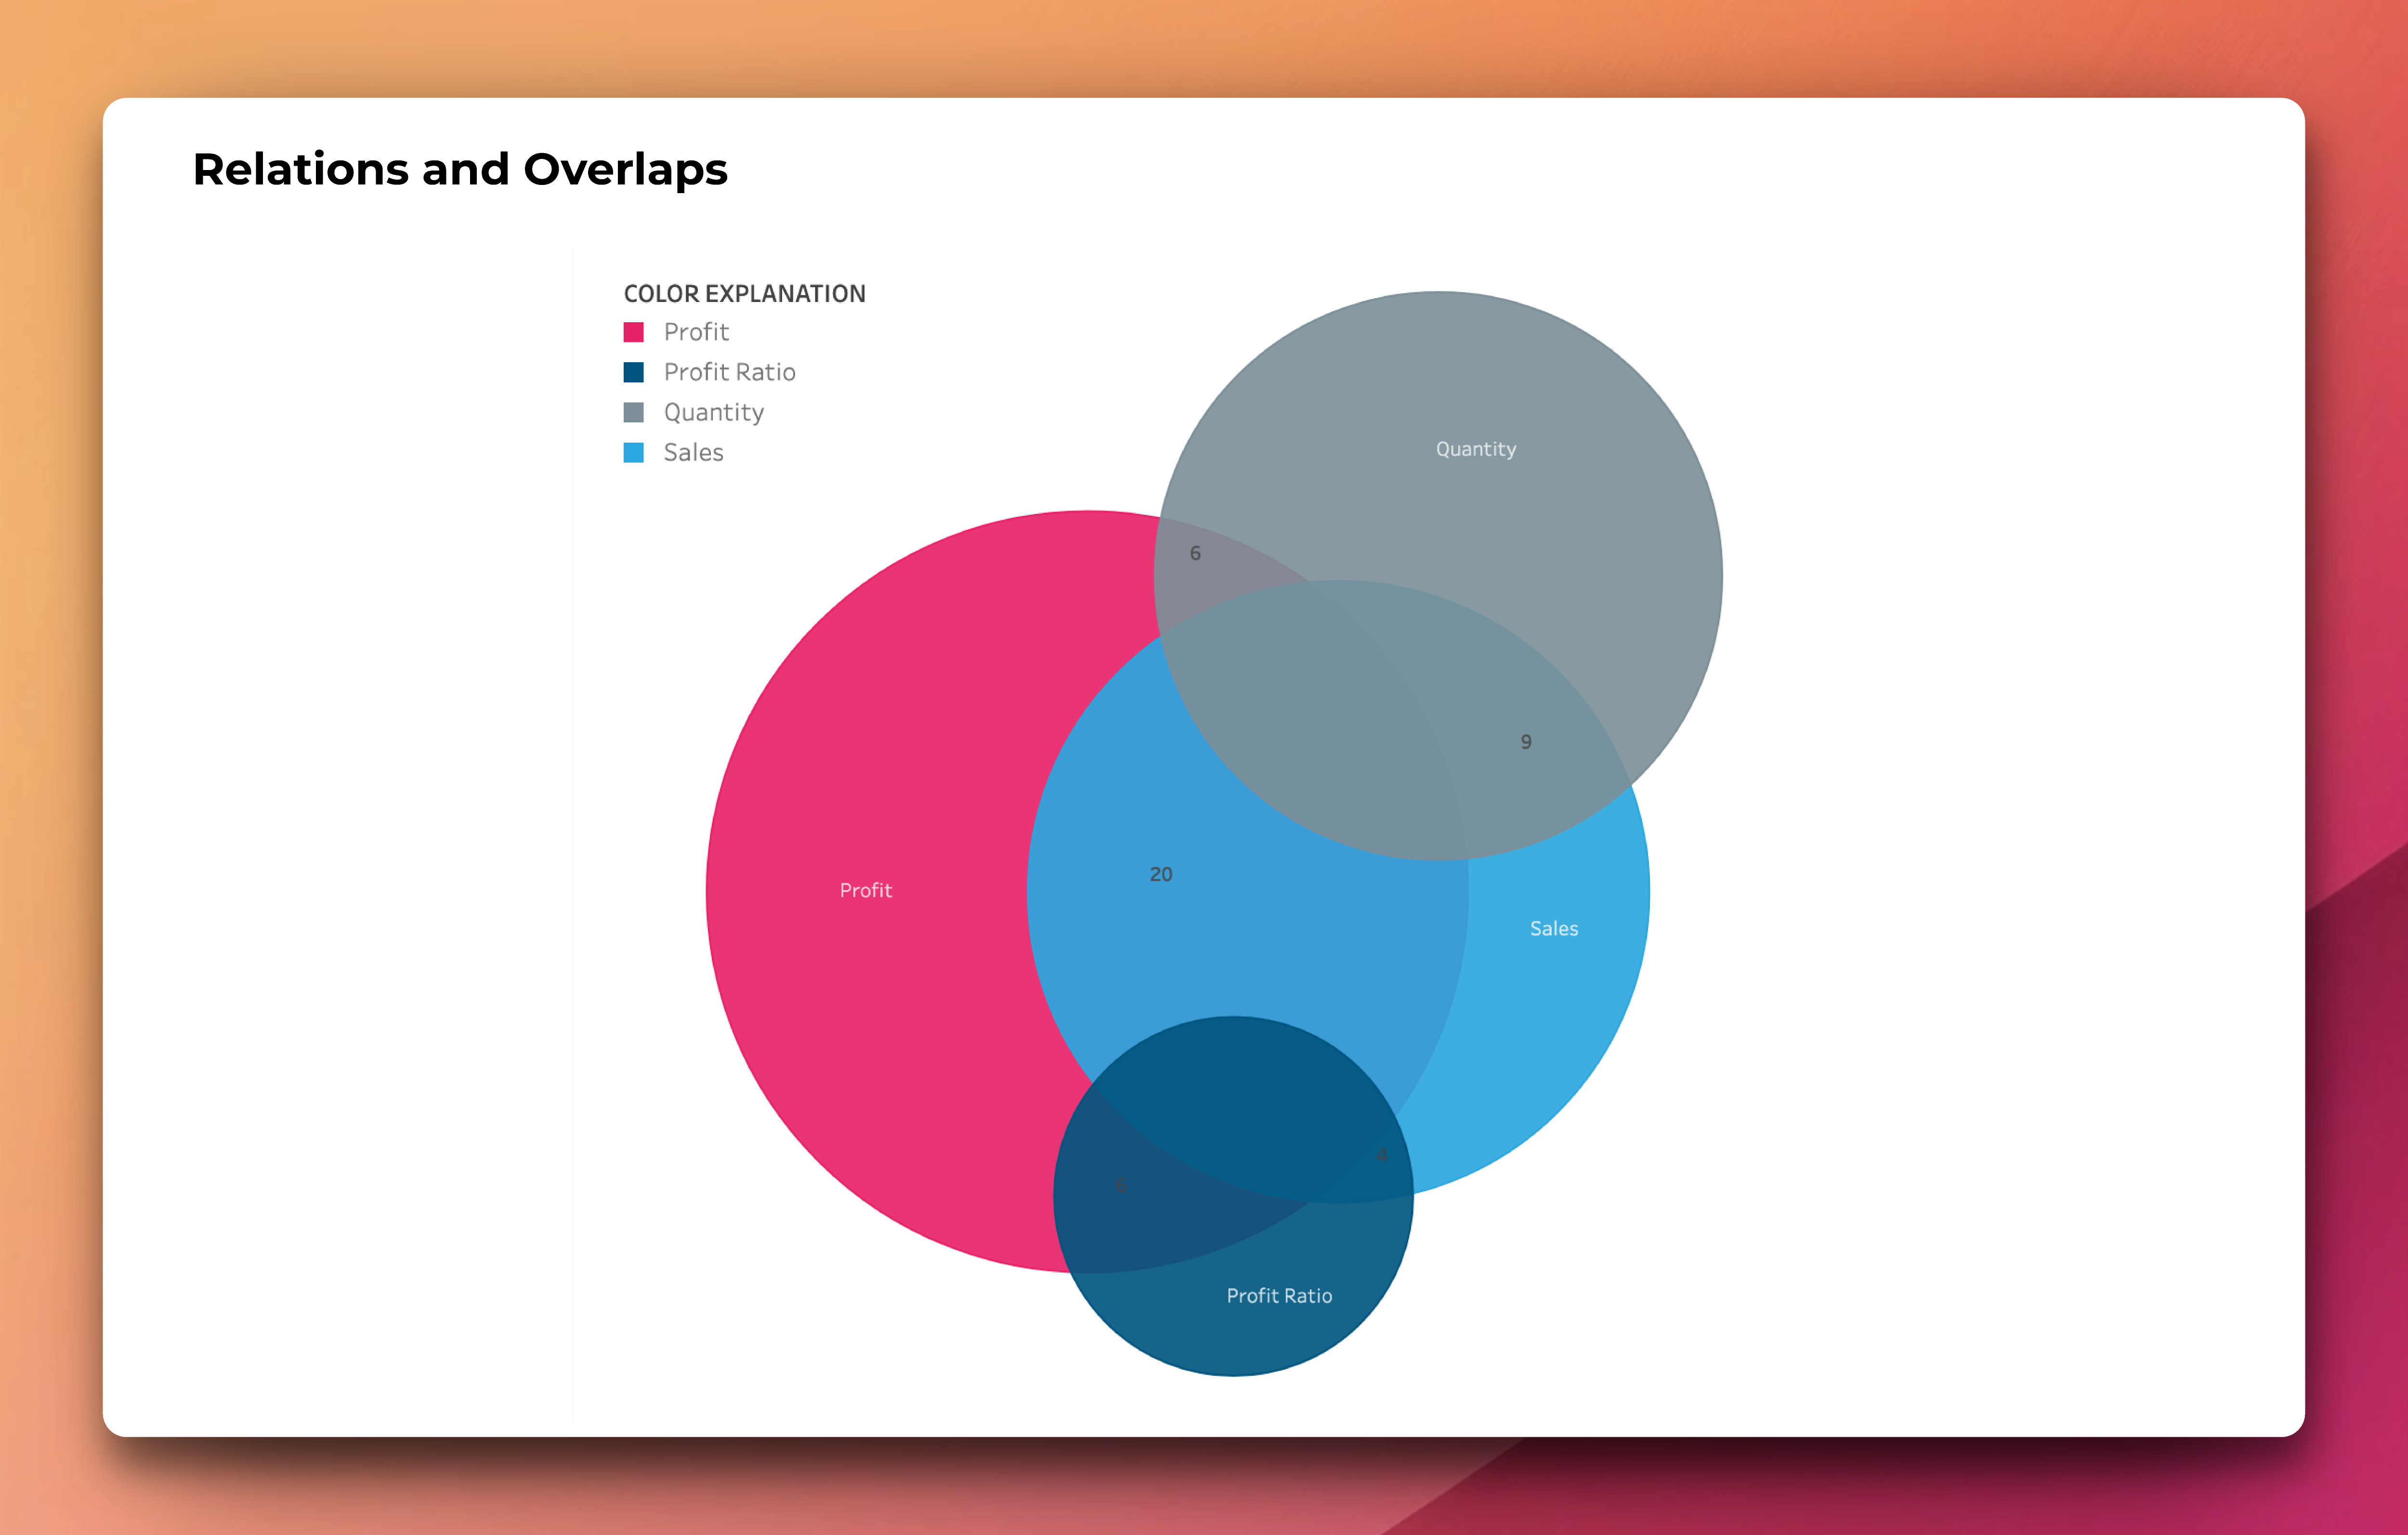
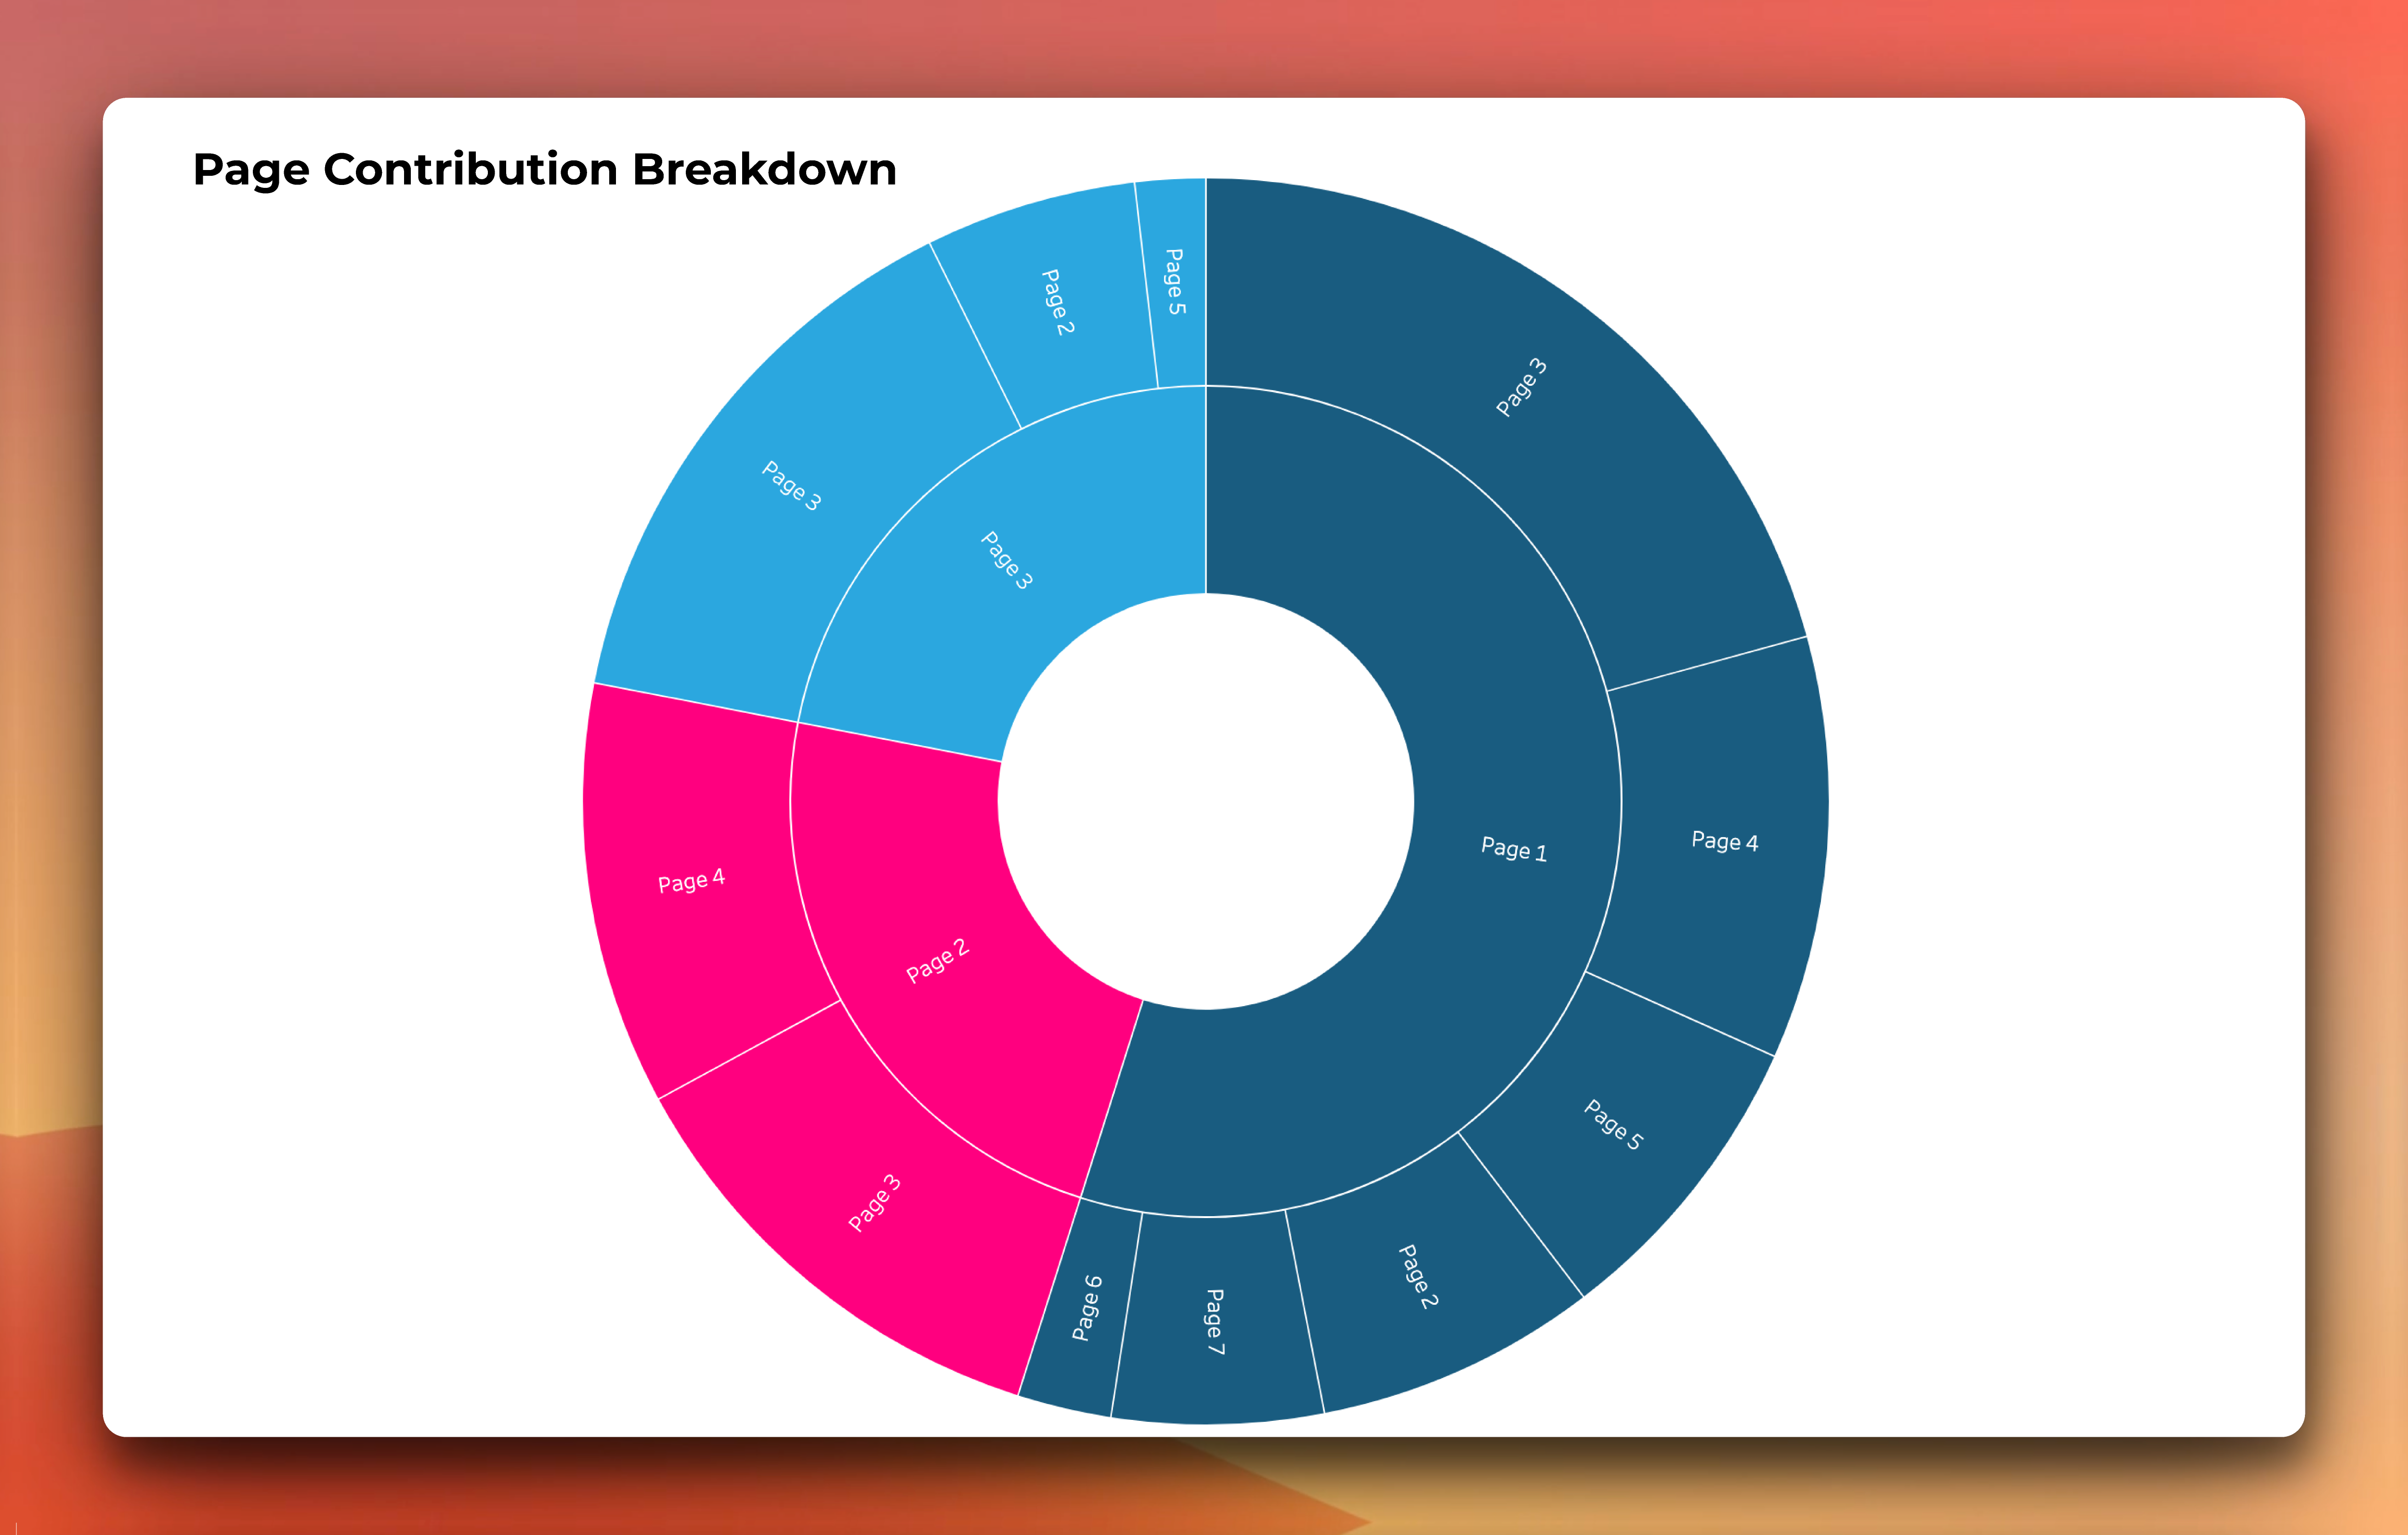
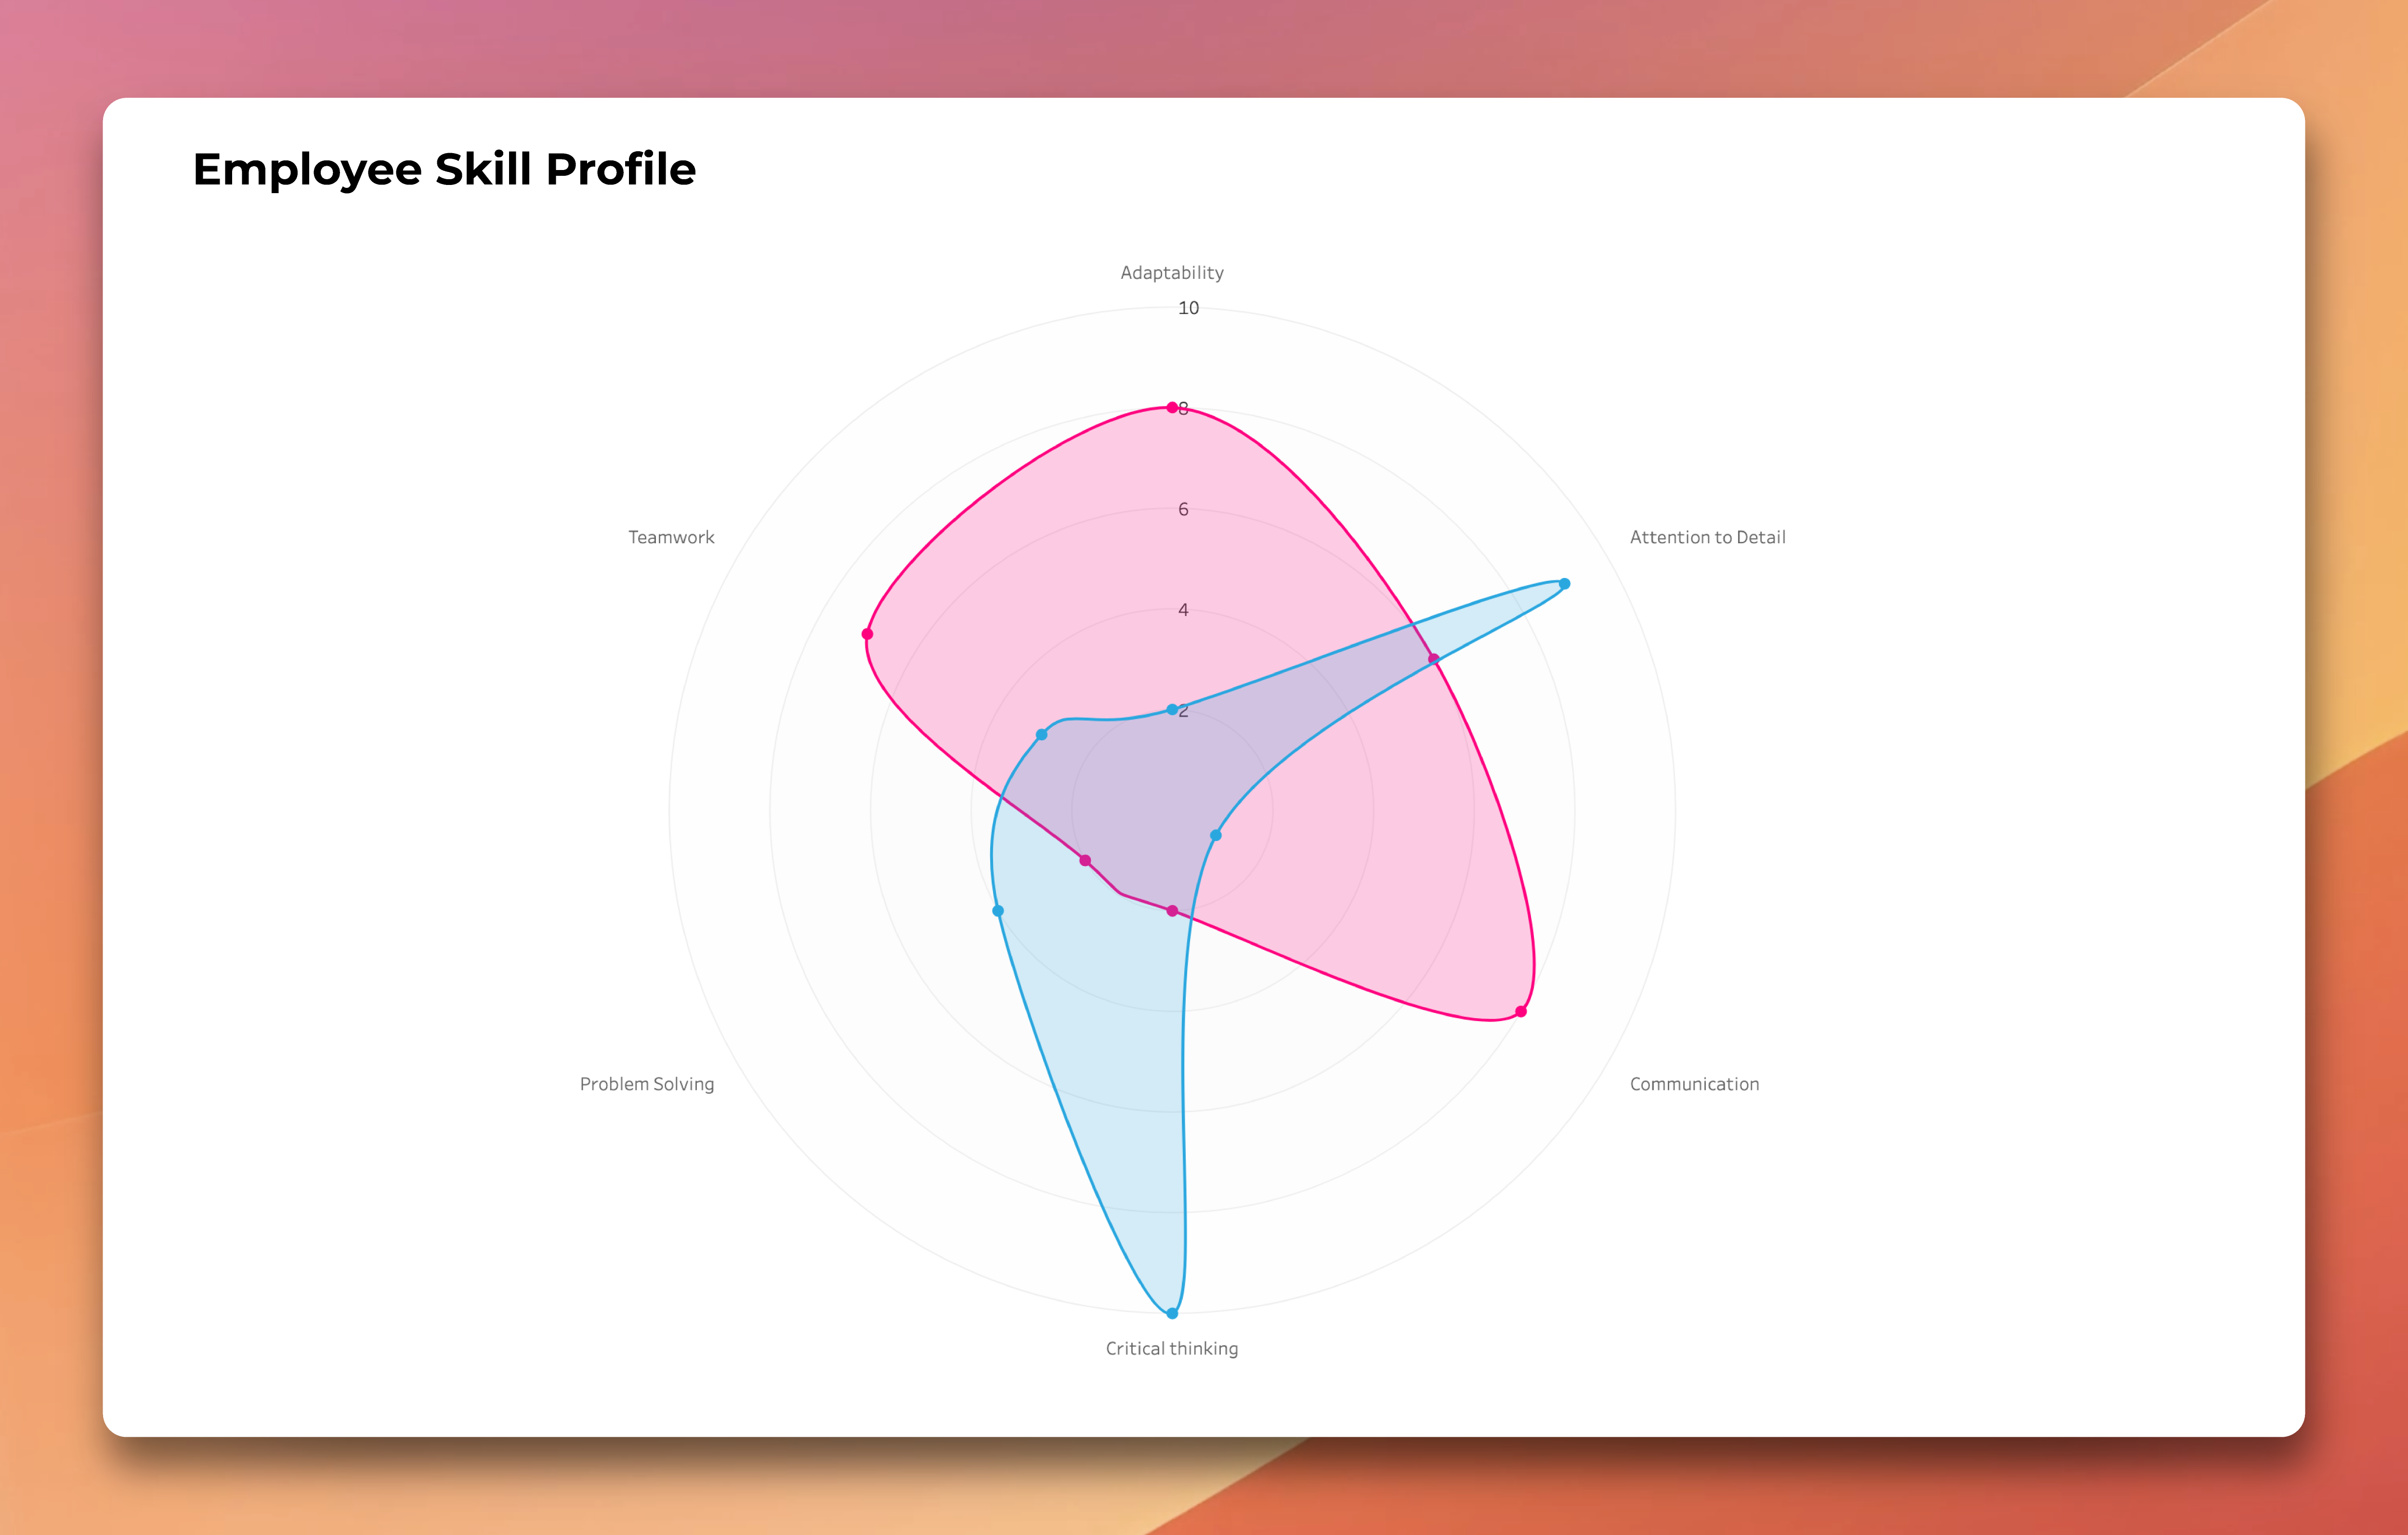
Next-level data visualizations.
Countless features for your use case.

“Thanks to ShowMeMore, the team is now able to understandably visualize all flows and present them easily to the stakeholders.”

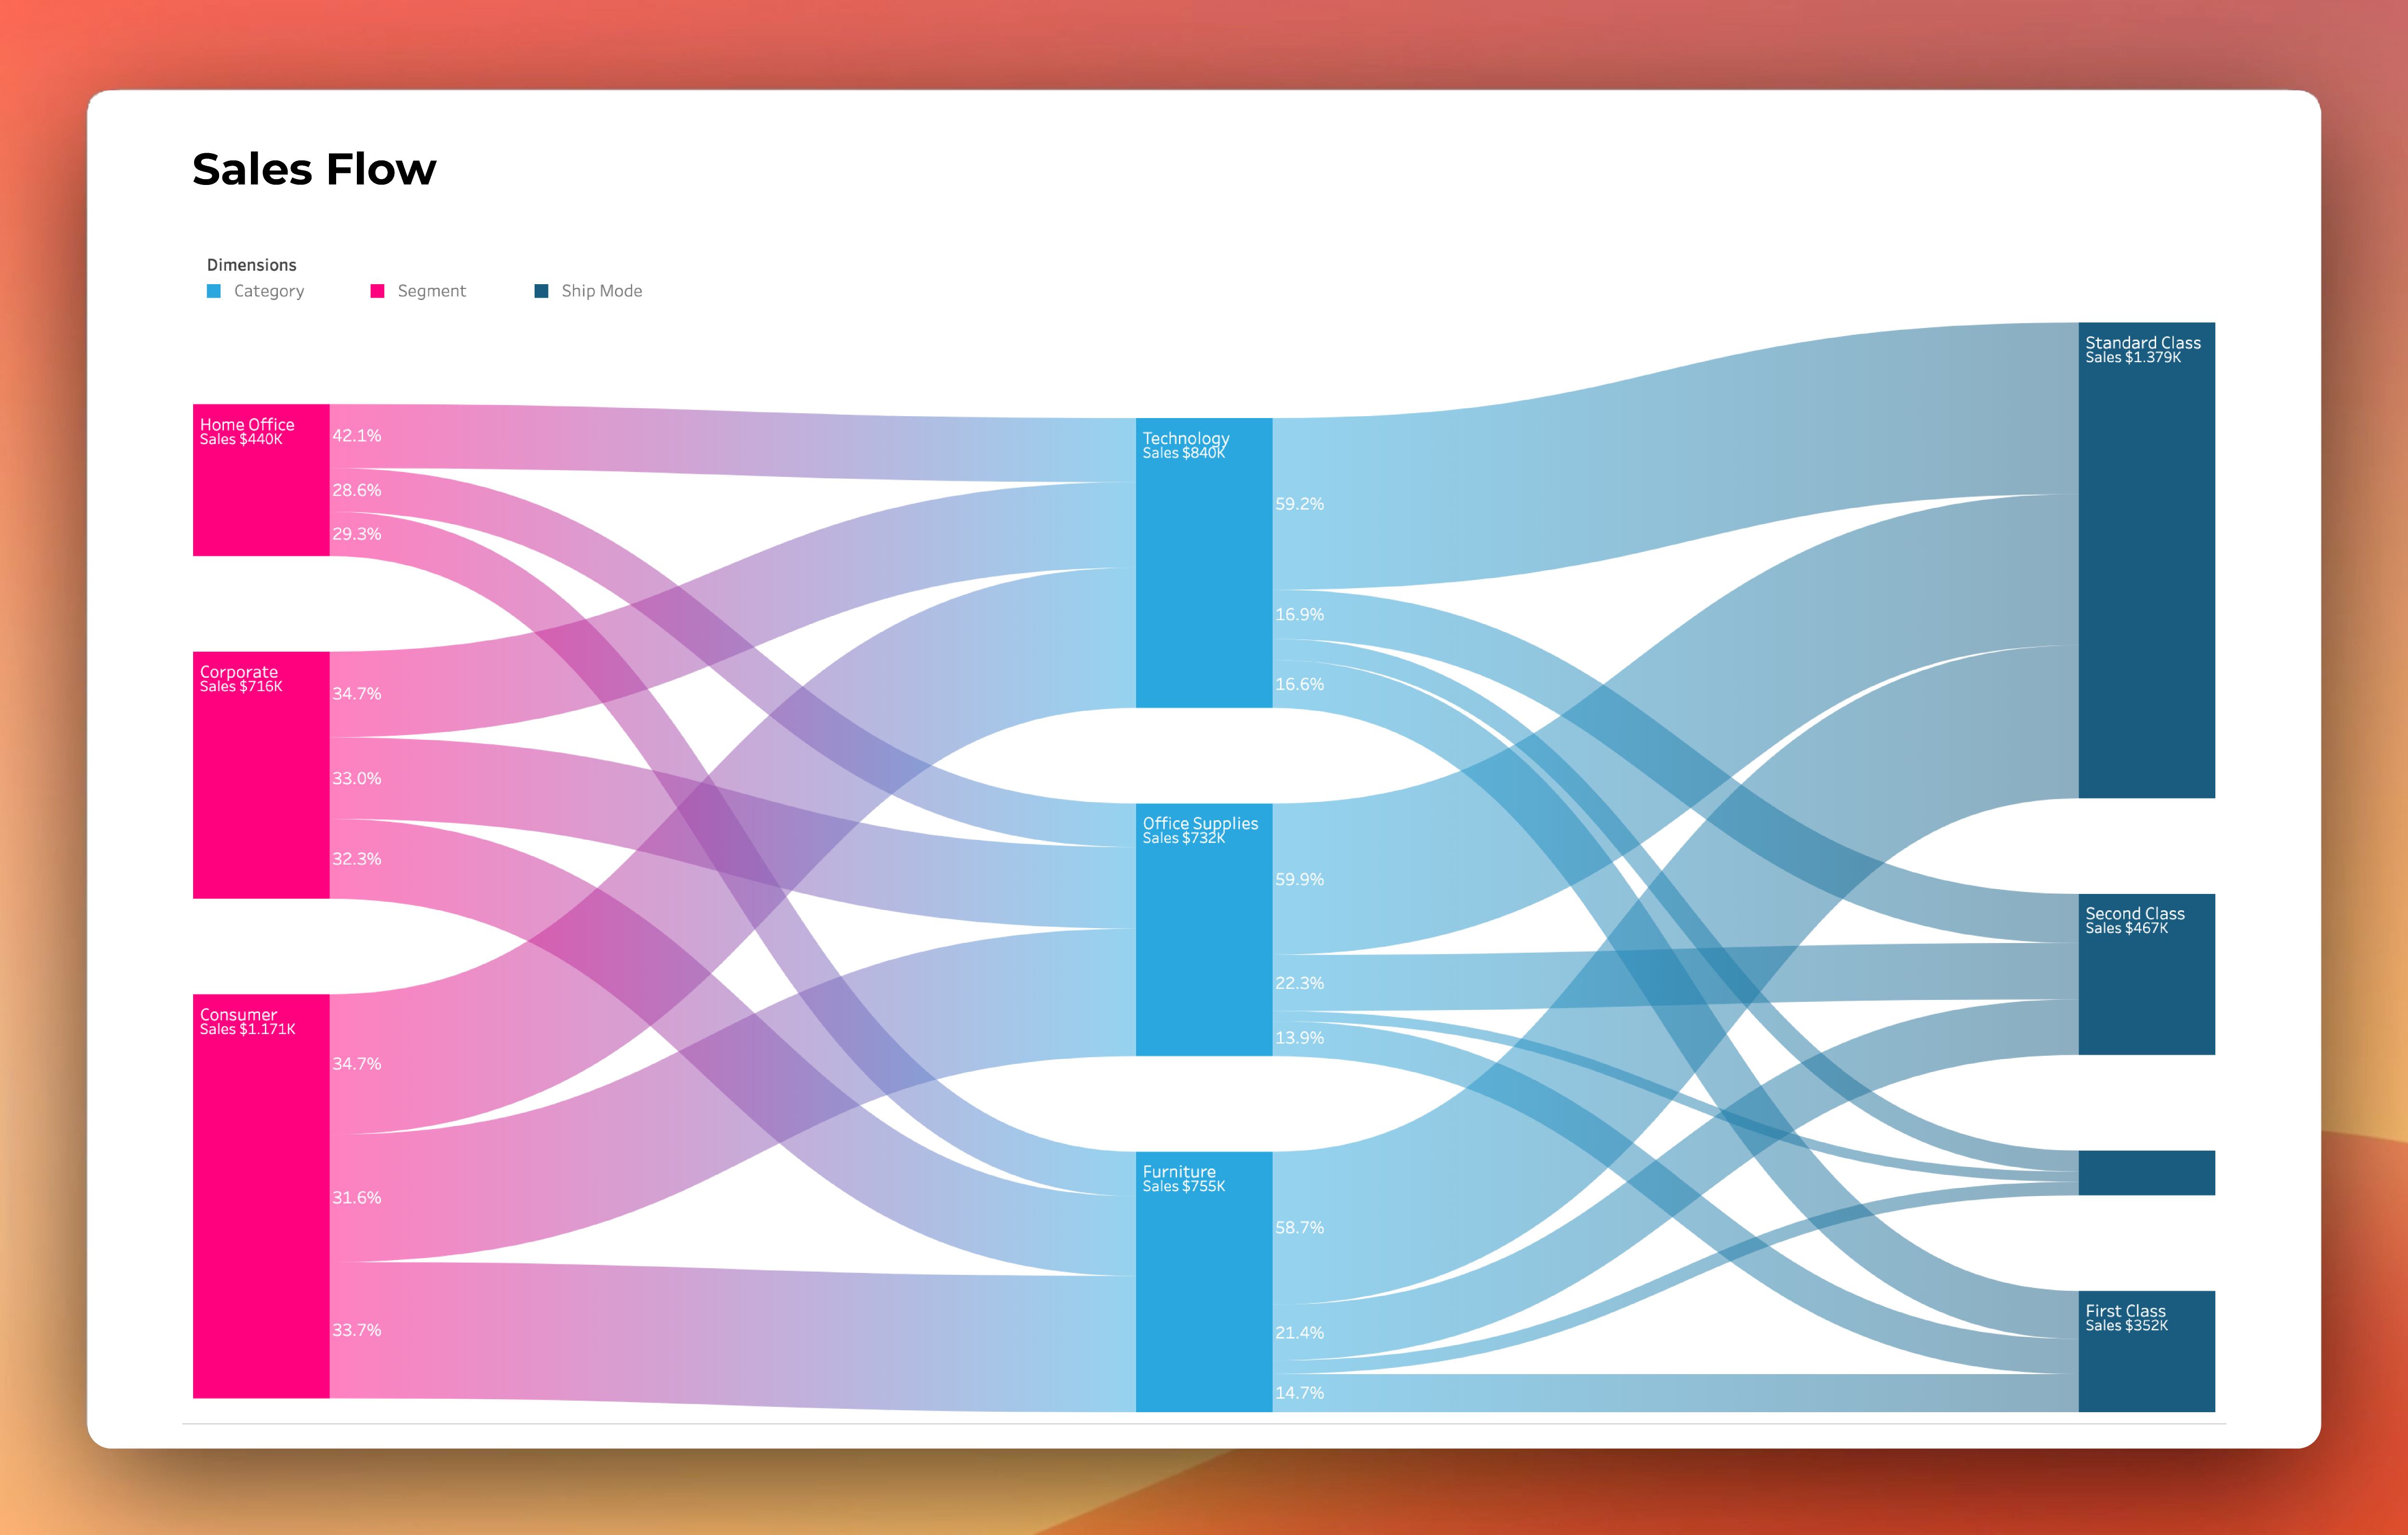
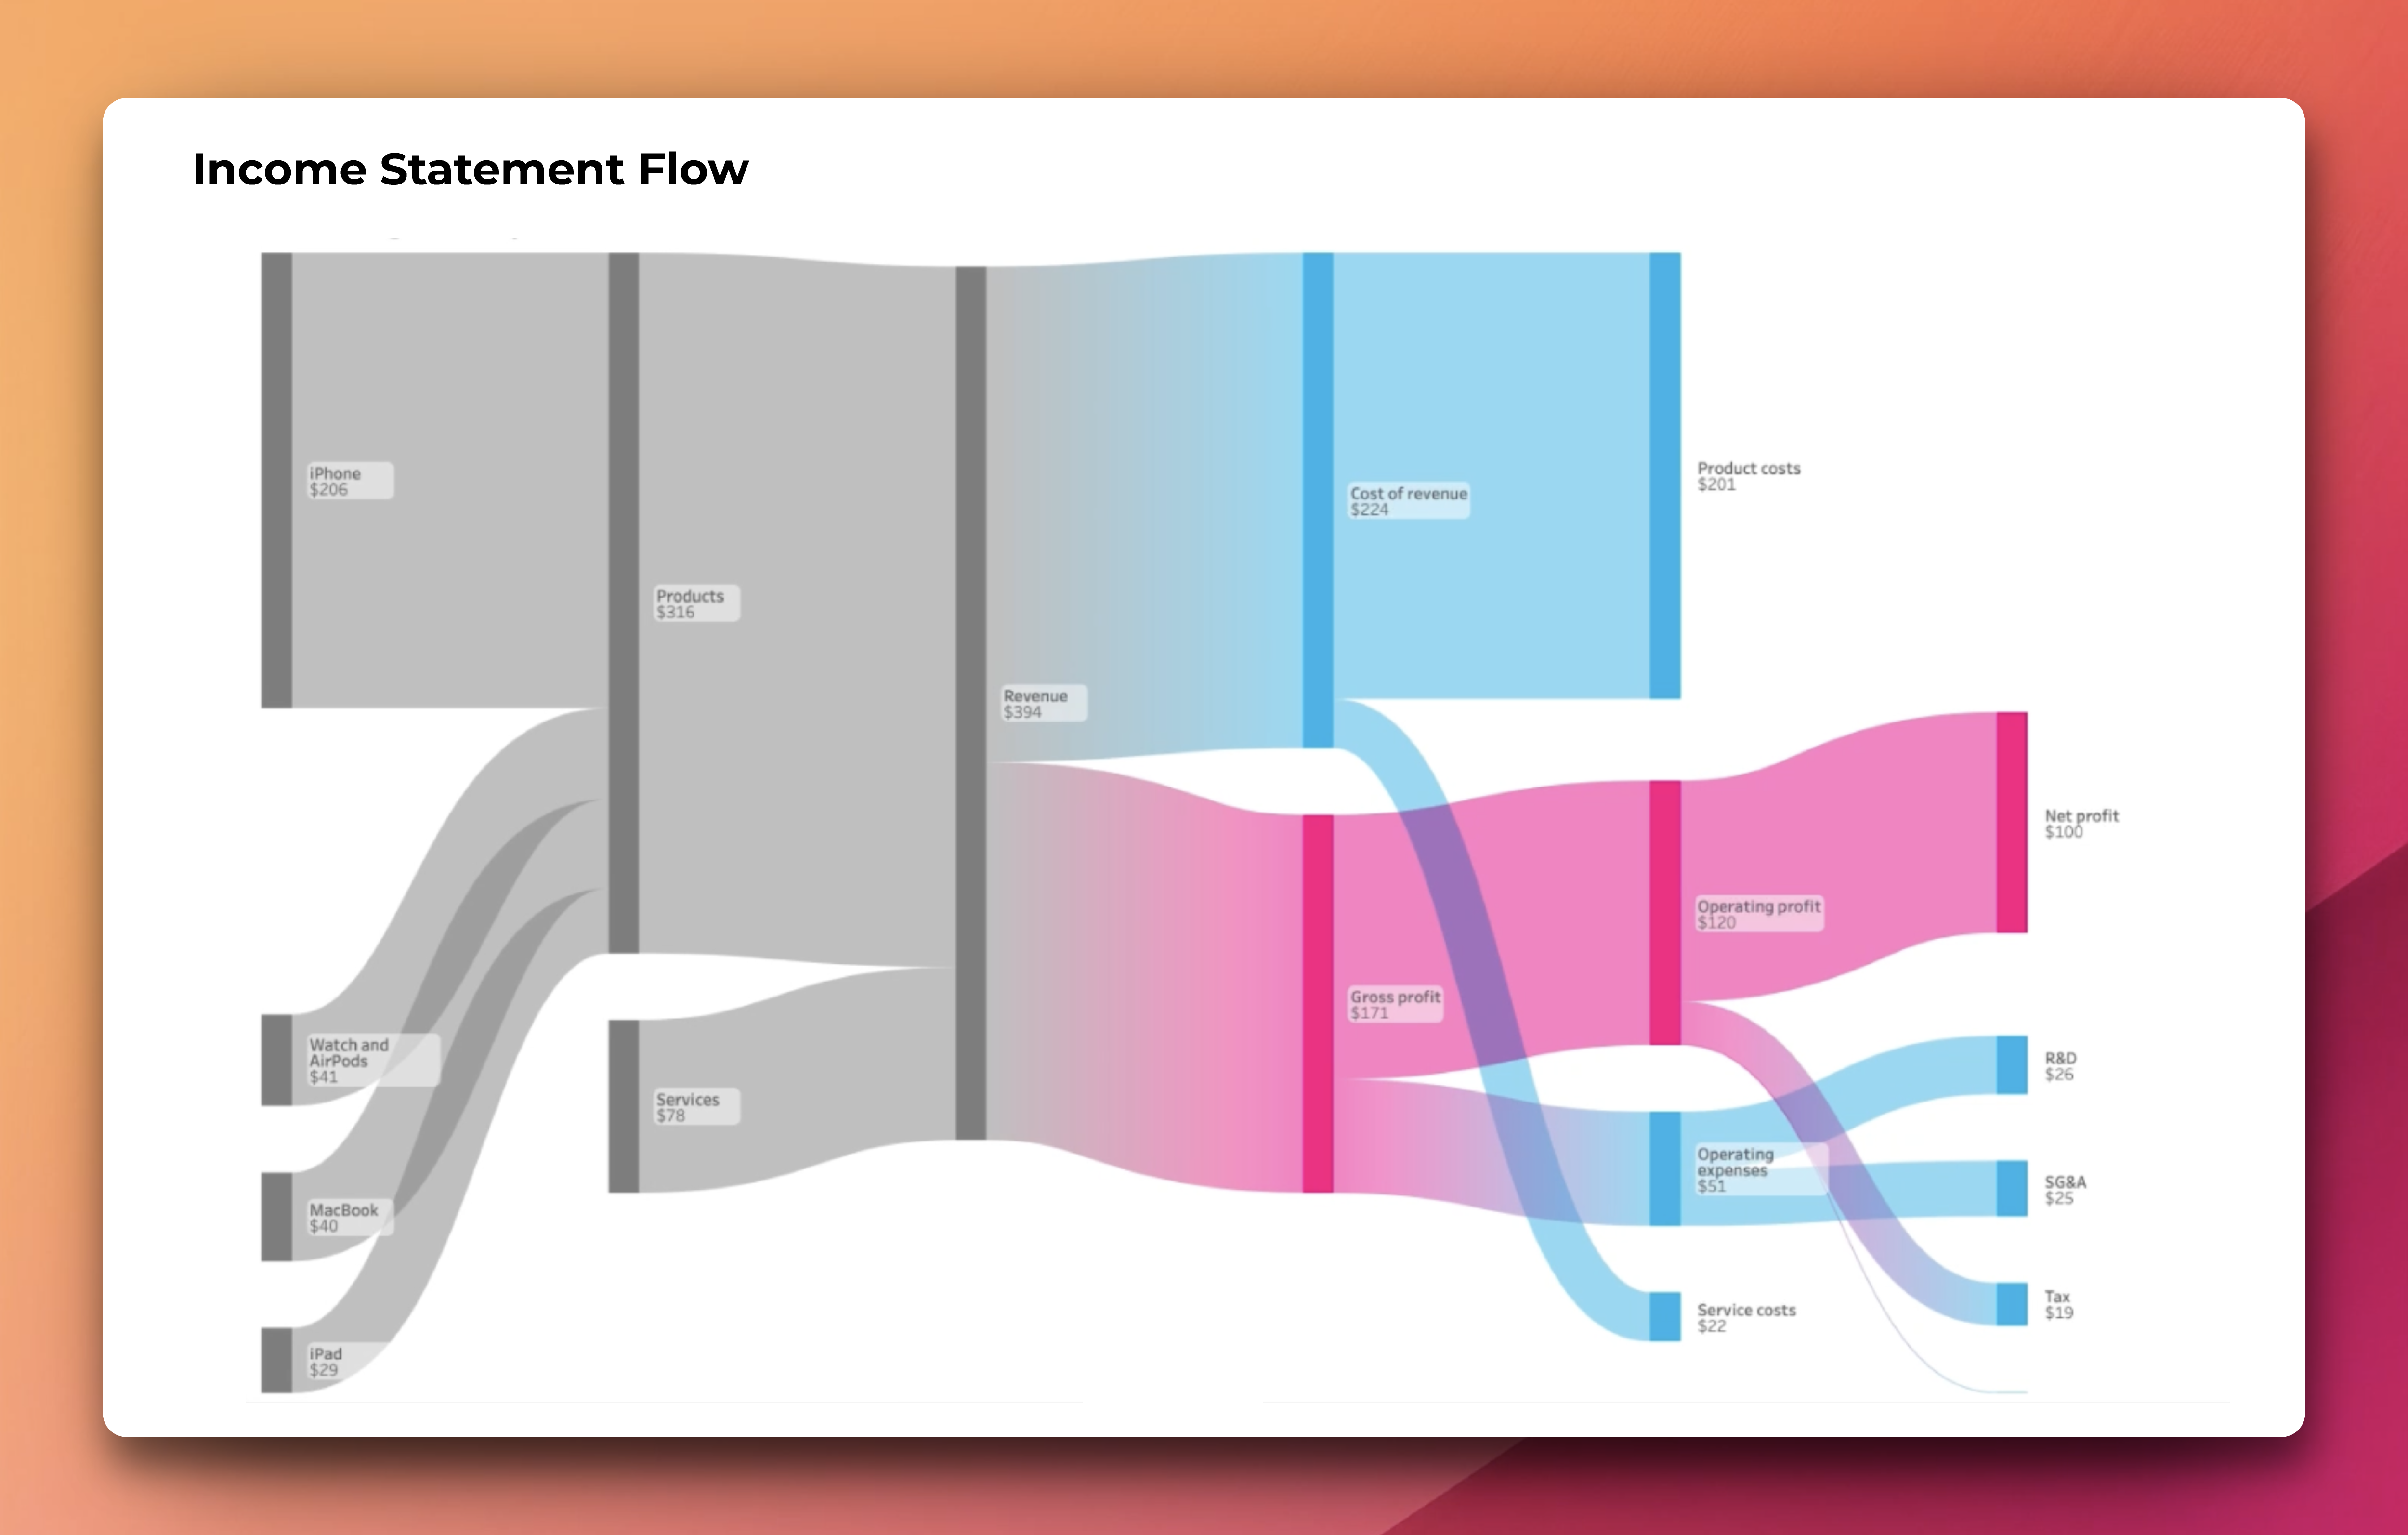
“I installed ShowMeMore in Tableau Desktop, imported the data I wanted to visualize and then I clicked a little bit around. Just like that, I created a Sankey Diagram! It only took about a minute, and the best part was that it effortlessly worked. It was really drag and drop on the dashboard and it works, which was the highlight of the experience.”

Let us help you get started.

FAQ.
Yes! Apps for Tableau has officially achieved ISO/IEC 27001:2022 certification.
You can find the information about our data security here.
Yes, you can request more information on the pricing page.
Yes, you can request more information by filling in the form on the pricing page.