Creating a Sentiment Analysis using ShowMeMore
In the world of data analytics, finding the right tools to create impactful visualizations is crucial. Rippleworx, a cross-industry people analytics platform for organizations looking to identify and impact workforce opportunities, had been searching for a solution to take their dashboards to the next level. When they stumbled upon Apps for Tableau, they discovered a powerful suite of Extensions designed to supercharge Tableau visualizations. Learn how they used ShowMeMore to create a Sentiment Analysis for a Police Department.
About Rippleworx
RippleWorx is a cross-industry people analytics platform for organizations looking to identify and impact workforce opportunities. Teams and executives interact directly with employees through a streamlined and intuitive application experience. Leveraging in-app feedback analytics, RippleWorx data intelligence becomes a catalyst for personalized interventions and intelligence-driven performance advancement. By collecting data over time, RippleWorx dashboards are powerful engines that impart actionable performance analysis, pulling the critical levers businesses need to impact readiness, drive purpose, improve recognition feedback, and stabilize retention. RippleWorx illuminates action paths from motivation to momentum, one ripple at a time.
“ShowMeMore- an essential Extension.”
– Derrek Moore, Tableau Developer at Rippleworx

From struggle to success: A seamless transition
The process of creating Radar Charts in the Tableau Dashboards of Rippleworx’s clients was very time consuming and the discovery of the ShowMeMore Extension proved to be a valuable solution for optimizing this process. It became a breeze to create Radar Chart, and they quickly became an essential component in their storytelling dashboards, offering a unique and visually impactful way to showcase data.
Real-World Impact with Sentiment Analysis
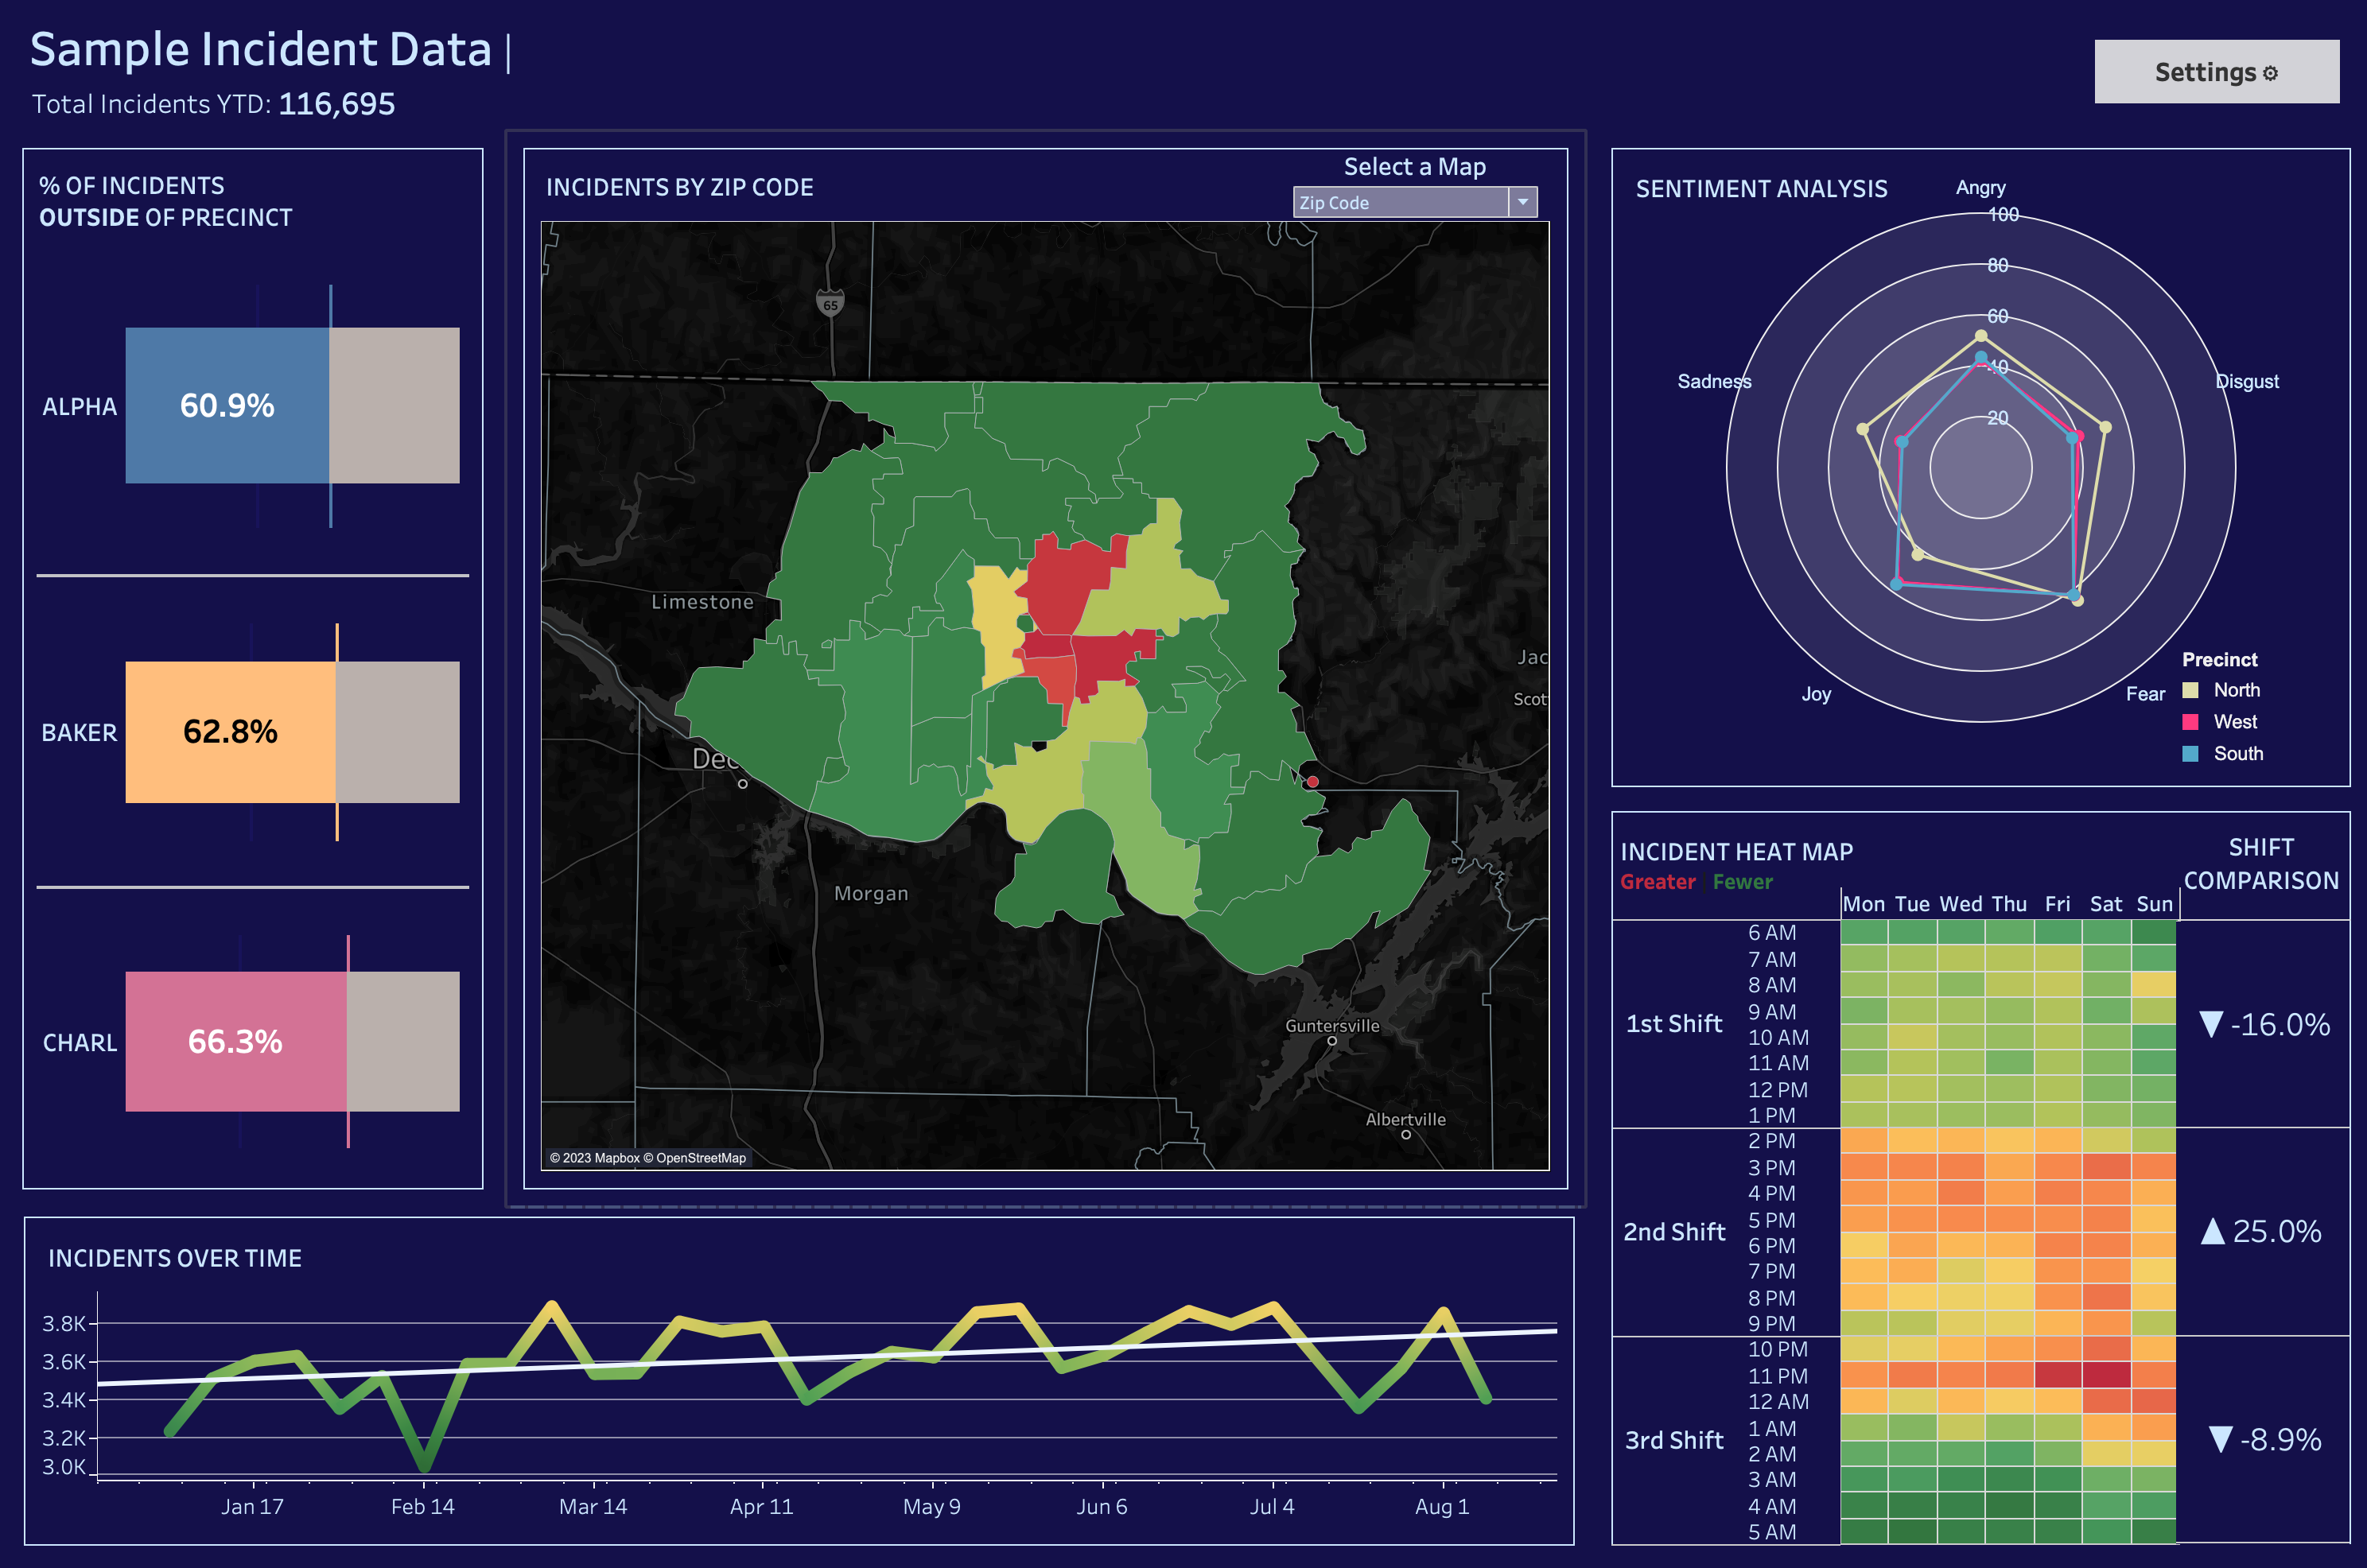
One of Rippleworx’s most impactful use cases involved a dashboard designed for a police department The dashboard included a sentiment analysis, tracking the emotional states of police officers over time using a Radar Chart. This dashboard served as a powerful tool not only within the police department but also as a showcase at various trade shows and conventions. Rippleworx’s commitment to using cutting-edge Extensions from Apps for Tableau helped them stand out and demonstrate their capabilities to potential clients and partners.
Sample dashboard with sample data:
A Seamless Experience: Customer Success at its best
The experience with Apps for Tableau went beyond the Extensions themselves. They praised the customer support and installation process, highlighting how smooth and straightforward it had been. The product’s positive impact combined with the outstanding customer success journey, empowered Rippleworx to transform data into insights which leads to informed decisions and continued growth. They are eagerly exploring more Extensions, highlighting Rippleworx commitment to staying at the forefront of data-driven innovation.