Your starting point in Tableau.
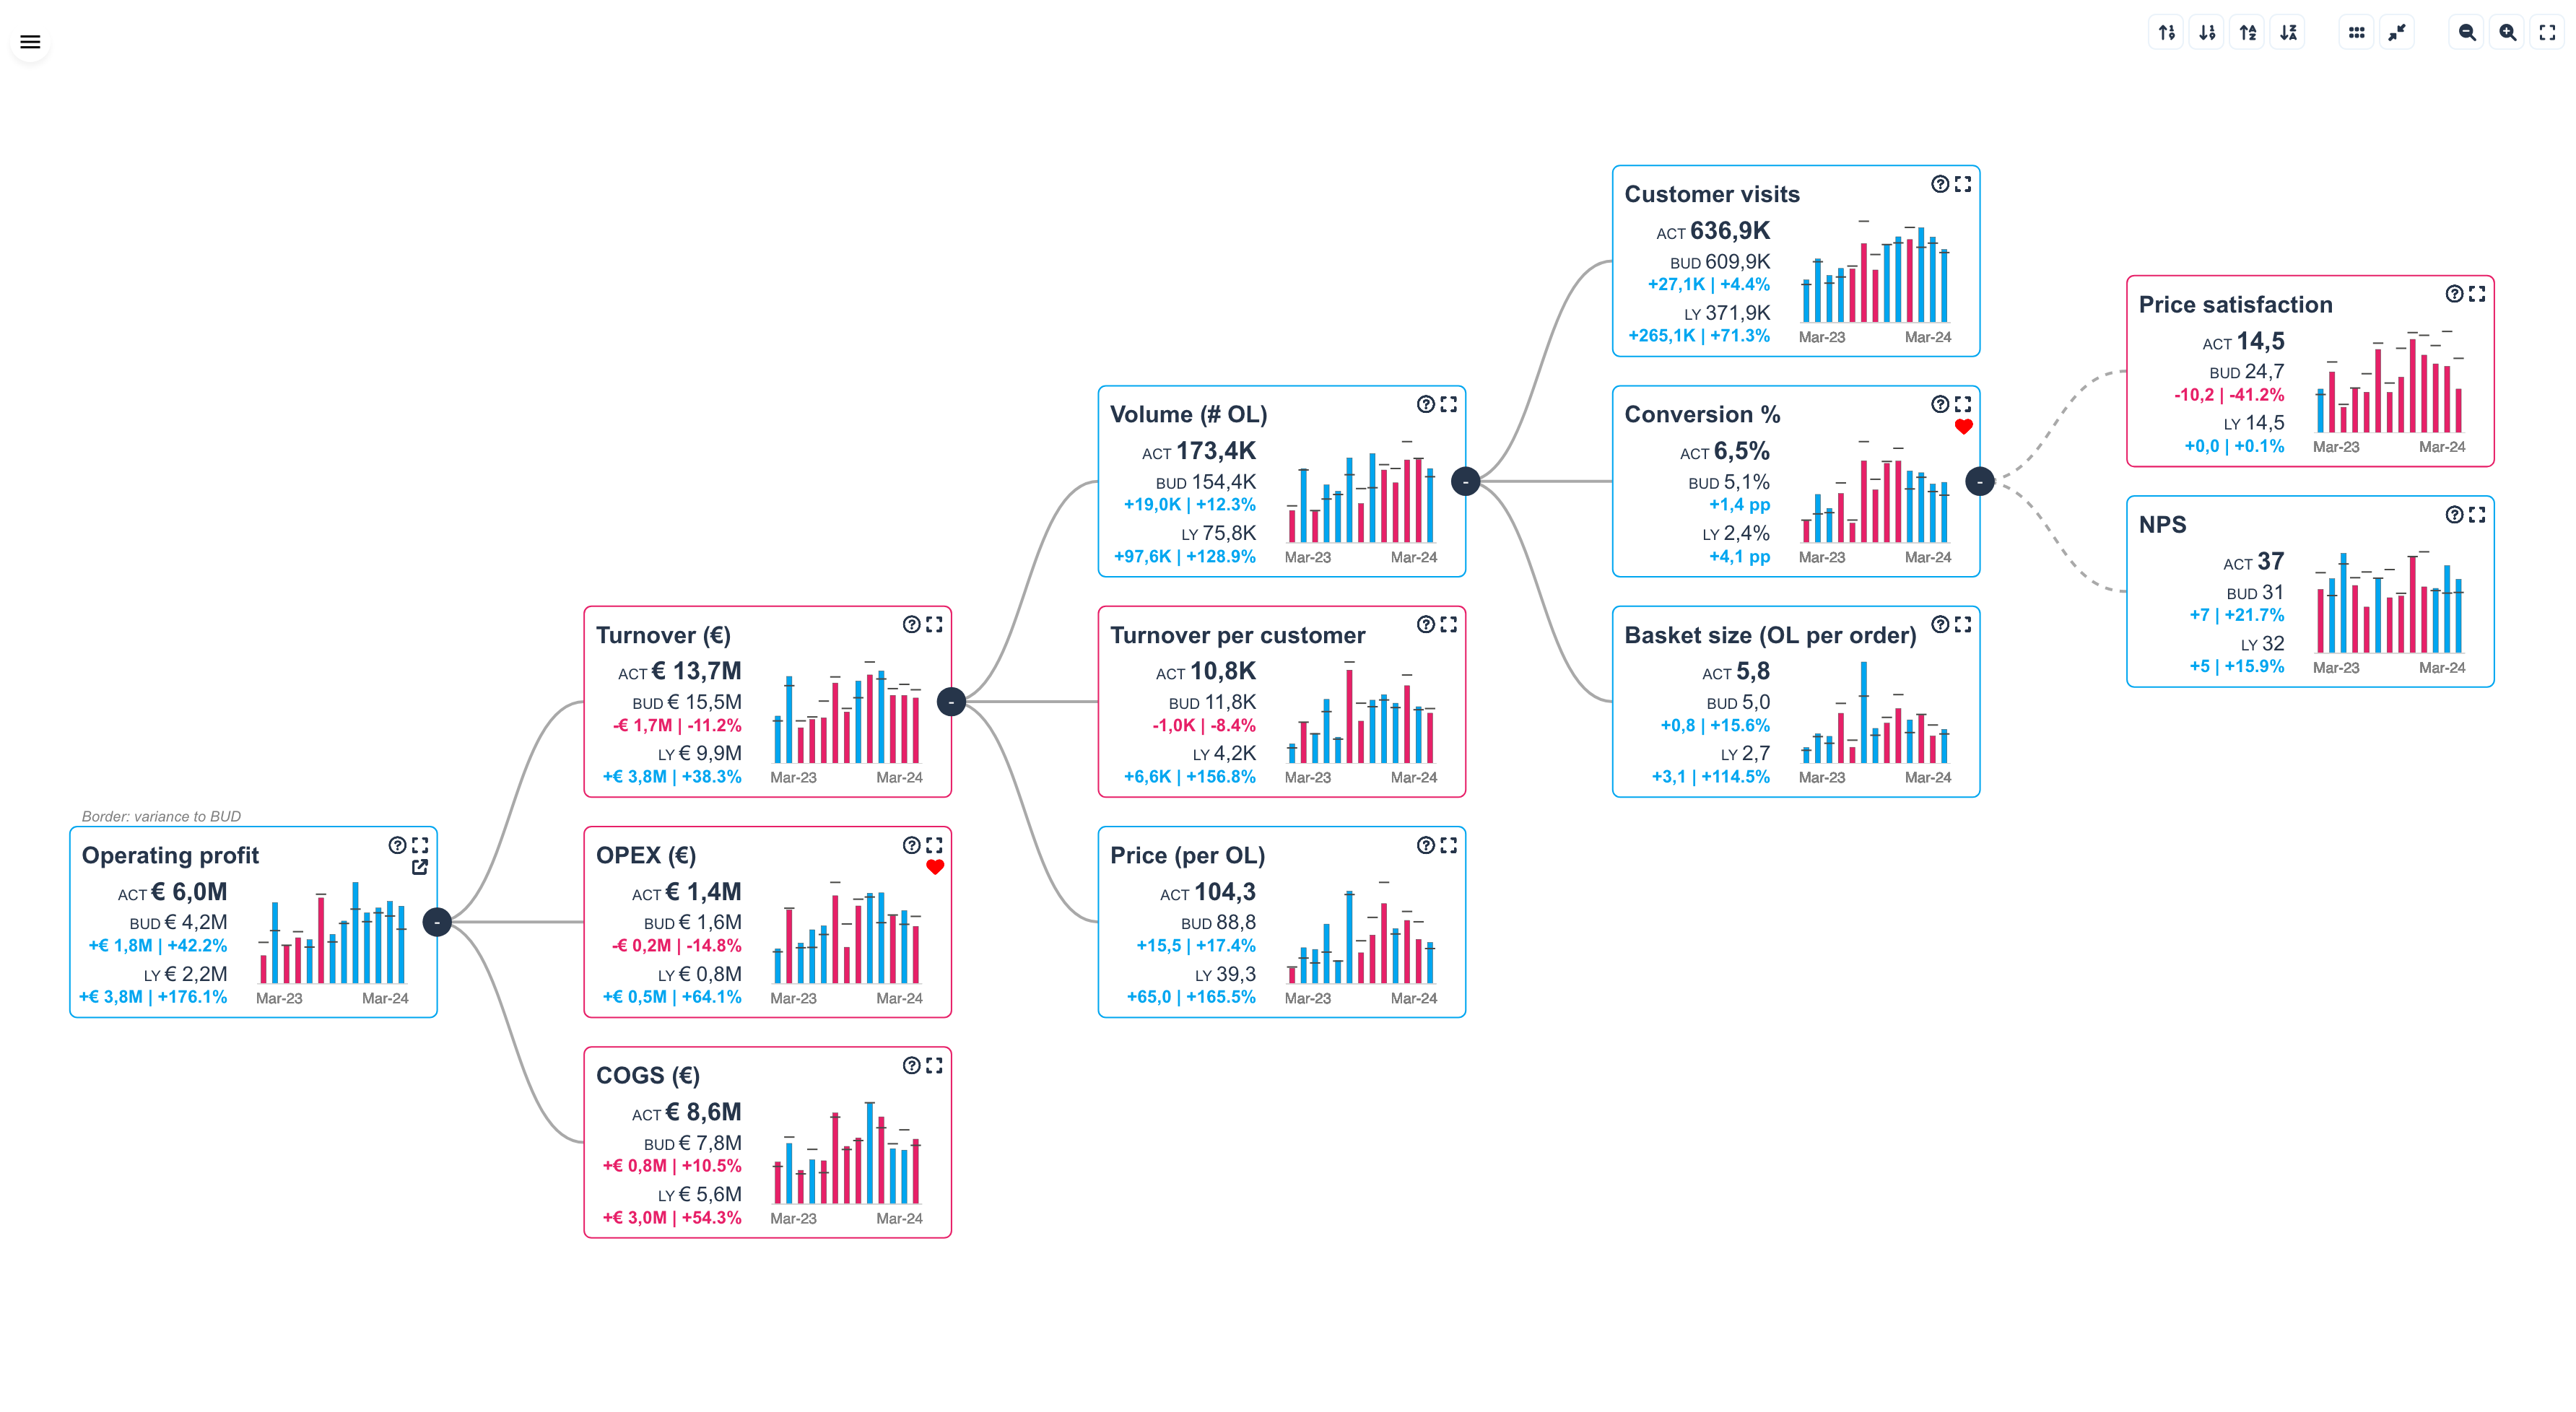
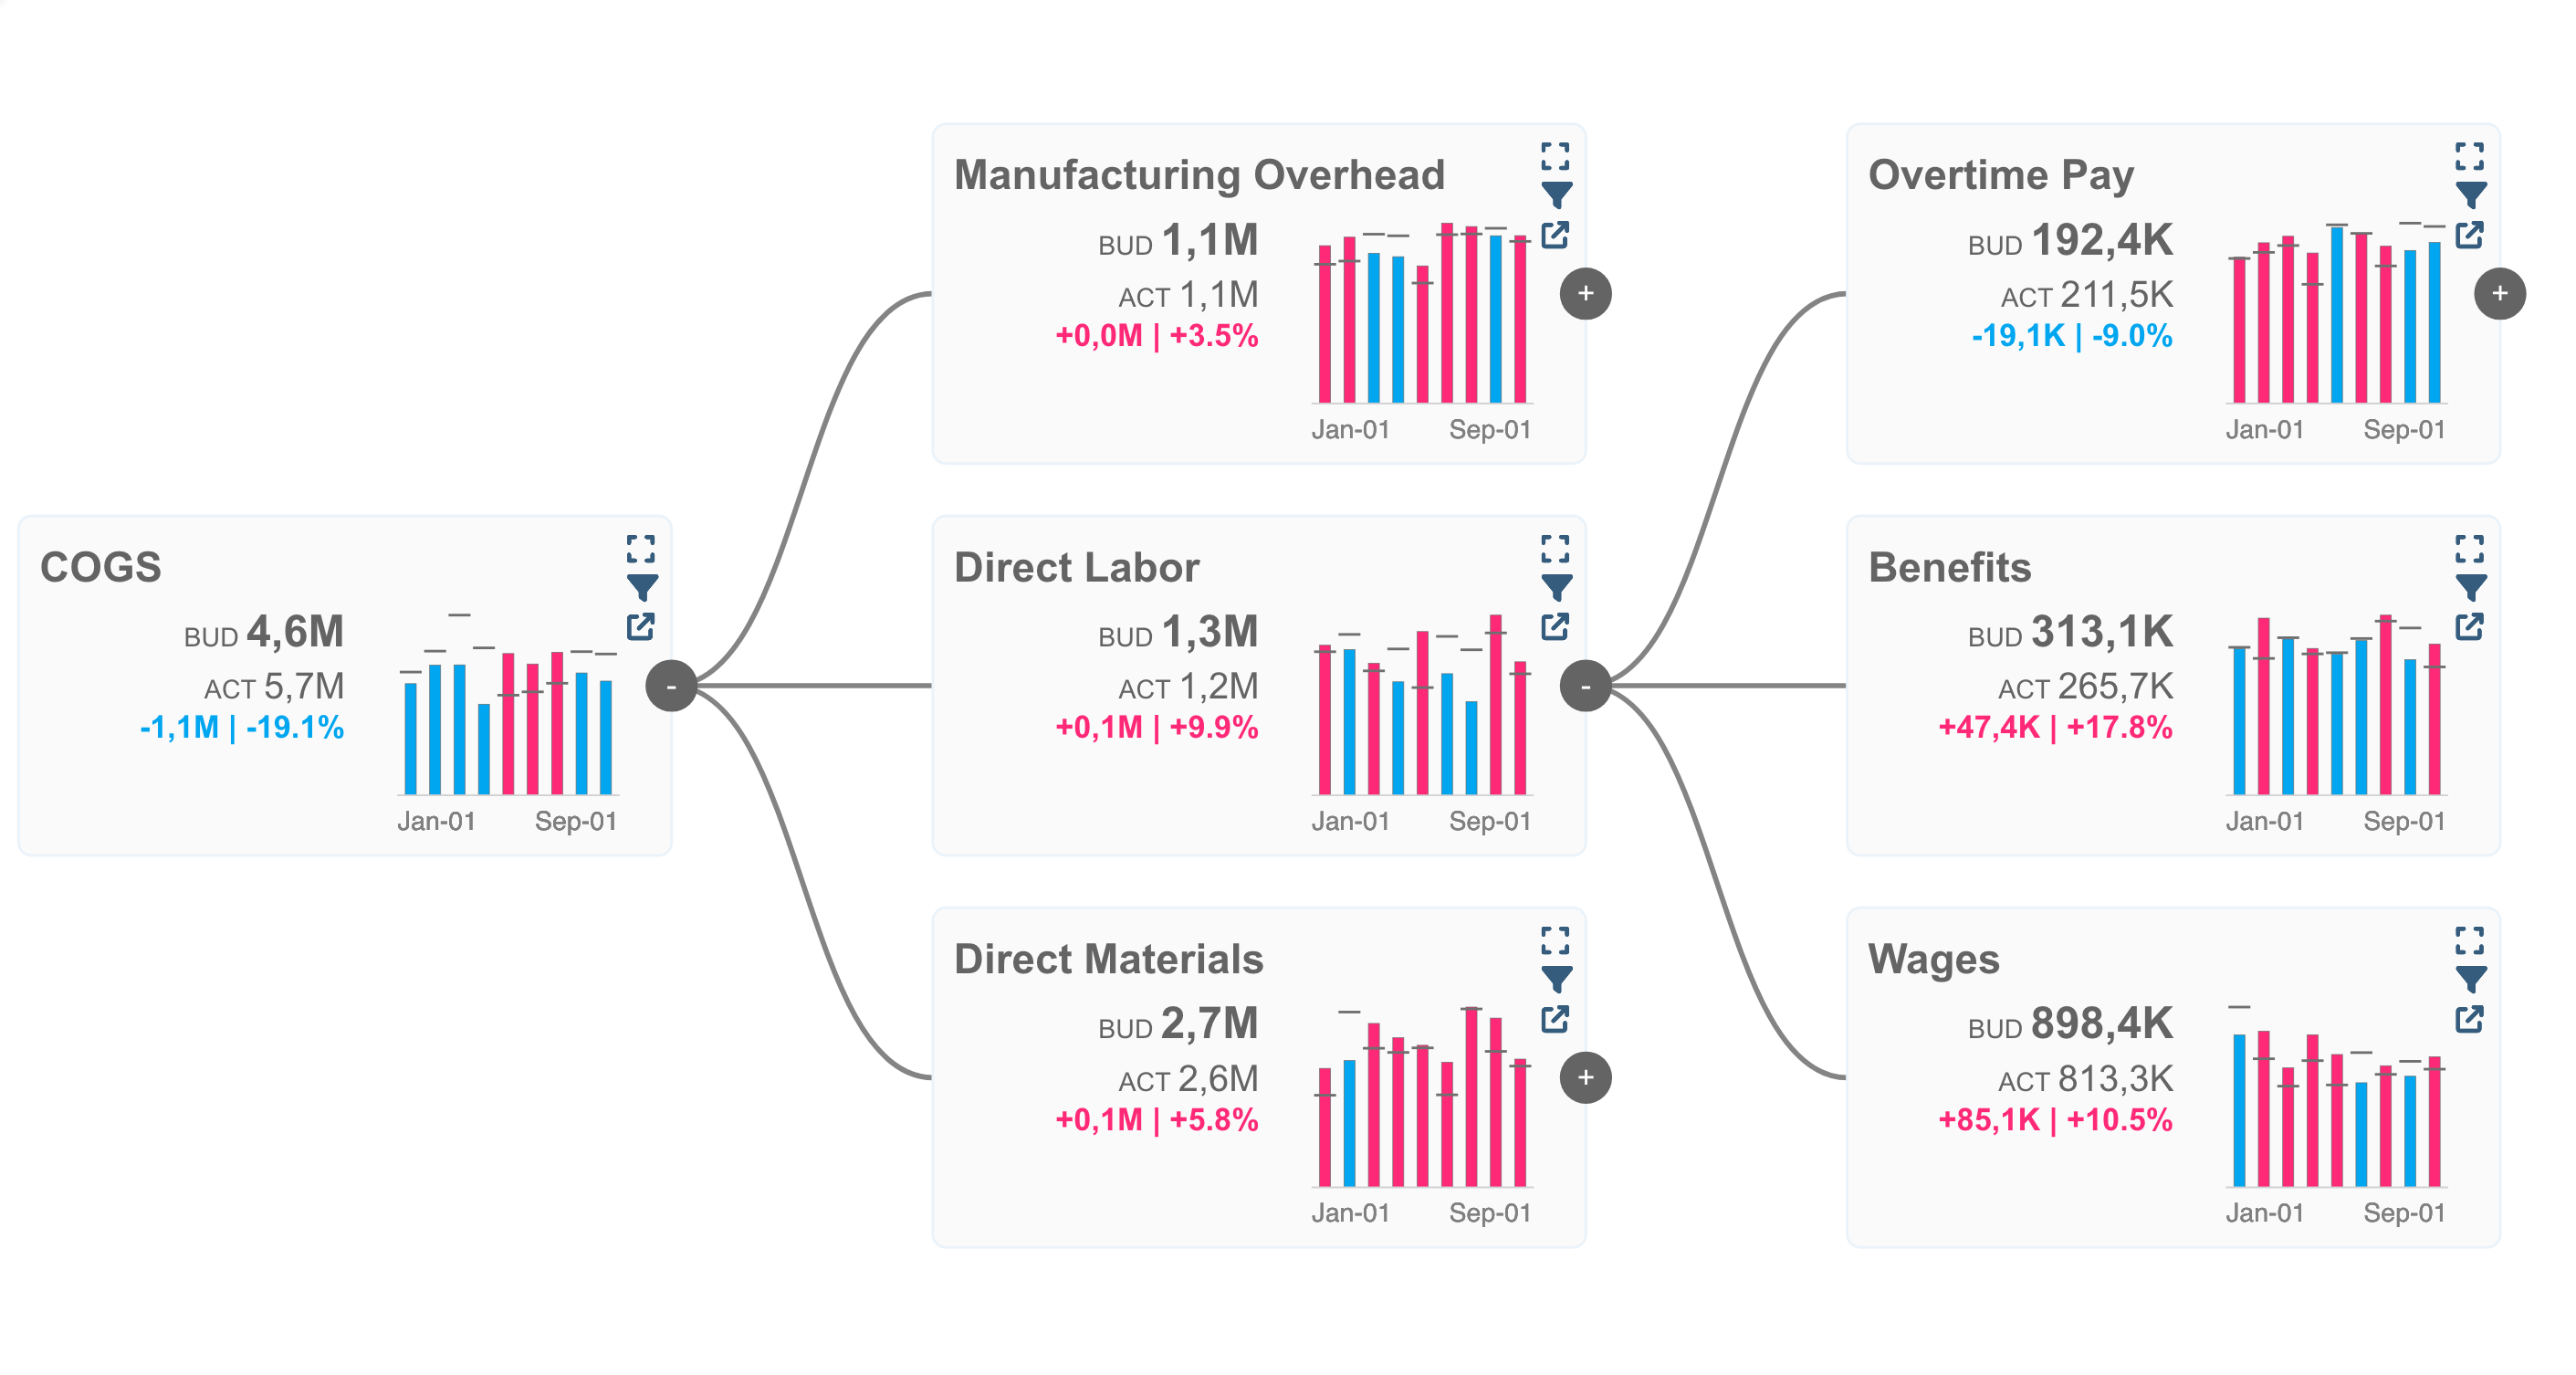
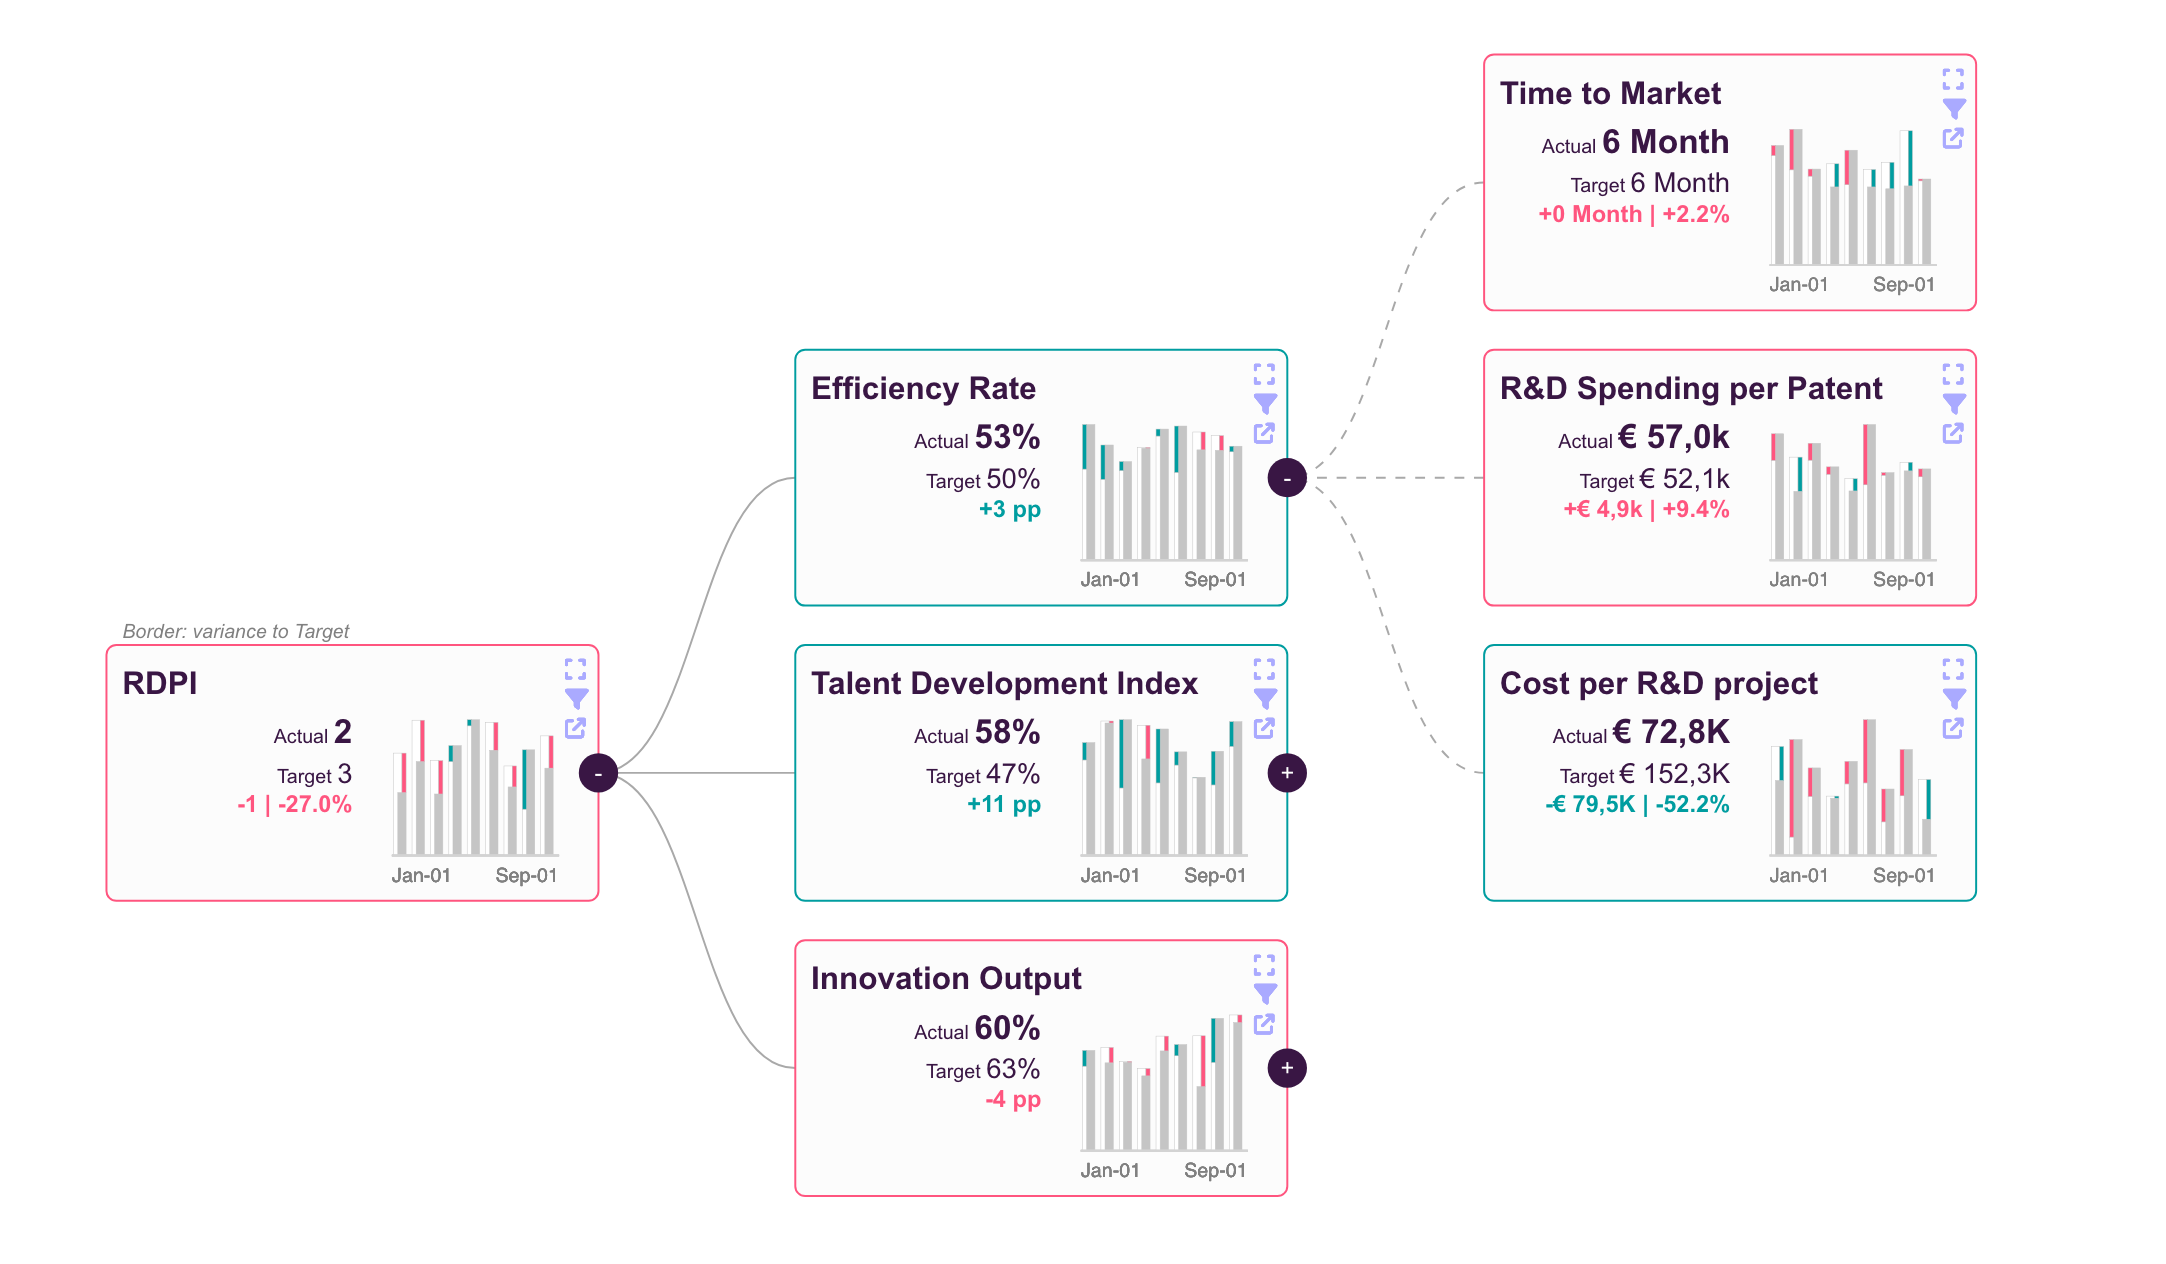
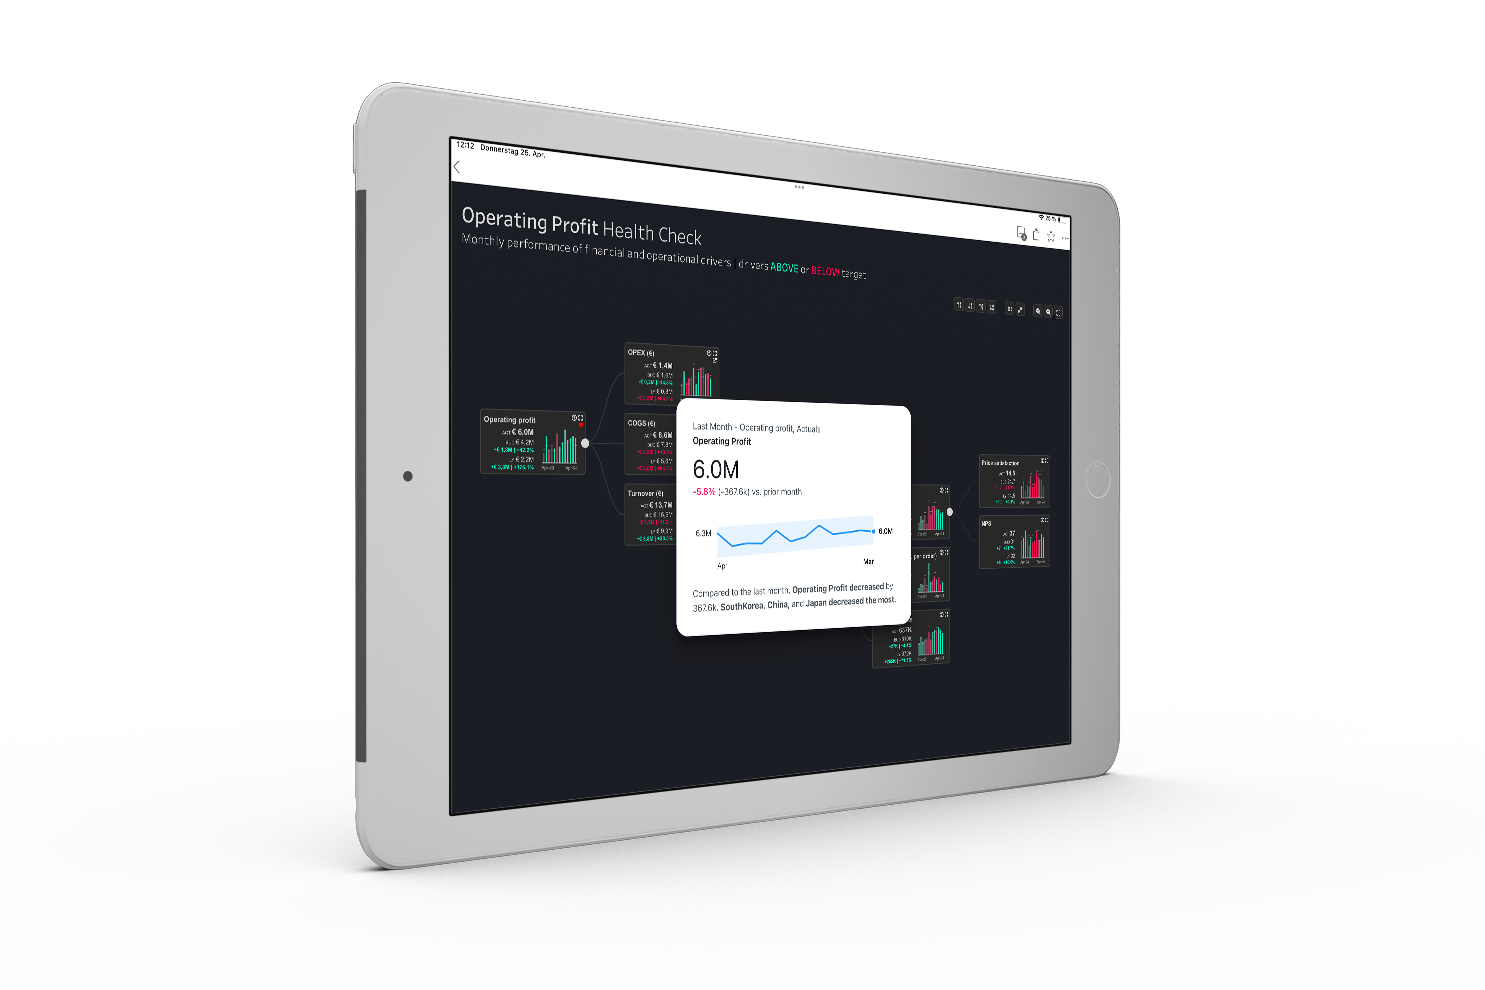
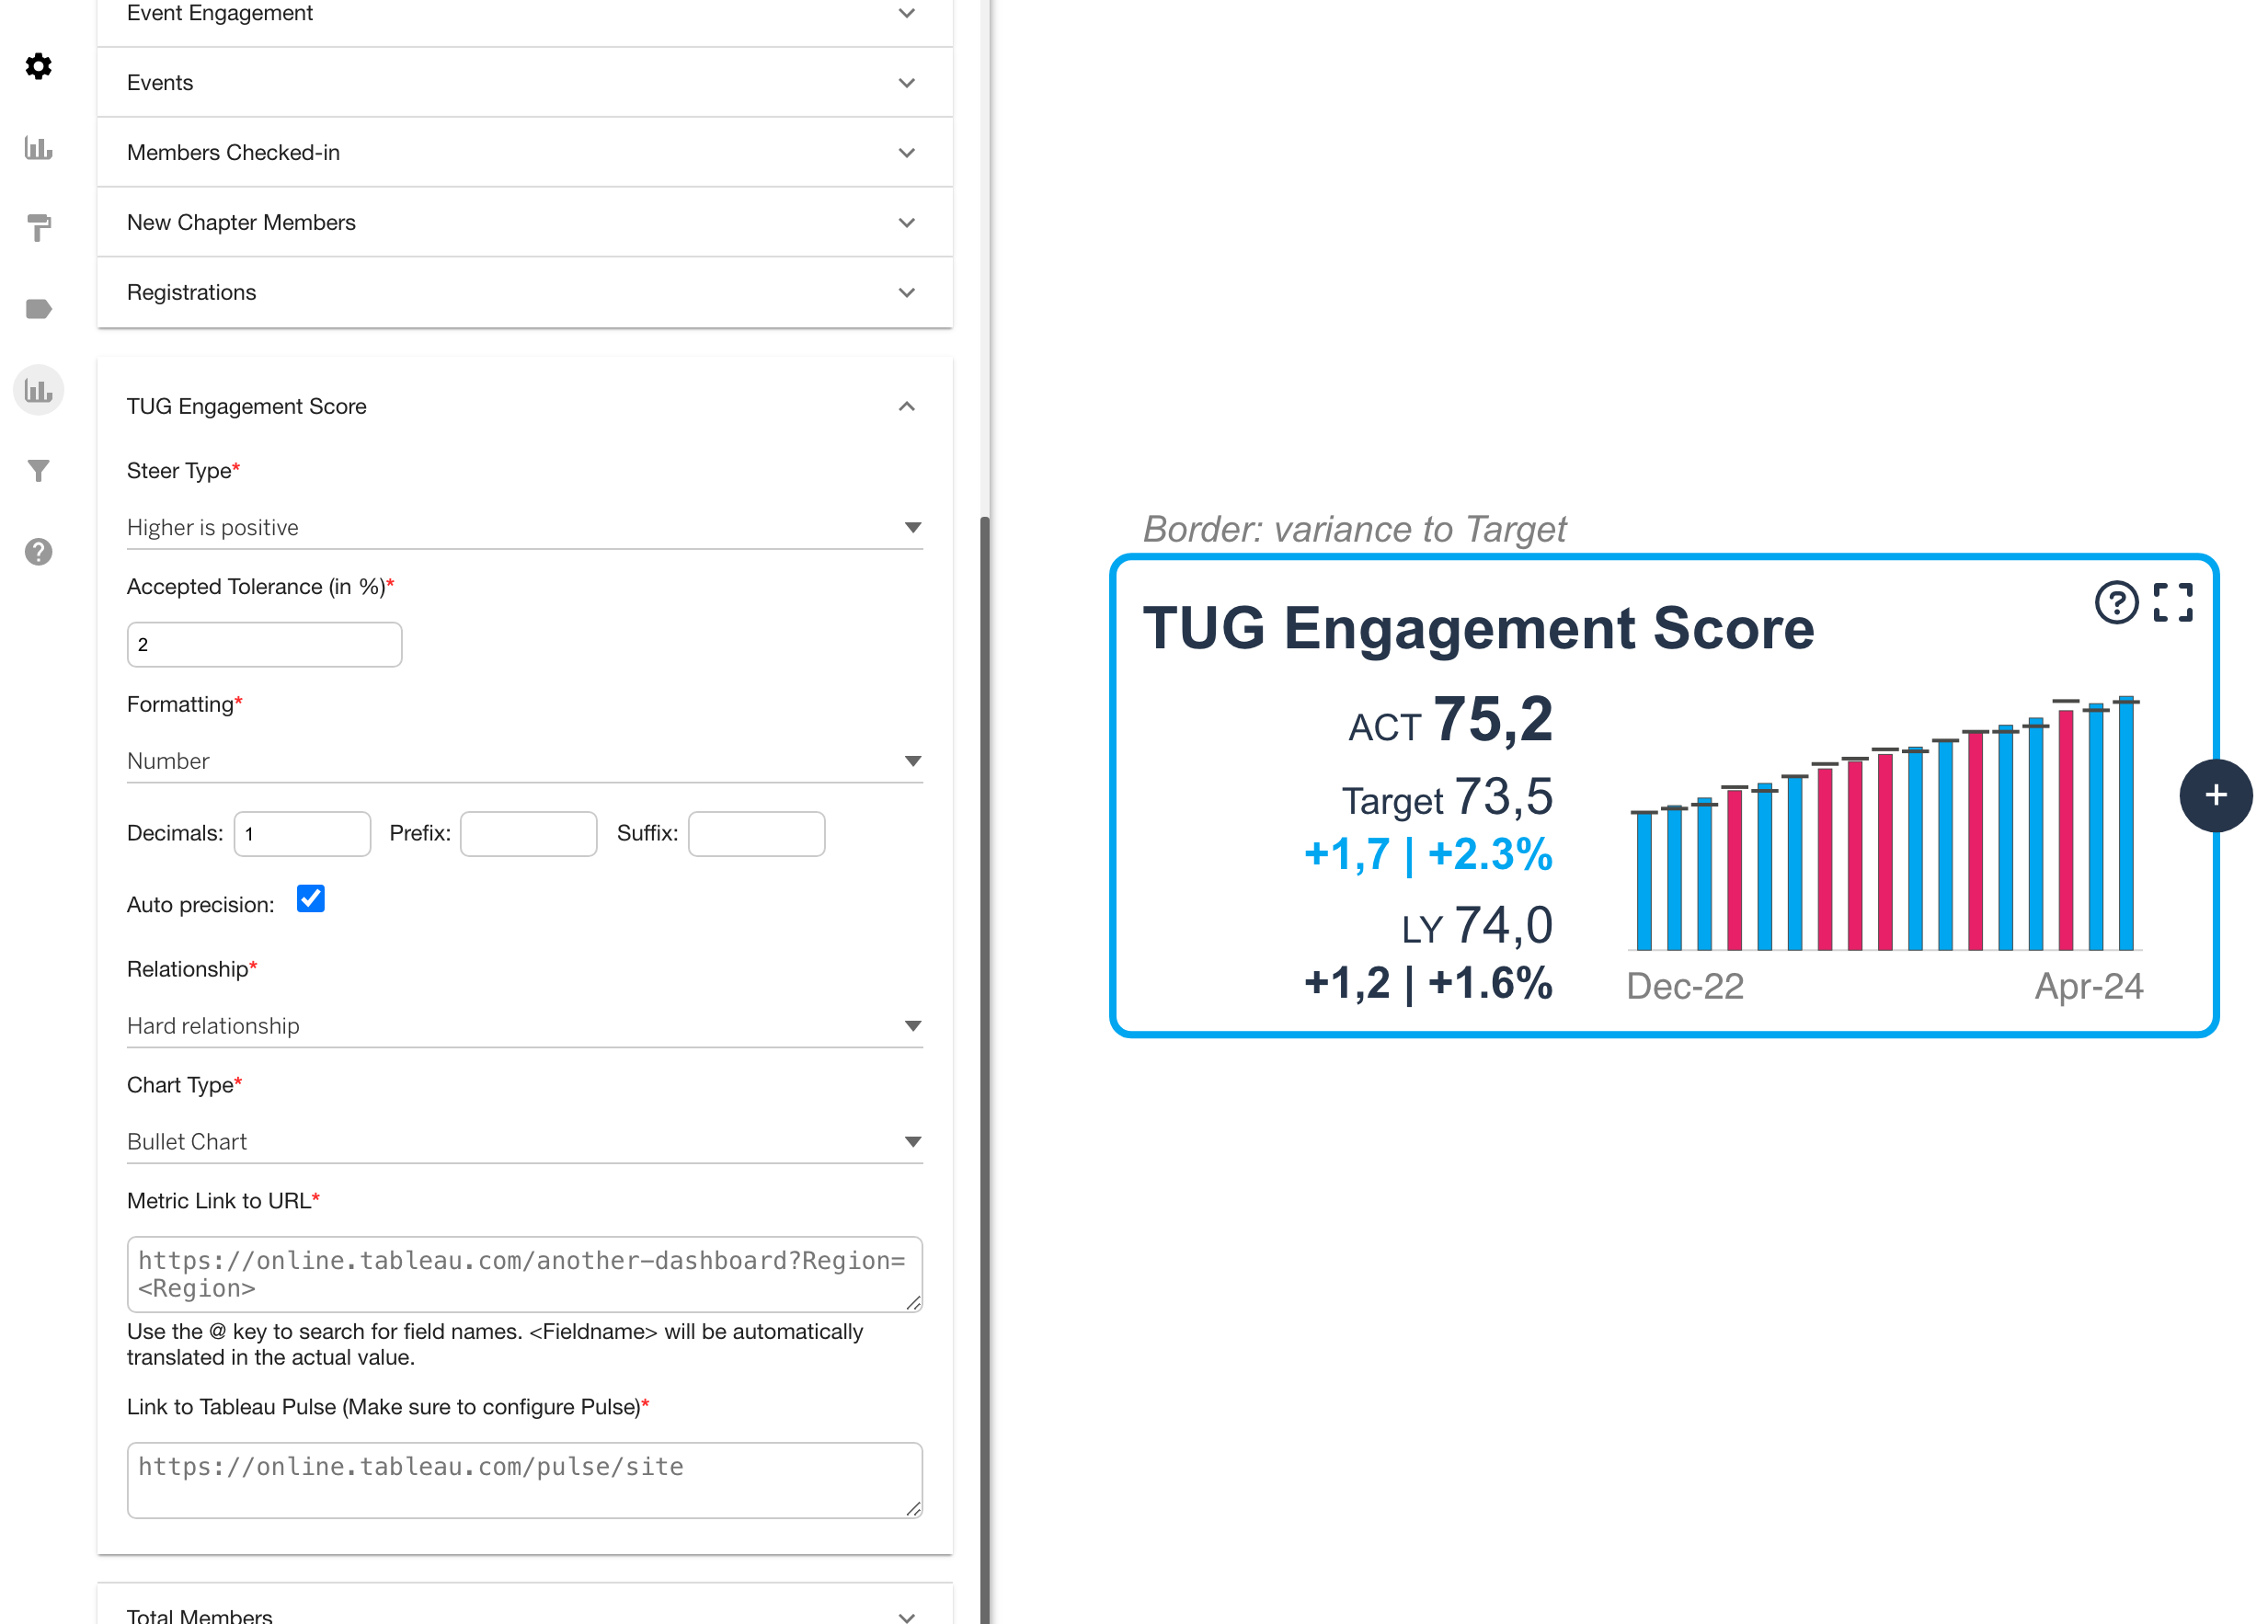
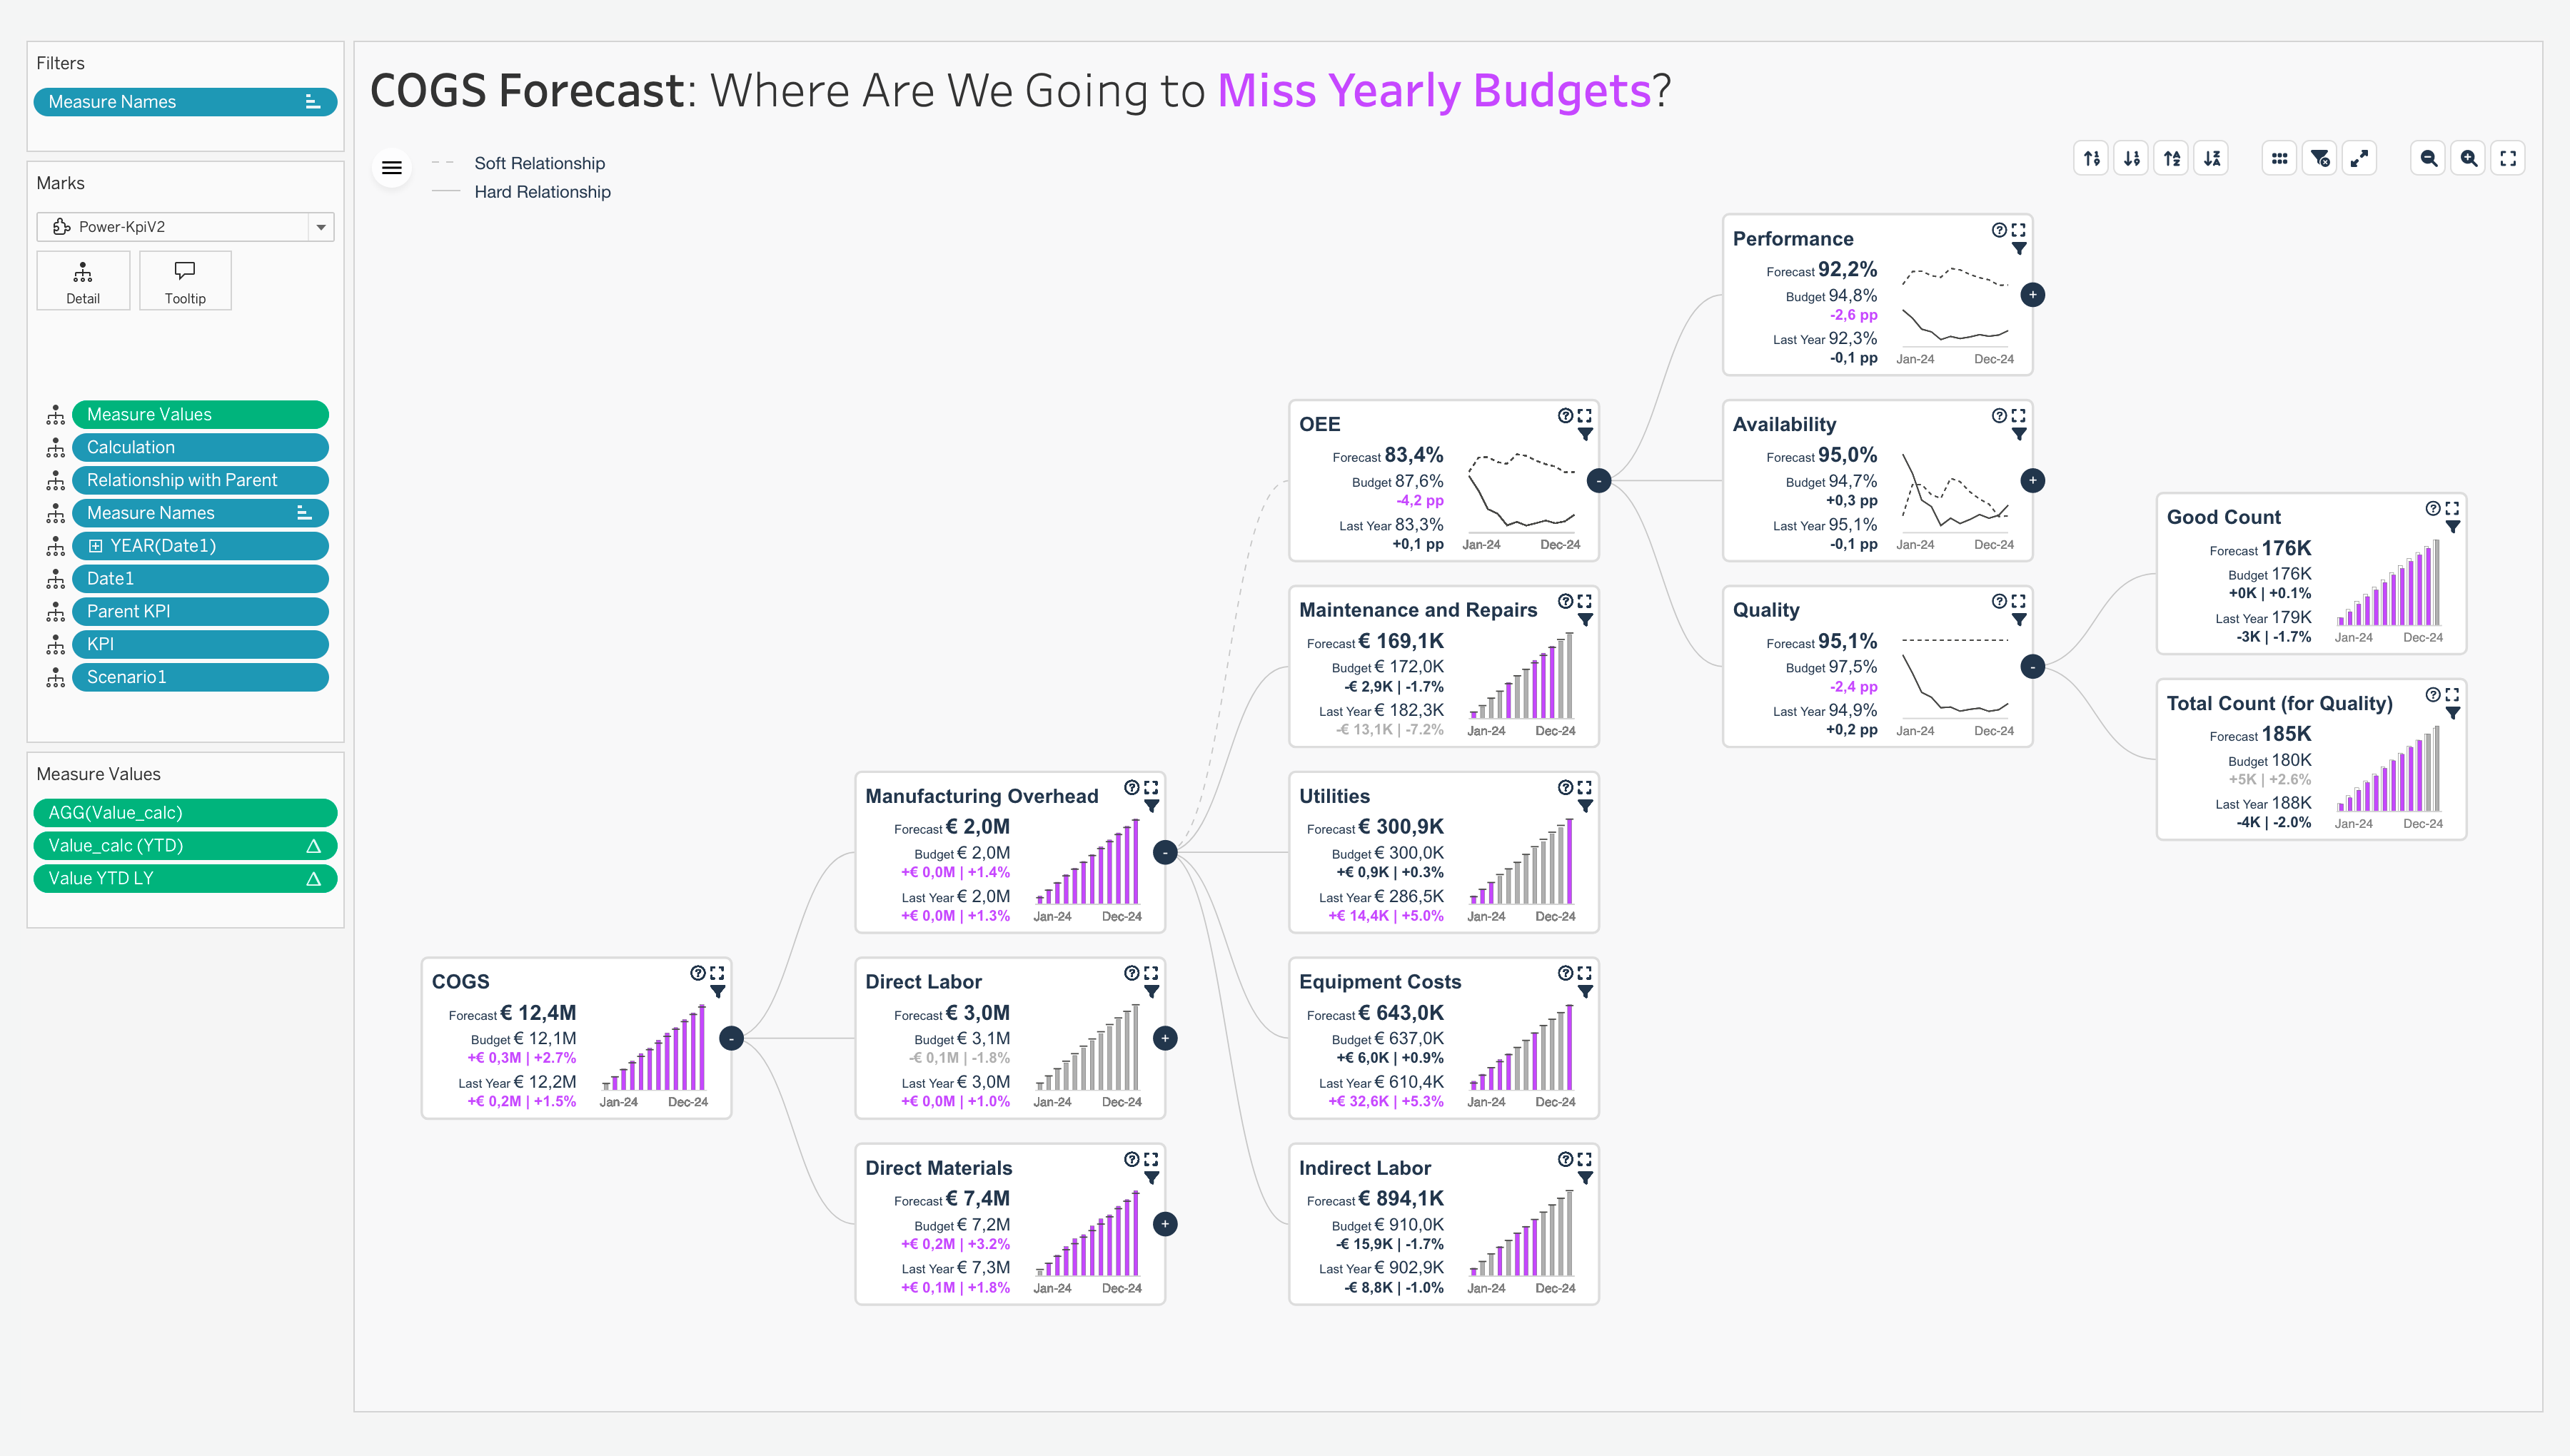
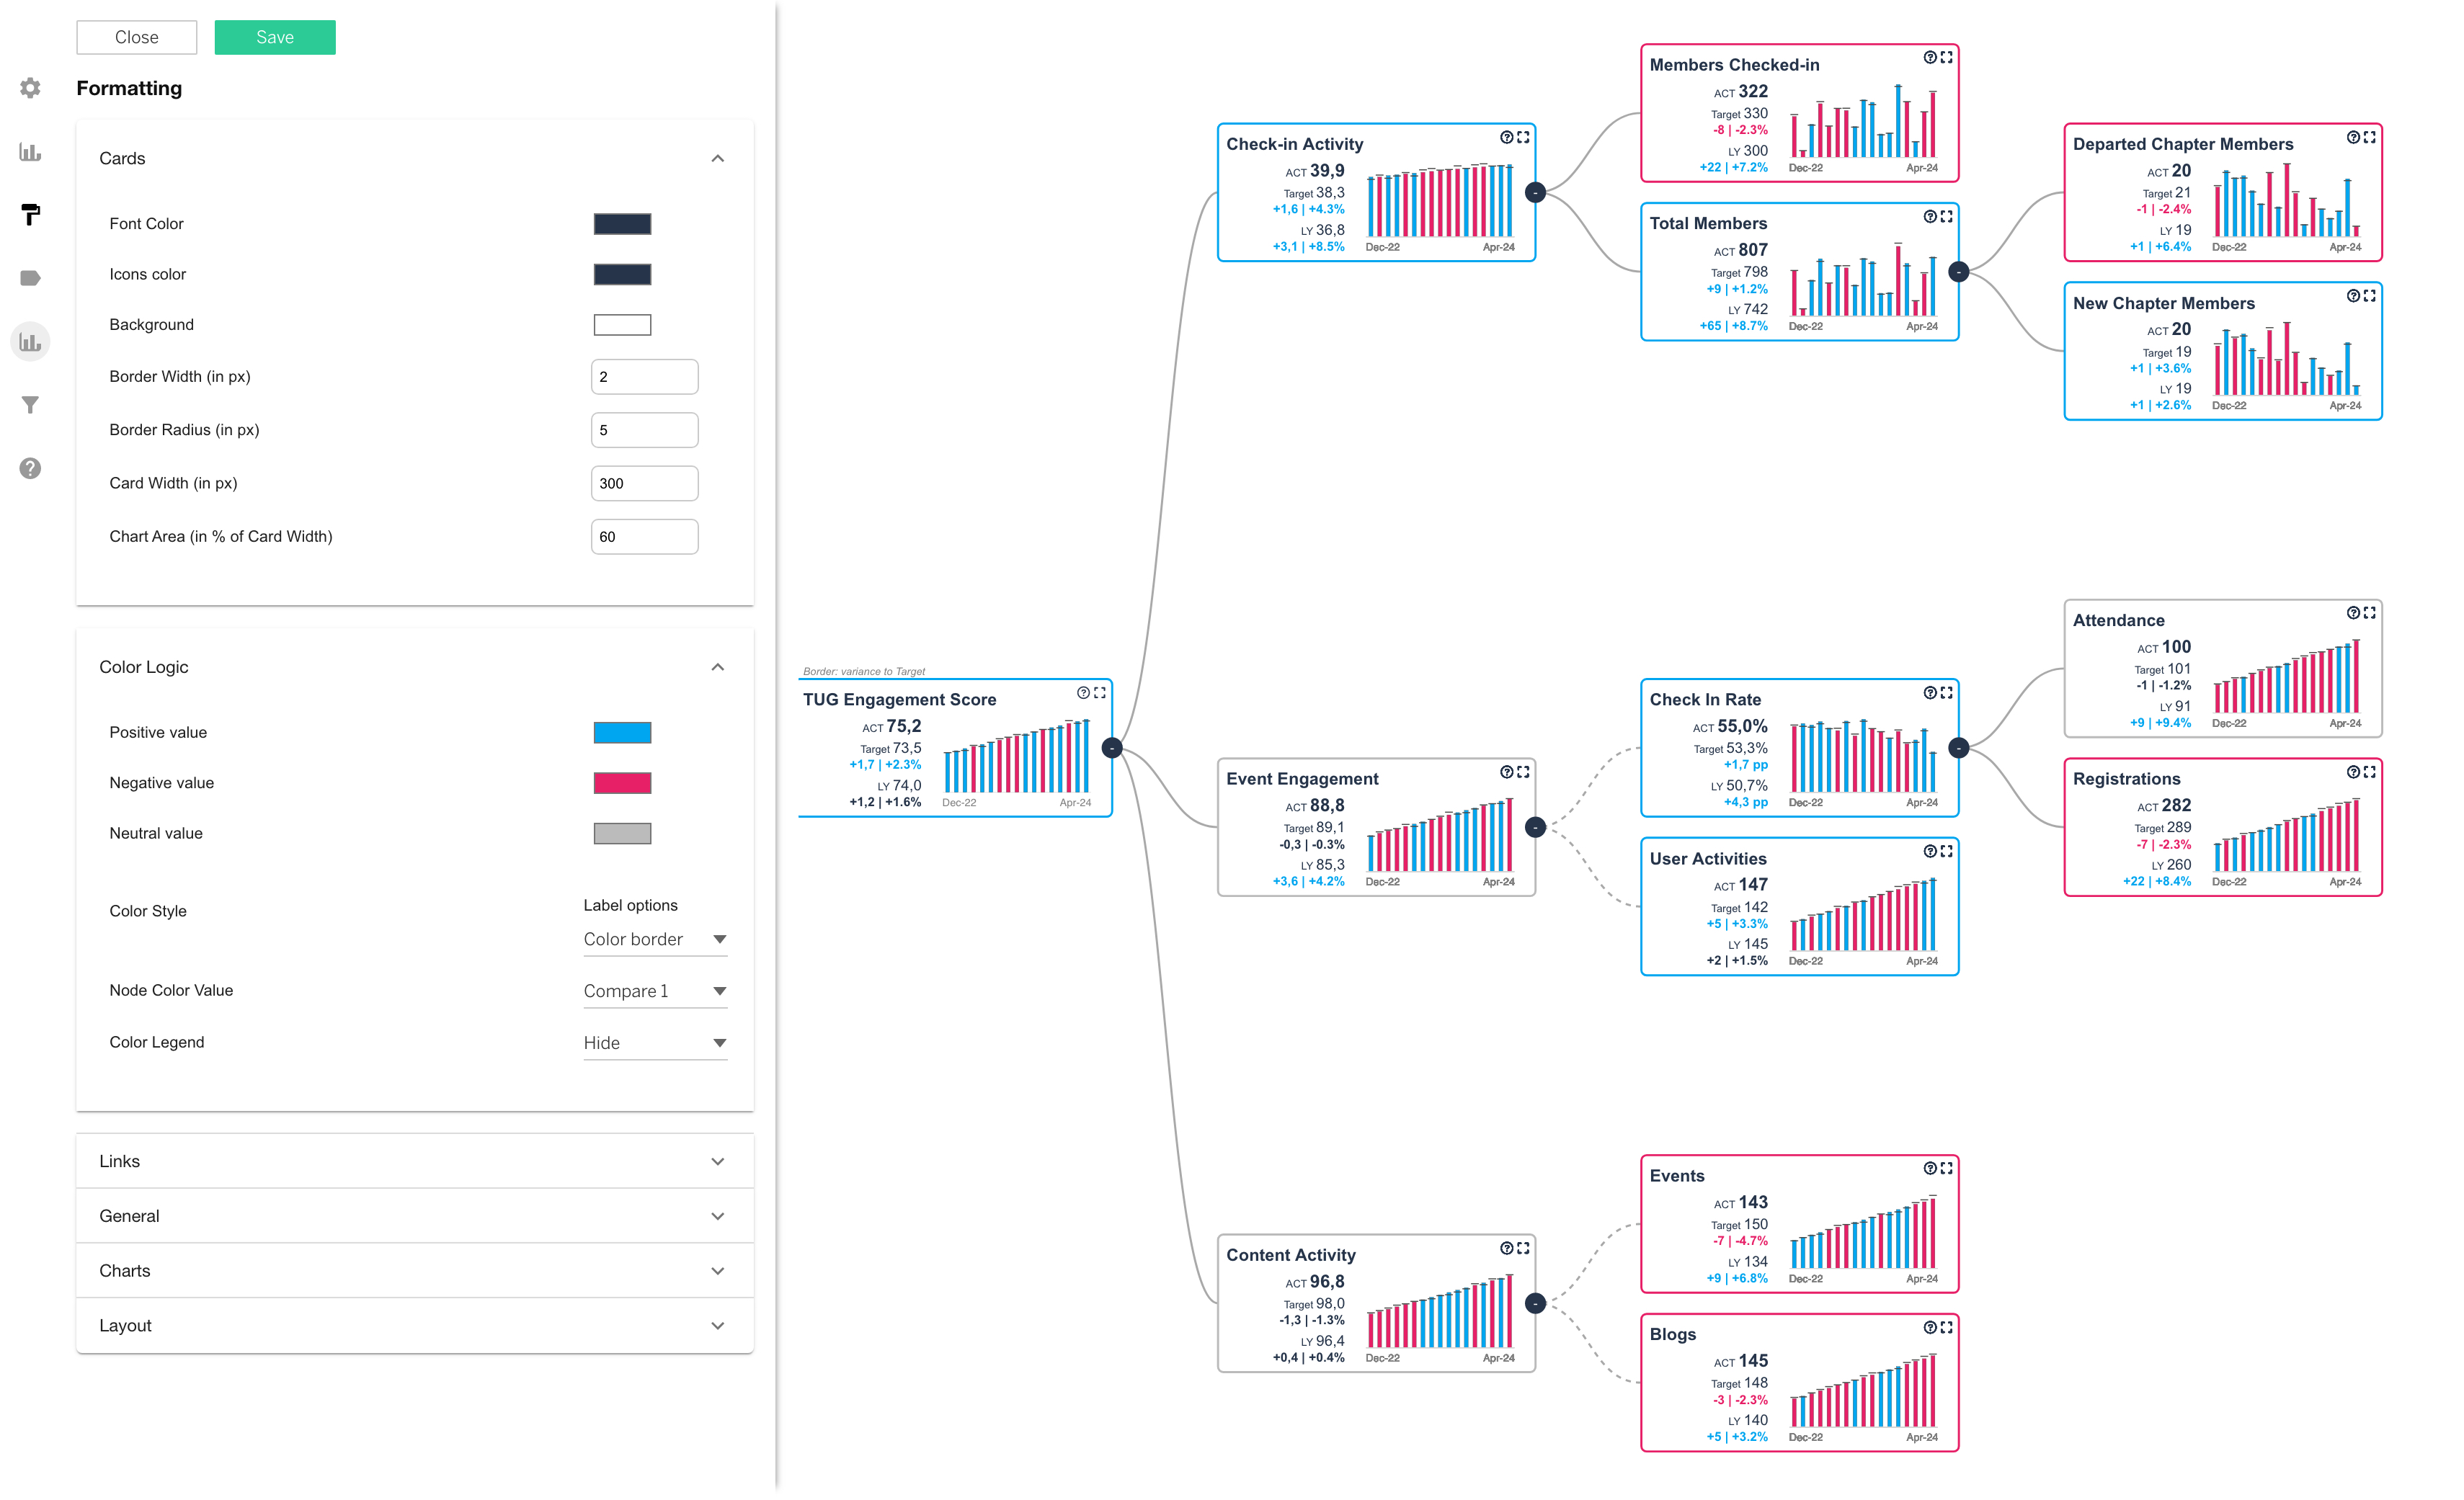
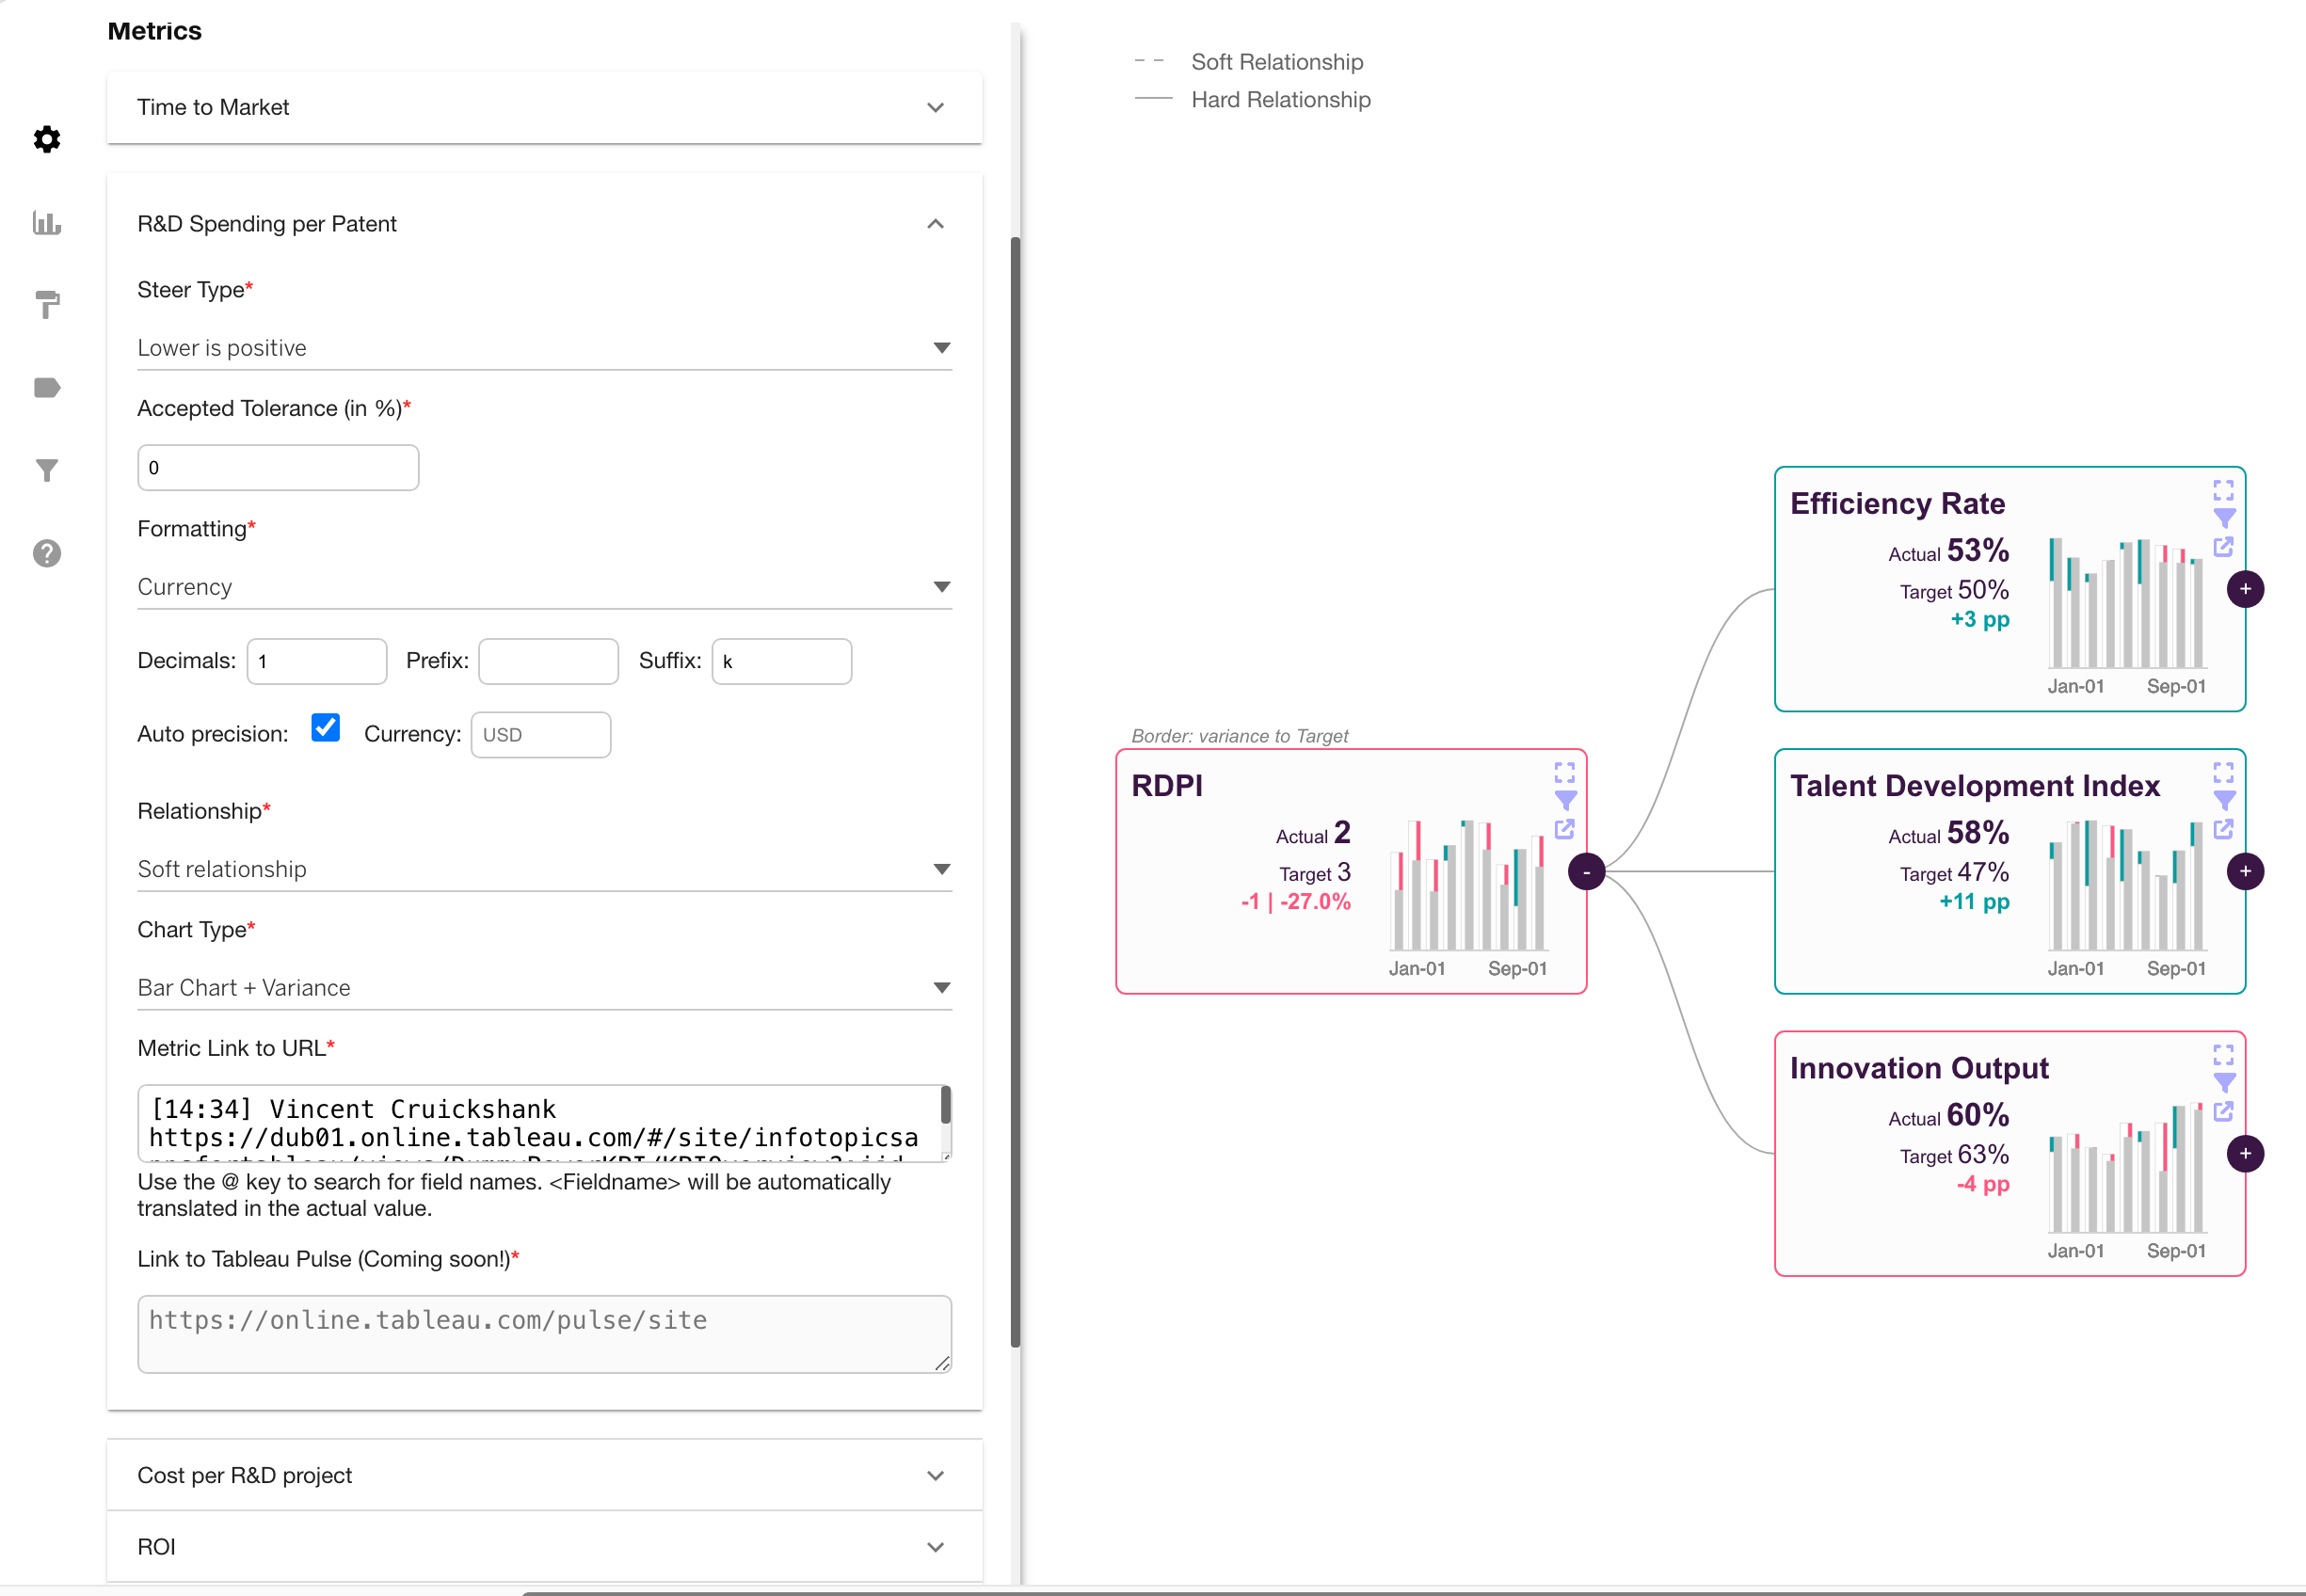
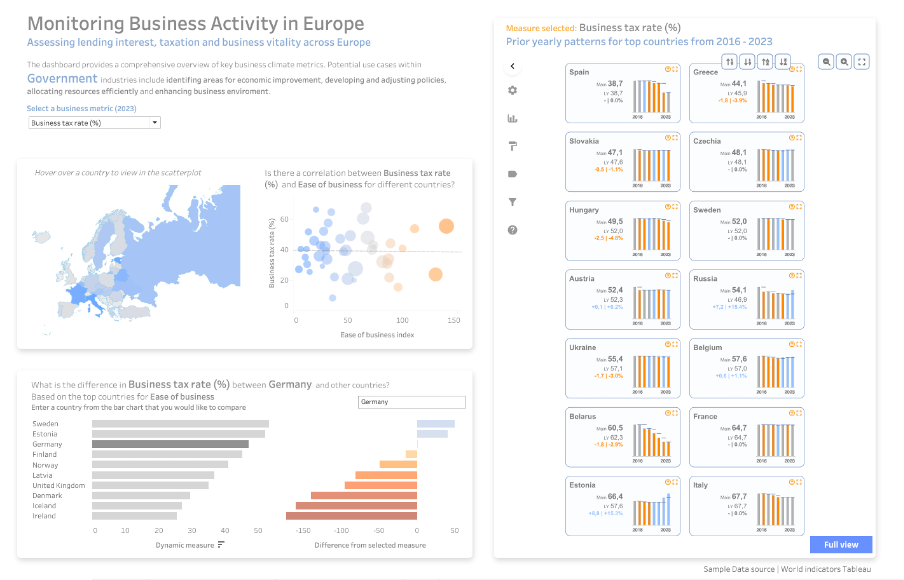
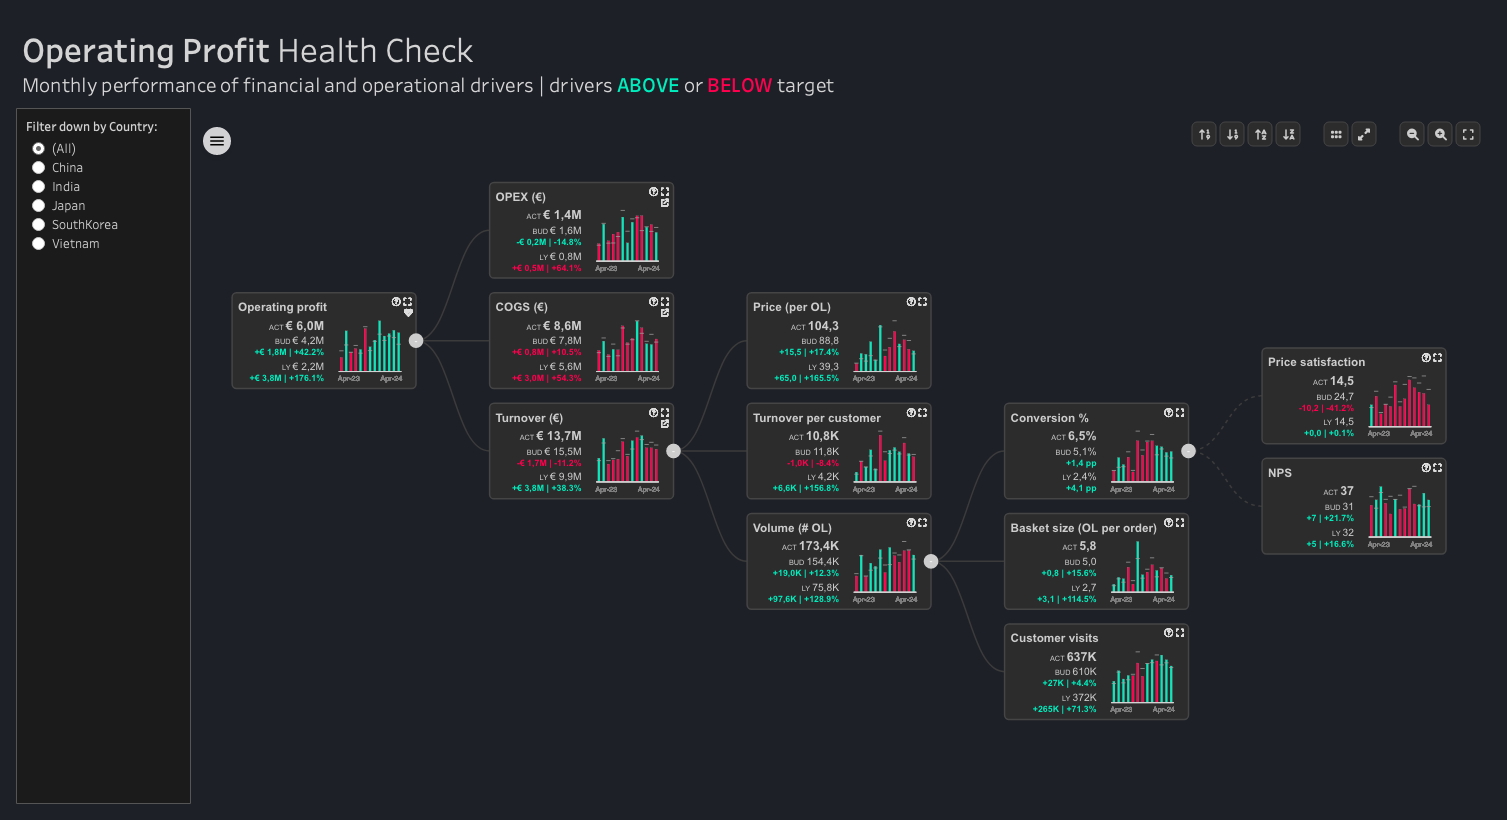
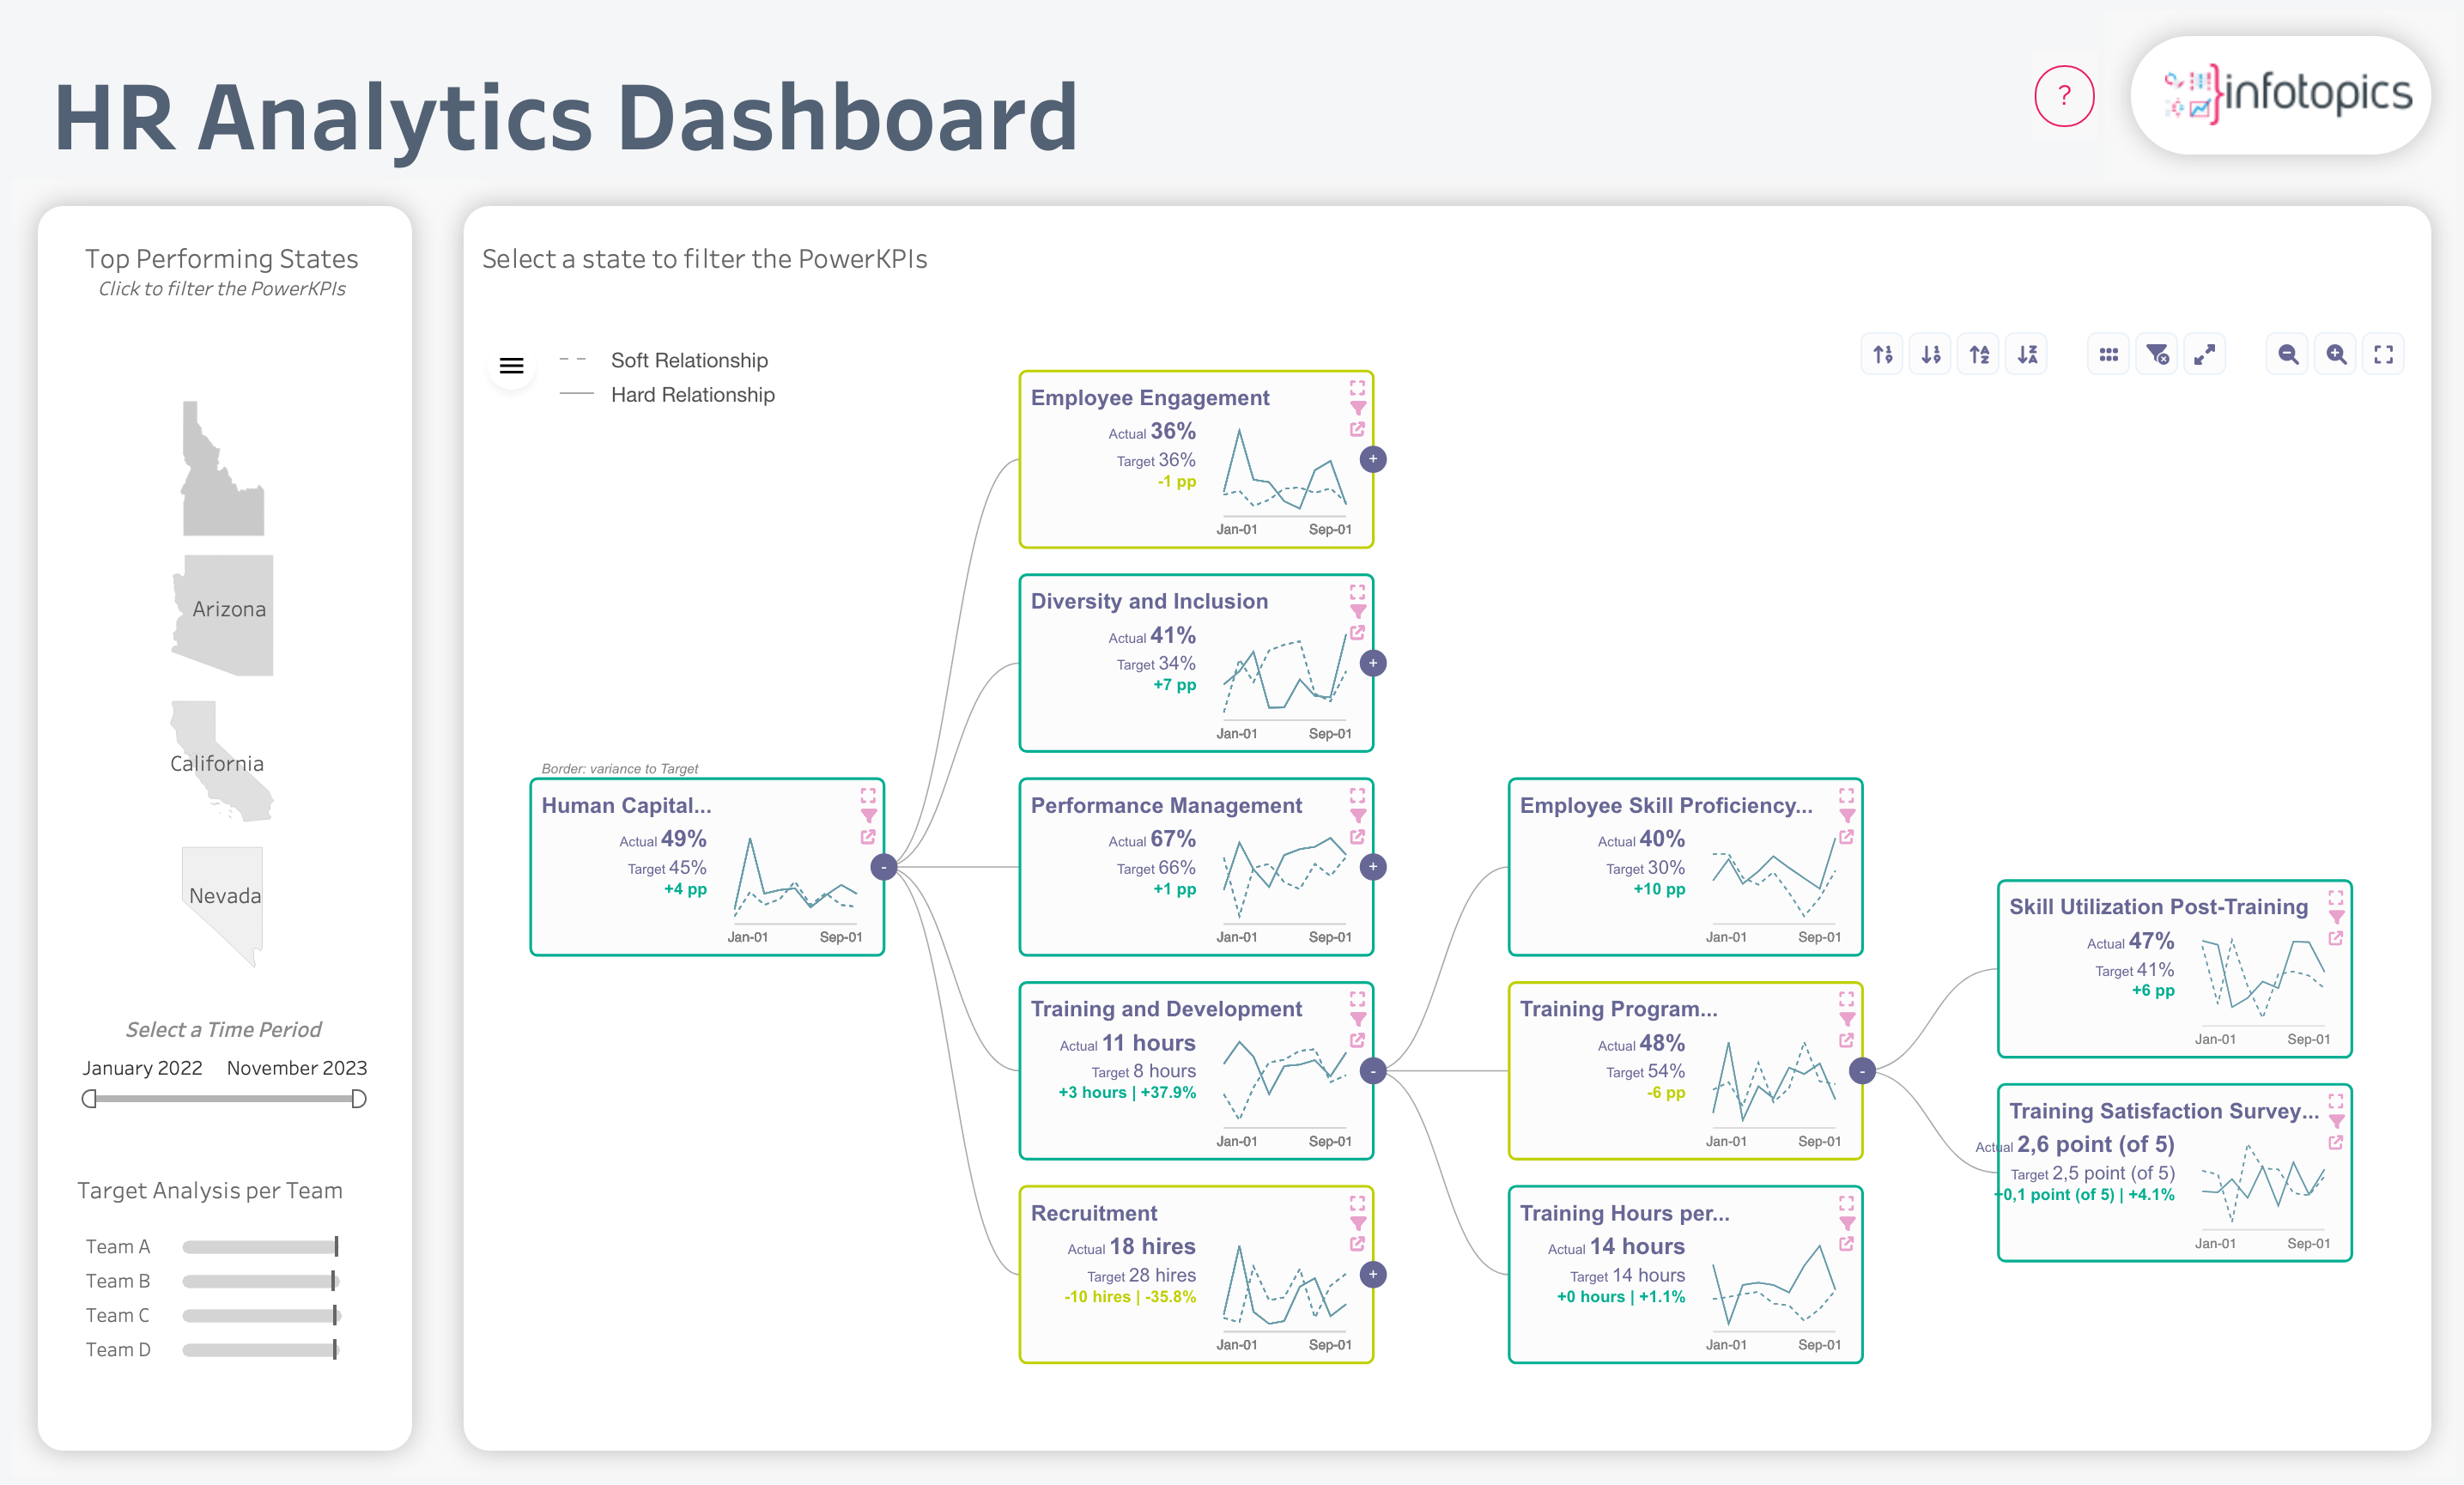
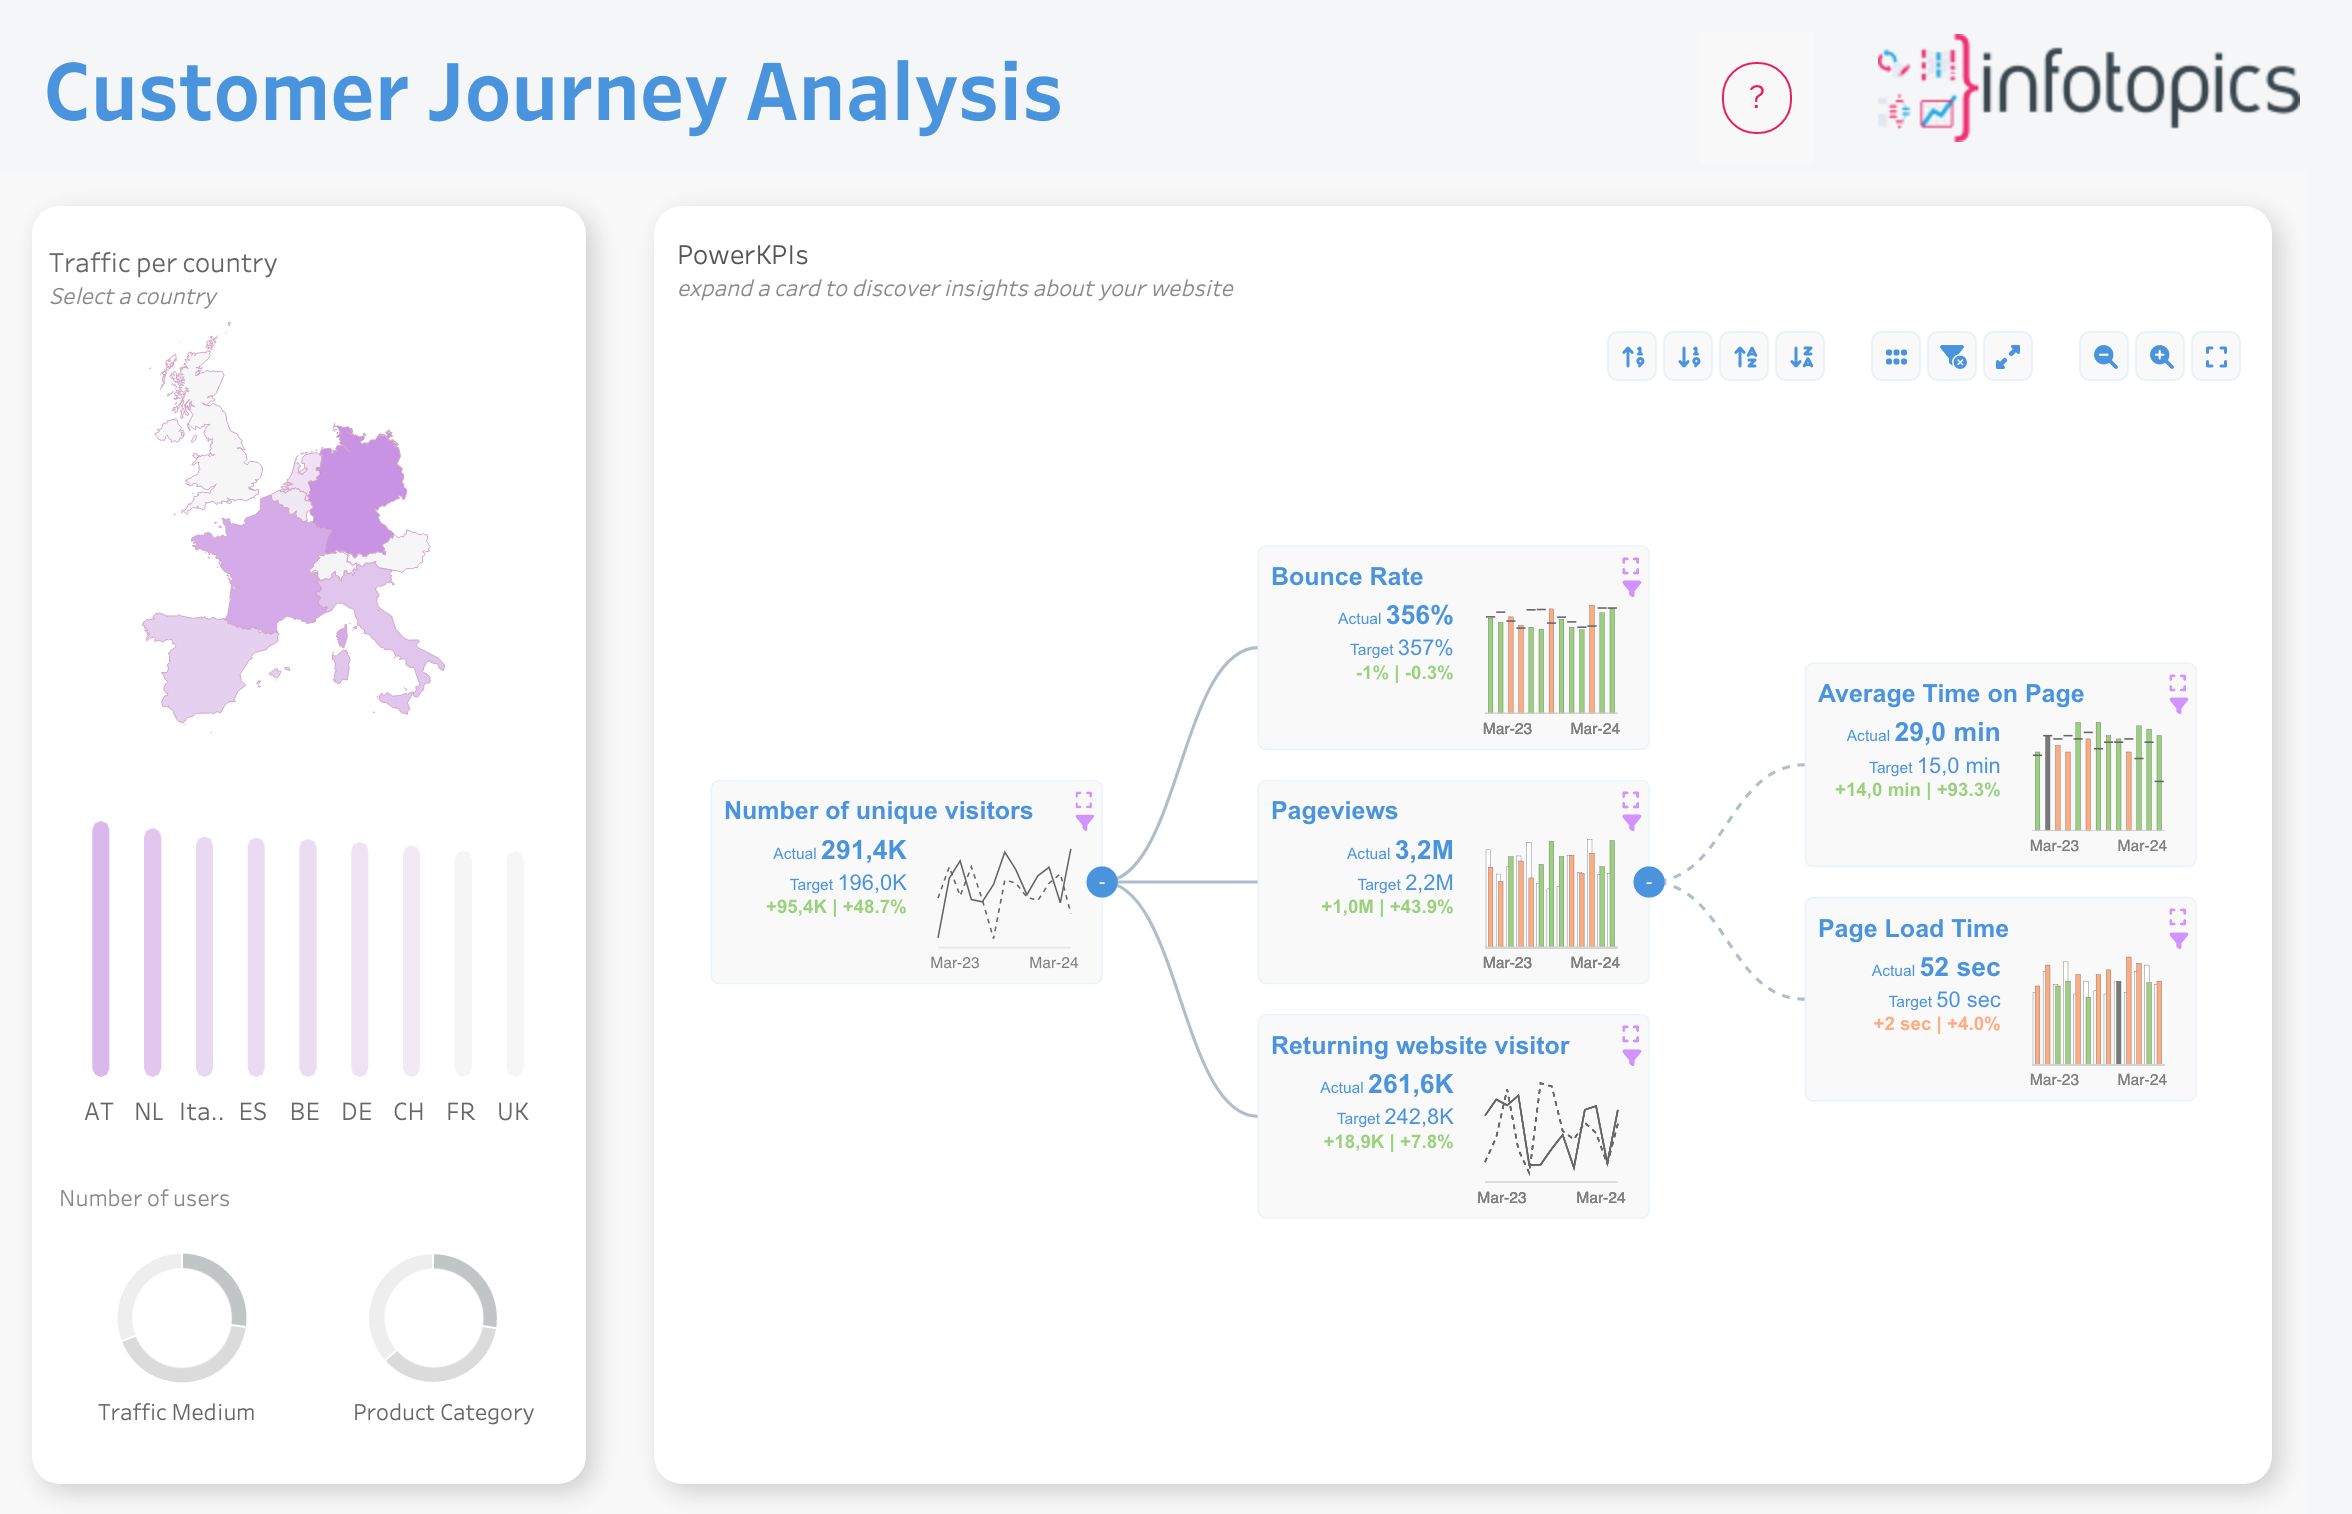
Use PowerKPIs as your new central entry point for Tableau analysis. It illustrates the connections between KPIs in an interactive value driver tree and KPI cards, seamlessly integrating with Tableau Pulse! Easy to set up and maintain, PowerKPIs add context to data-driven decisions.
Also available as Viz Extensions !
PowerKPIs: Mapping Operational Drivers to Financial Outcomes.
PowerKPI offers a comprehensive solution for understanding business performance by providing focused insights for specific analytical questions. From financial influences on operational profit to community management metrics, uncover the drivers behind your top-level KPIs. Quickly assess performance status, drill into data for deeper insights, and seamlessly transition to Tableau Pulse Metrics for actionable insights and optimized outcomes.

“The PowerKPIs Extension in Tableau revolutionizes our reporting, offering users both the ‘what’ and the ‘why’ behind our commerce KPIs in a visually engaging driver tree format.”
– Daan Vloedgraven, Kramp,
Business Analysis & Intelligence Manager
“Congratulations on creating a very easy-to-use, relevant template configurator in which the Tableau community will find much value. SuperKPIs allows you to create and maintain a wide range of KPIs with complete context, including time-series comparisons and conditional formatting for highly polished executive dashboards. Easy and fast.”
– Douglas Chope, Principal Solution Engineer at Tableau Software, a Salesforce Company
Now available as a Viz Extension.
Viz Extensions allows you to add additional visualization types to the Tableau Worksheet Marks card, which is currently available FOR FREE at Tableau Beta.
You can add new visualizations by selecting the “Add Extension” option in the Marks type dropdown and easily format it in your Tableau Worksheet.
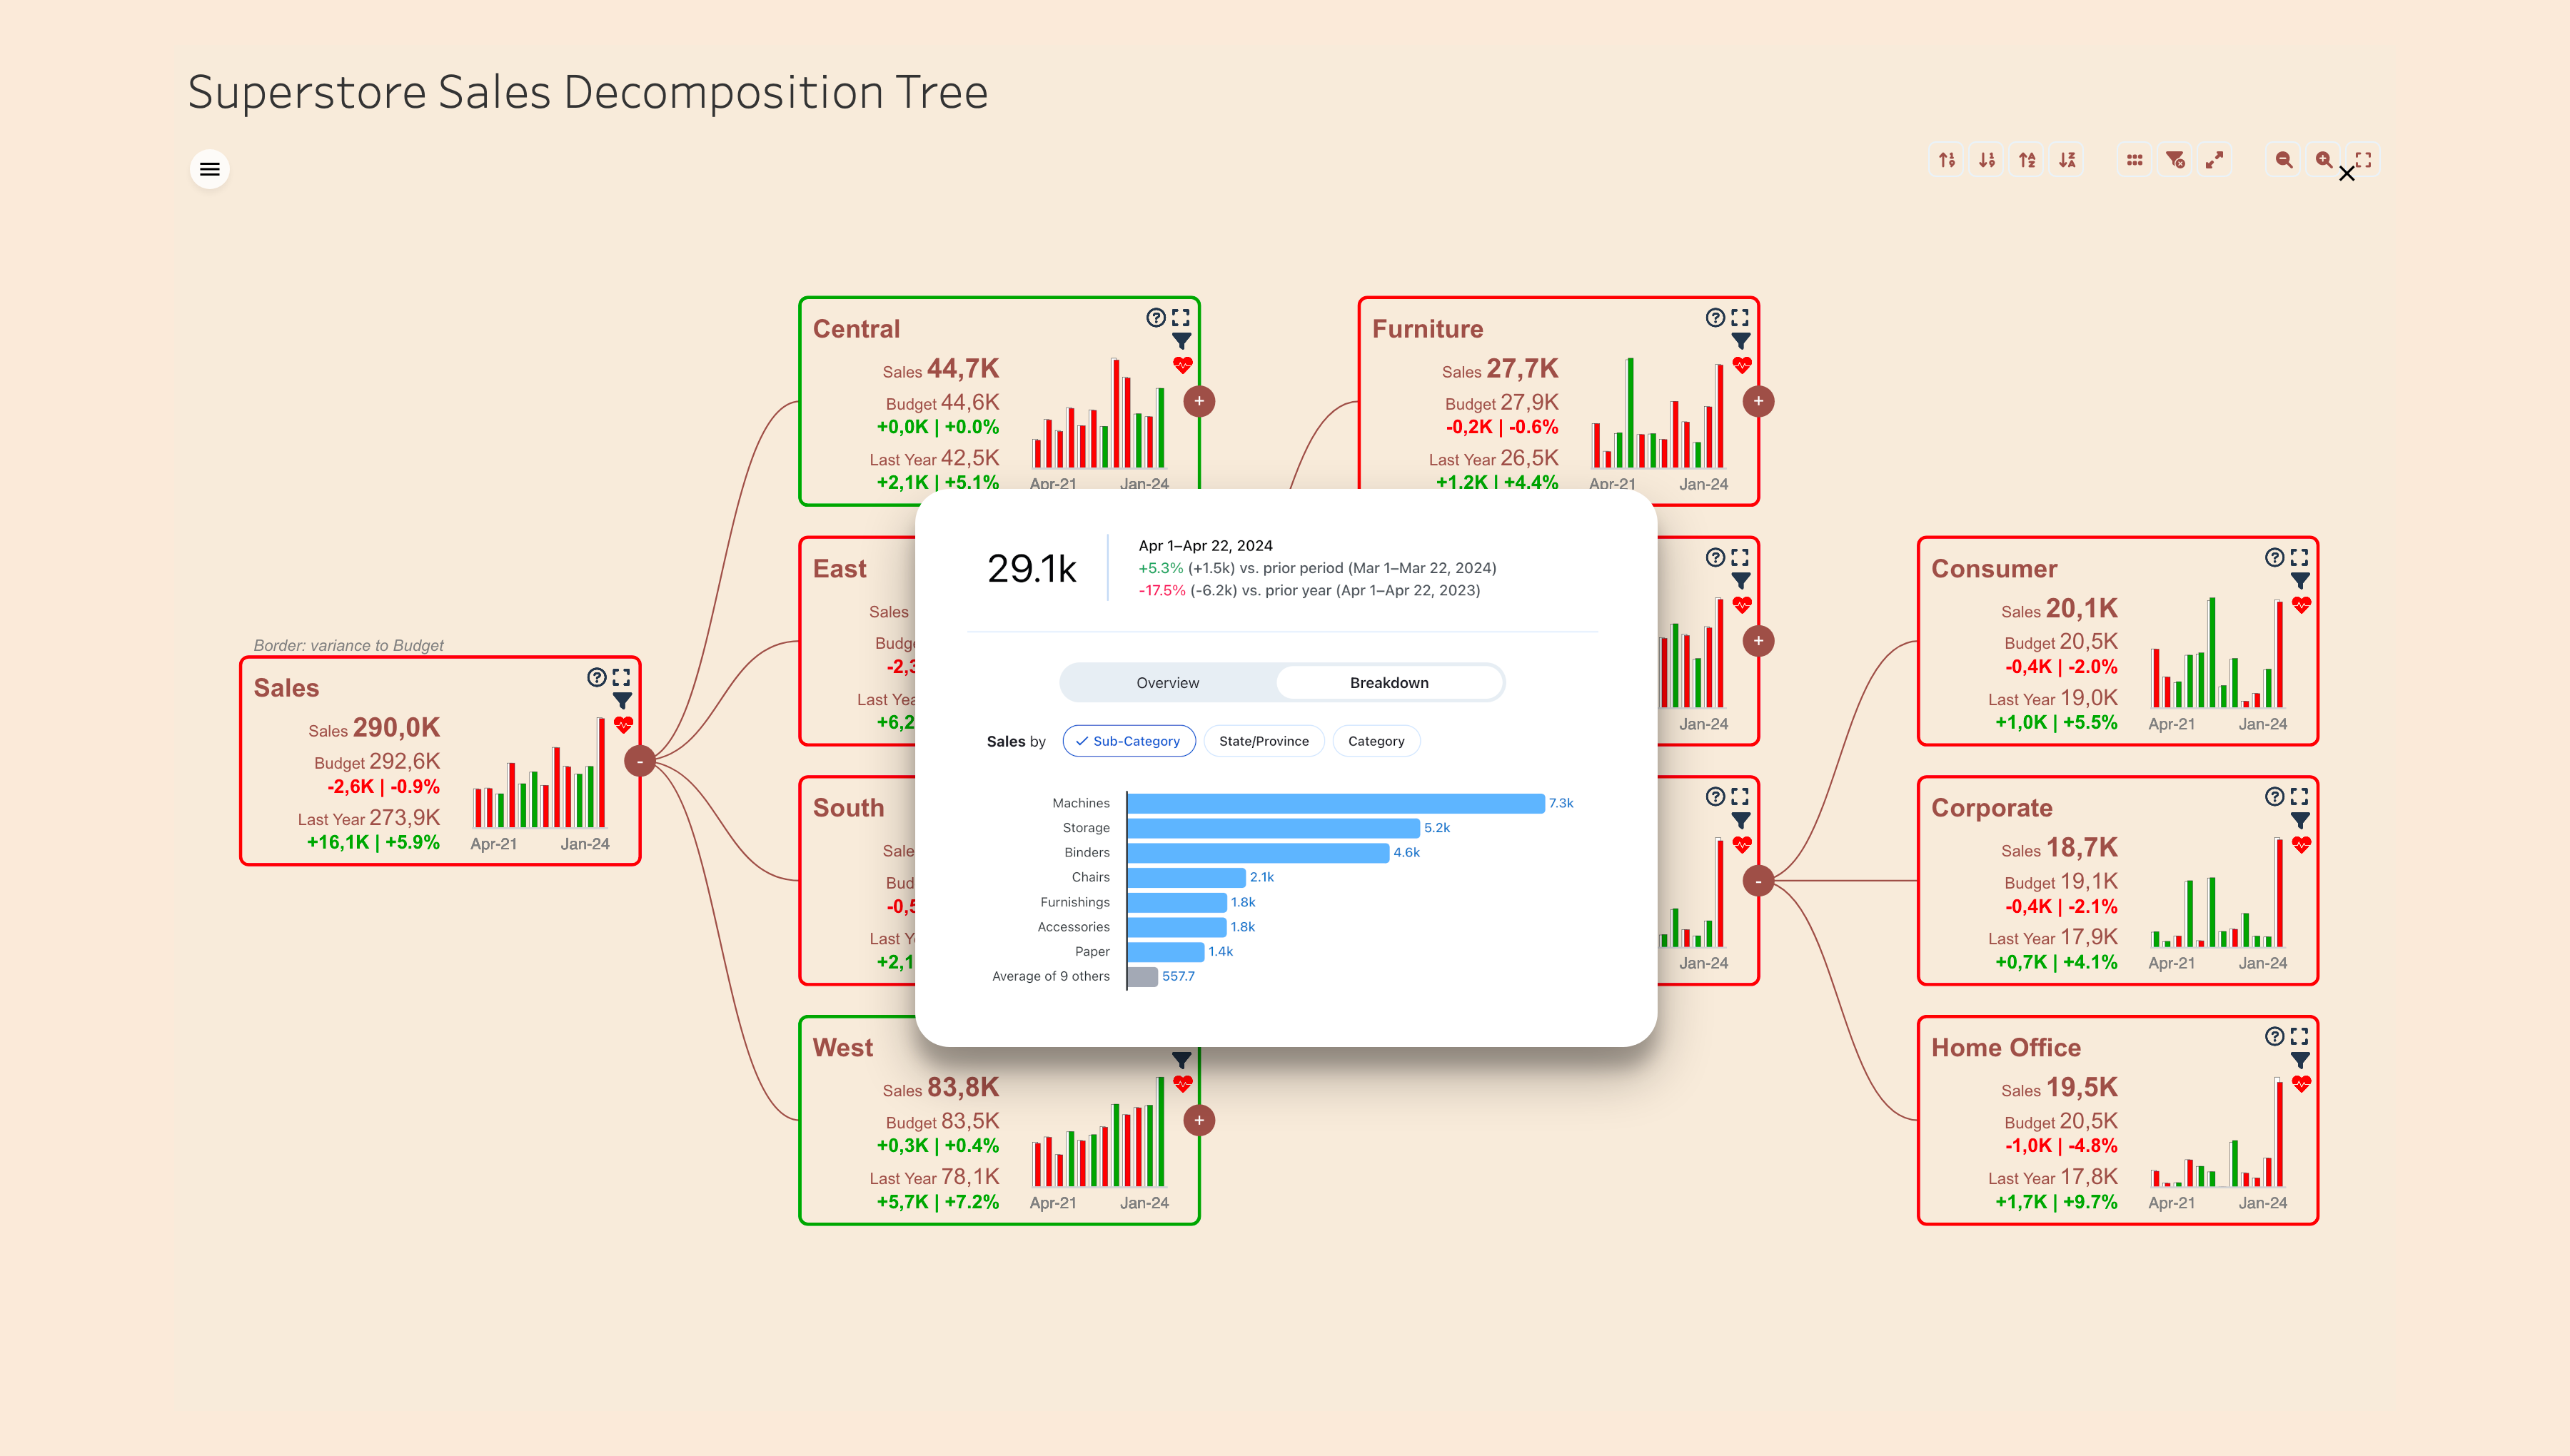
Bend PowerKPIs to your will and really own your value driver tree.
Reduce KPI Dashboard building & maintenance time by up to 90%
PowerKPIs in action with pre-built solutions.
Explore the practical advantages of Basic, Geo, and Circular Sankey diagrams and discover examples that demonstrate how ShowMeMore enhances data visualization.
The general PowerKPIs demo workbook with different use cases and data examples.
We understand the numerous responsibilities you manage, from leading teams to monitoring performance metrics. That's why we've developed PowerKPIs—to streamline your decision-making process and make your job easier.
We understand the numerous responsibilities you manage, from optimising your website to monitoring performance metrics. That's why we've developed PowerKPIs—to streamline your decision-making process and make your job easier.
“With PowerKPIs, users not only gain insights into past performance but also understand the underlying factors driving those results, empowering informed decision-making.”
– Daan Vloedgraven, Kramp, Business Analysis & Intelligence Manager

Let us help you get started.
Revolutionize your data with trusted partners.
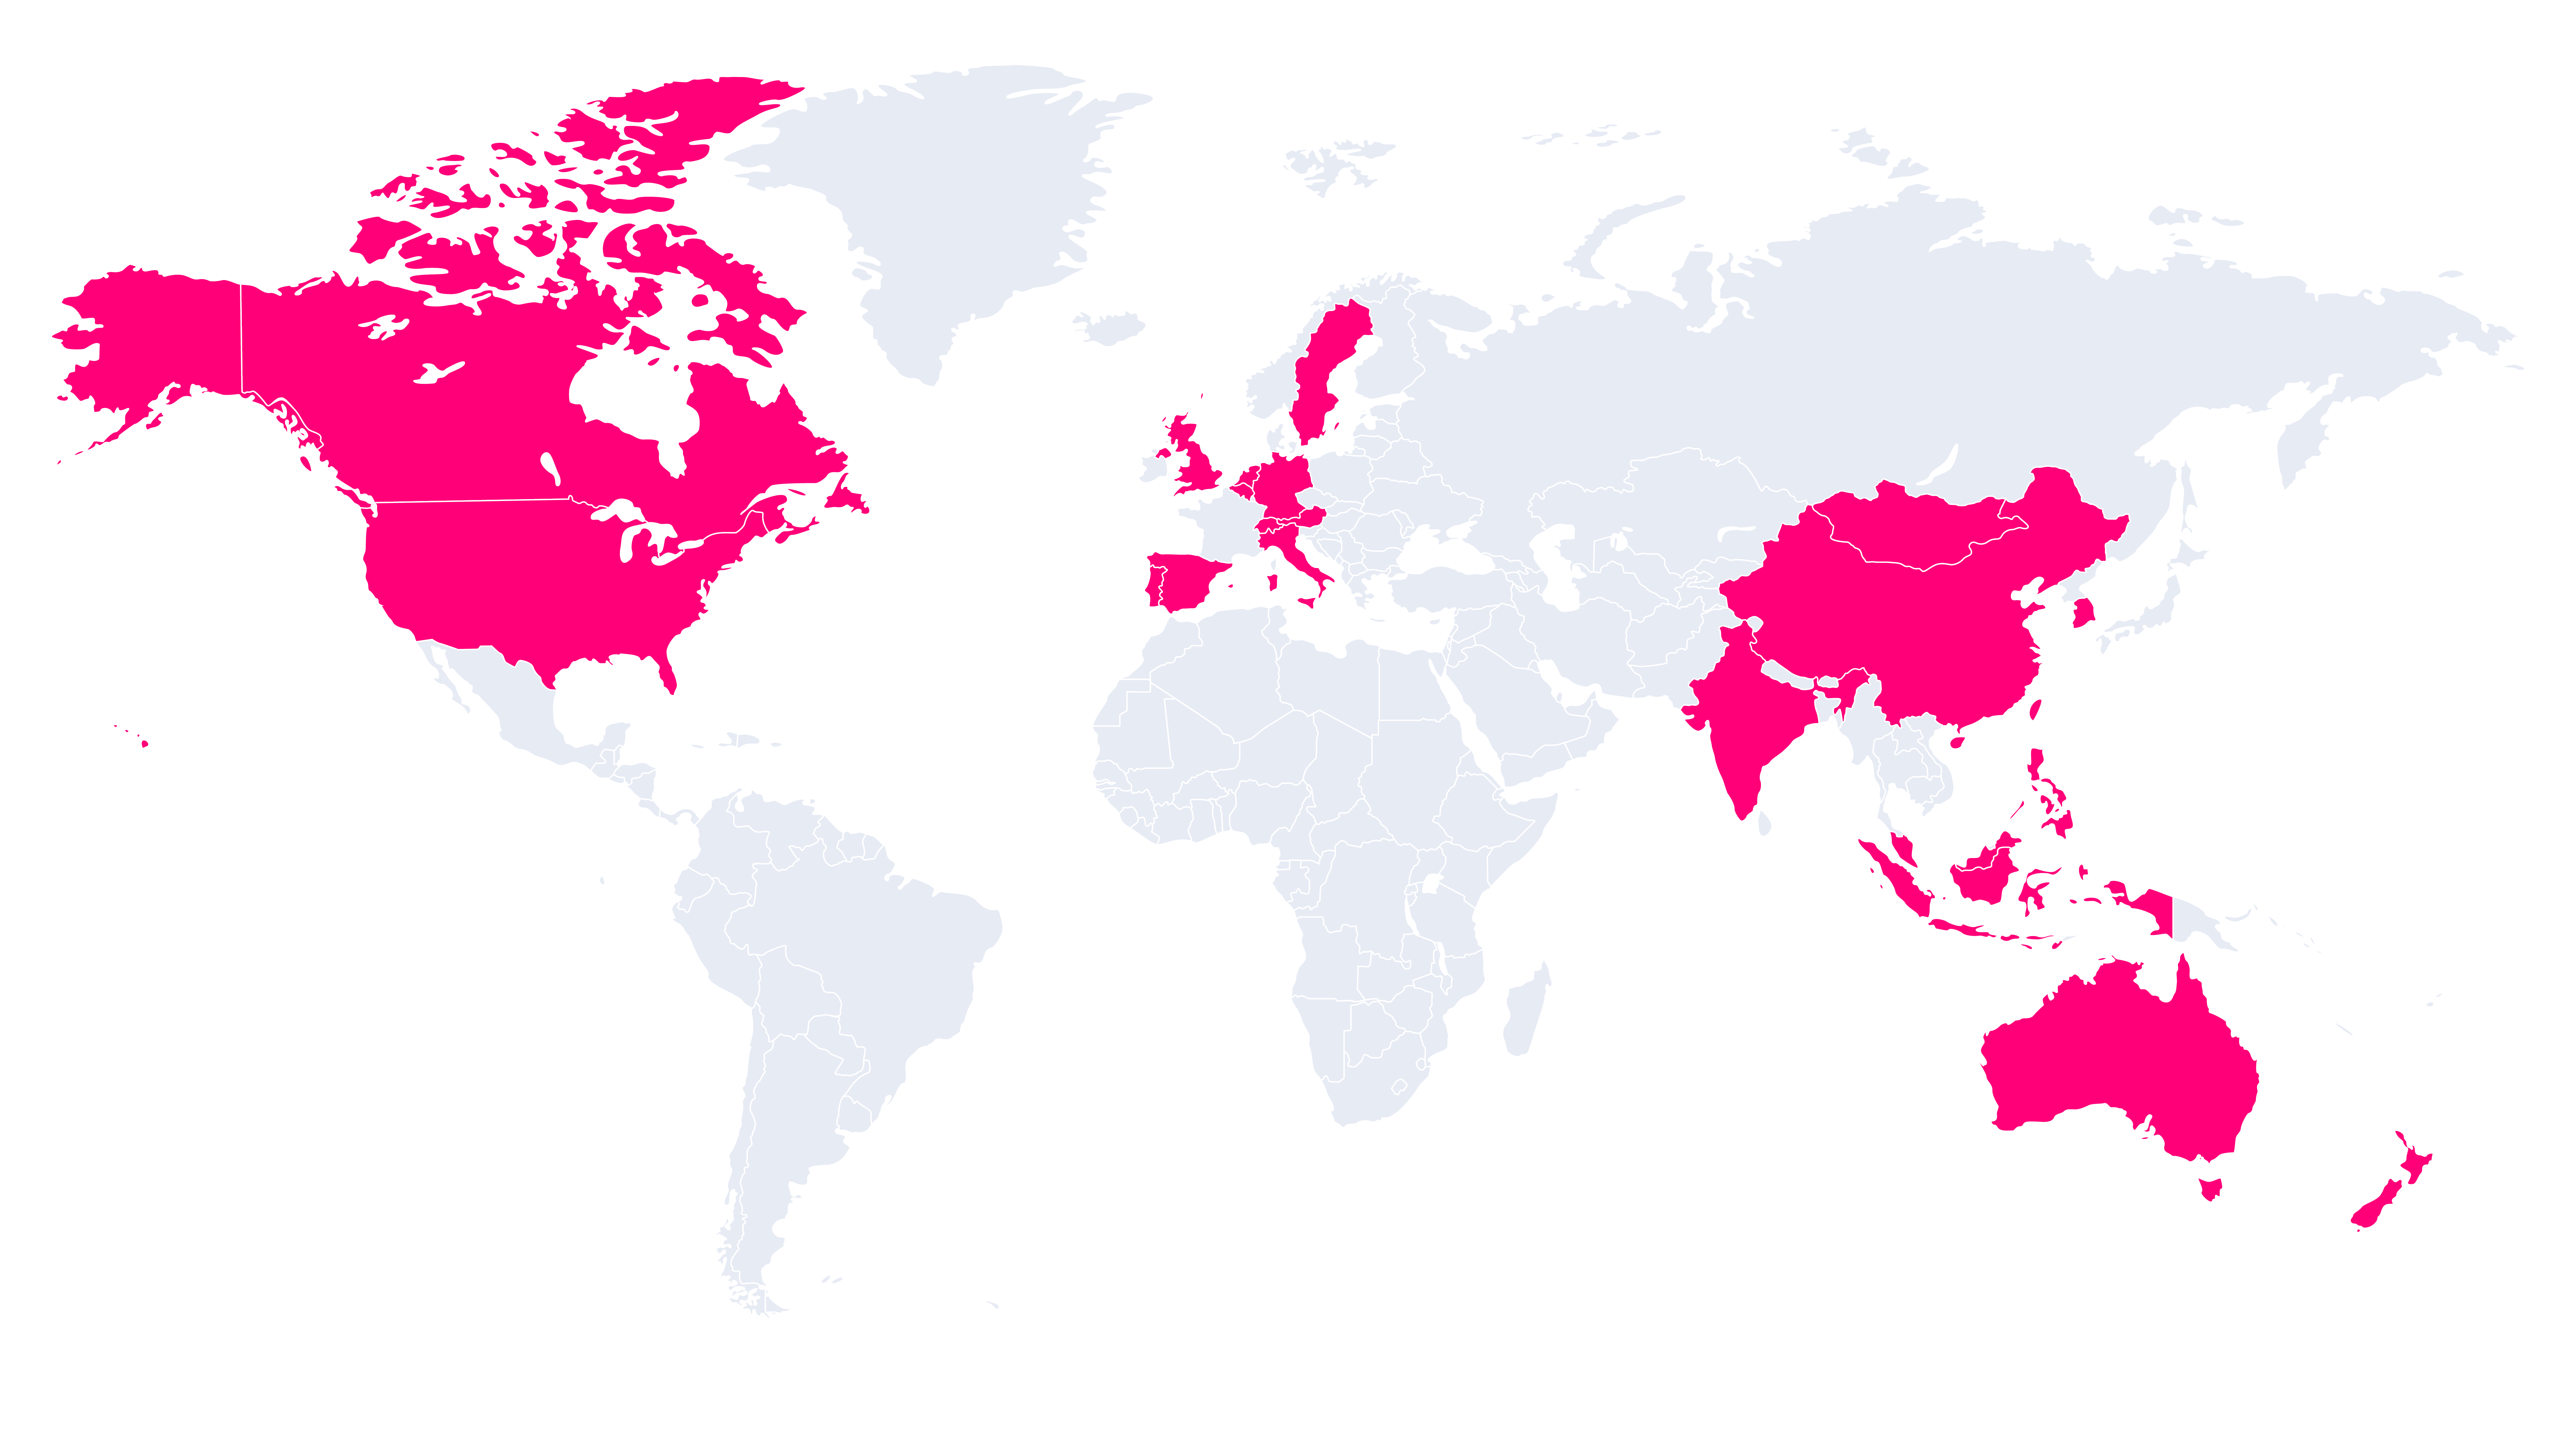
The Apps for Tableau partner network is a trusted and experienced team of consulting and reseller partners, dedicated to serving professionals worldwide in their native language.
Discover how PowerKPIs can revolutionize the way you handle data, enabling you to make better-informed decisions and achieve remarkable outcomes in your industry. Locate one of our trustworthy partners and start optimizing your data-driven journey.
Merlijn Buit & Klaus Schulte: A cross-border collaboration
Merlijn Buit and Klaus Schulte have been collaborating since achieving Tableau Visionary status in 2019.
When they realized that they lived only a few kilometers away from each other (Dutch-German border) they initiated sessions to exchange Tableau expertise. Combining their unique strengths, they formulated efficient and scalable solutions applicable to large organizations and presented PowerKPIs to the world.


