Workbooks Gallery
Pre-built workbooks using the SuperTables Extension.

Offer flexible Excel like tables in your Tableau Dashboards. Embed self service flexibility on datagrids with your Tableau governed data!
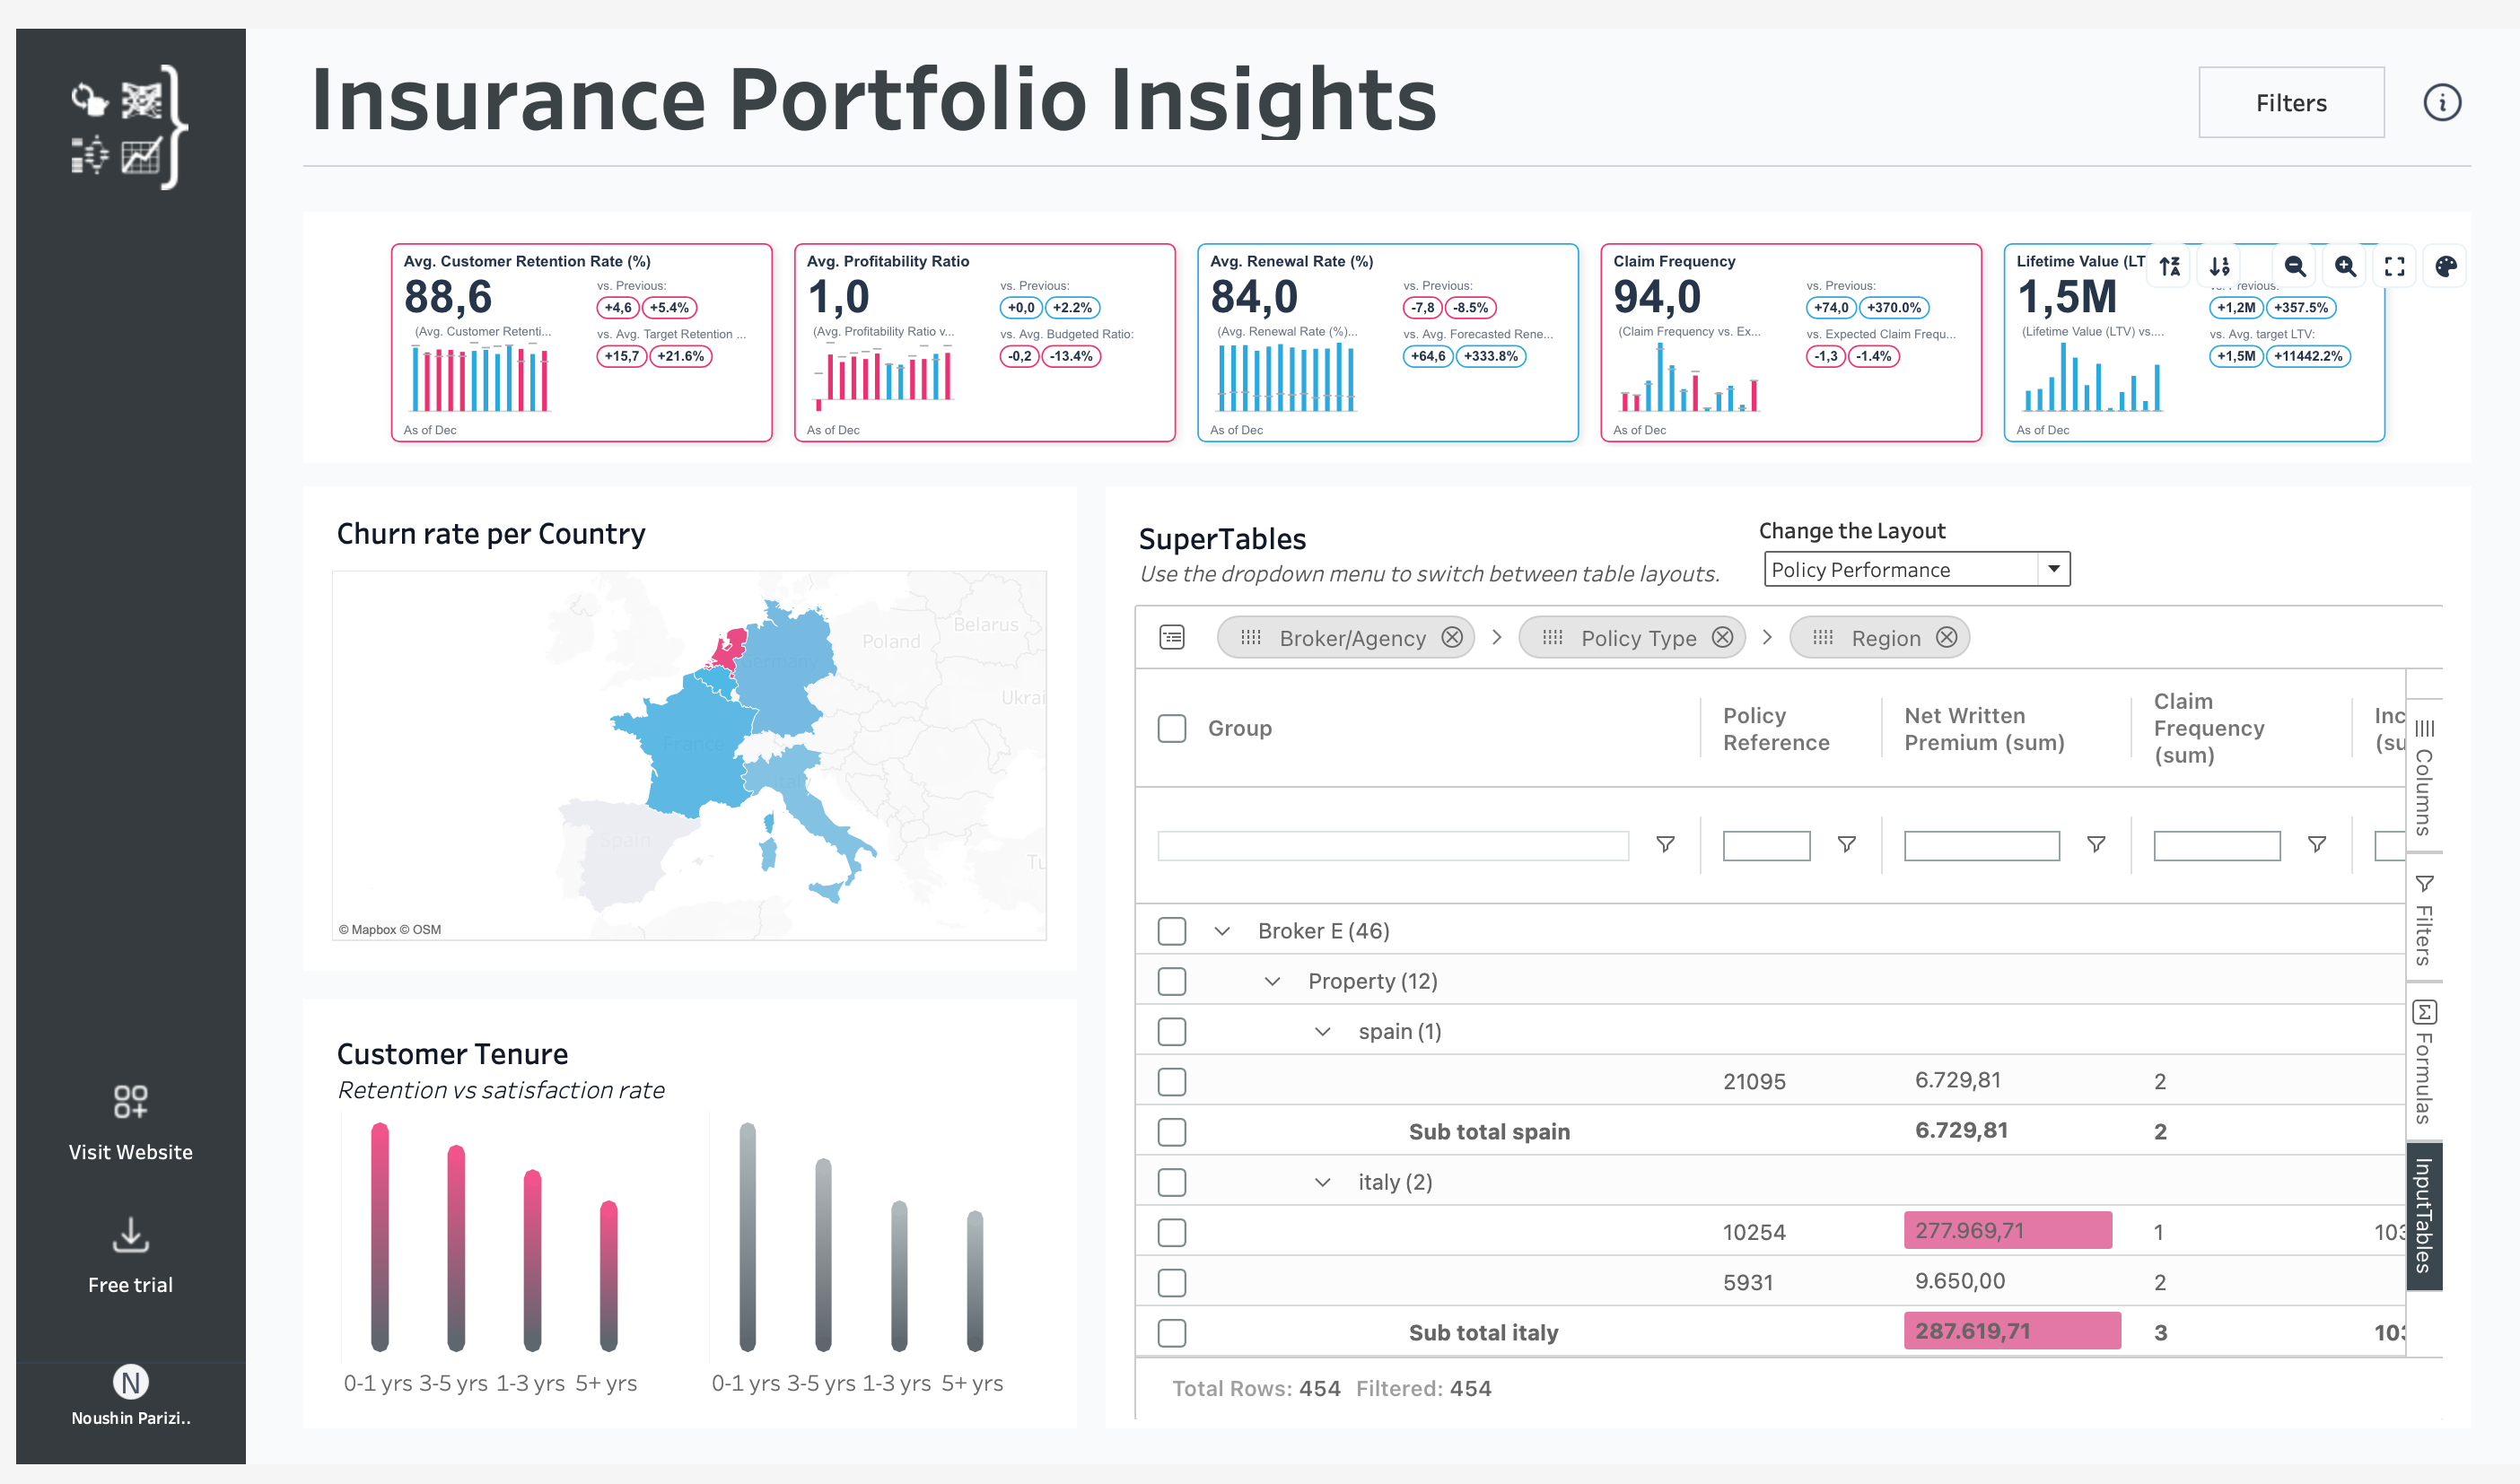
Transform your insurance analytics with this powerful, ready-to-use Insurance Portfolio Dashboard! Designed to simplify complex data and drive actionable insights, this solution helps you monitor key metrics like customer retention, profitability, and policy performance—all at a glance. By combining Tableau's native capabilities with advanced extensions like SuperTables and PowerKPIs, this dashboard offers unmatched clarity and flexibility for data-driven decision-making. Whether you're tracking churn rates, analyzing broker performance, or visualizing profitability trends, this dashboard is your all-in-one tool for success. Download it now and start making smarter, faster decisions for your insurance portfolio!
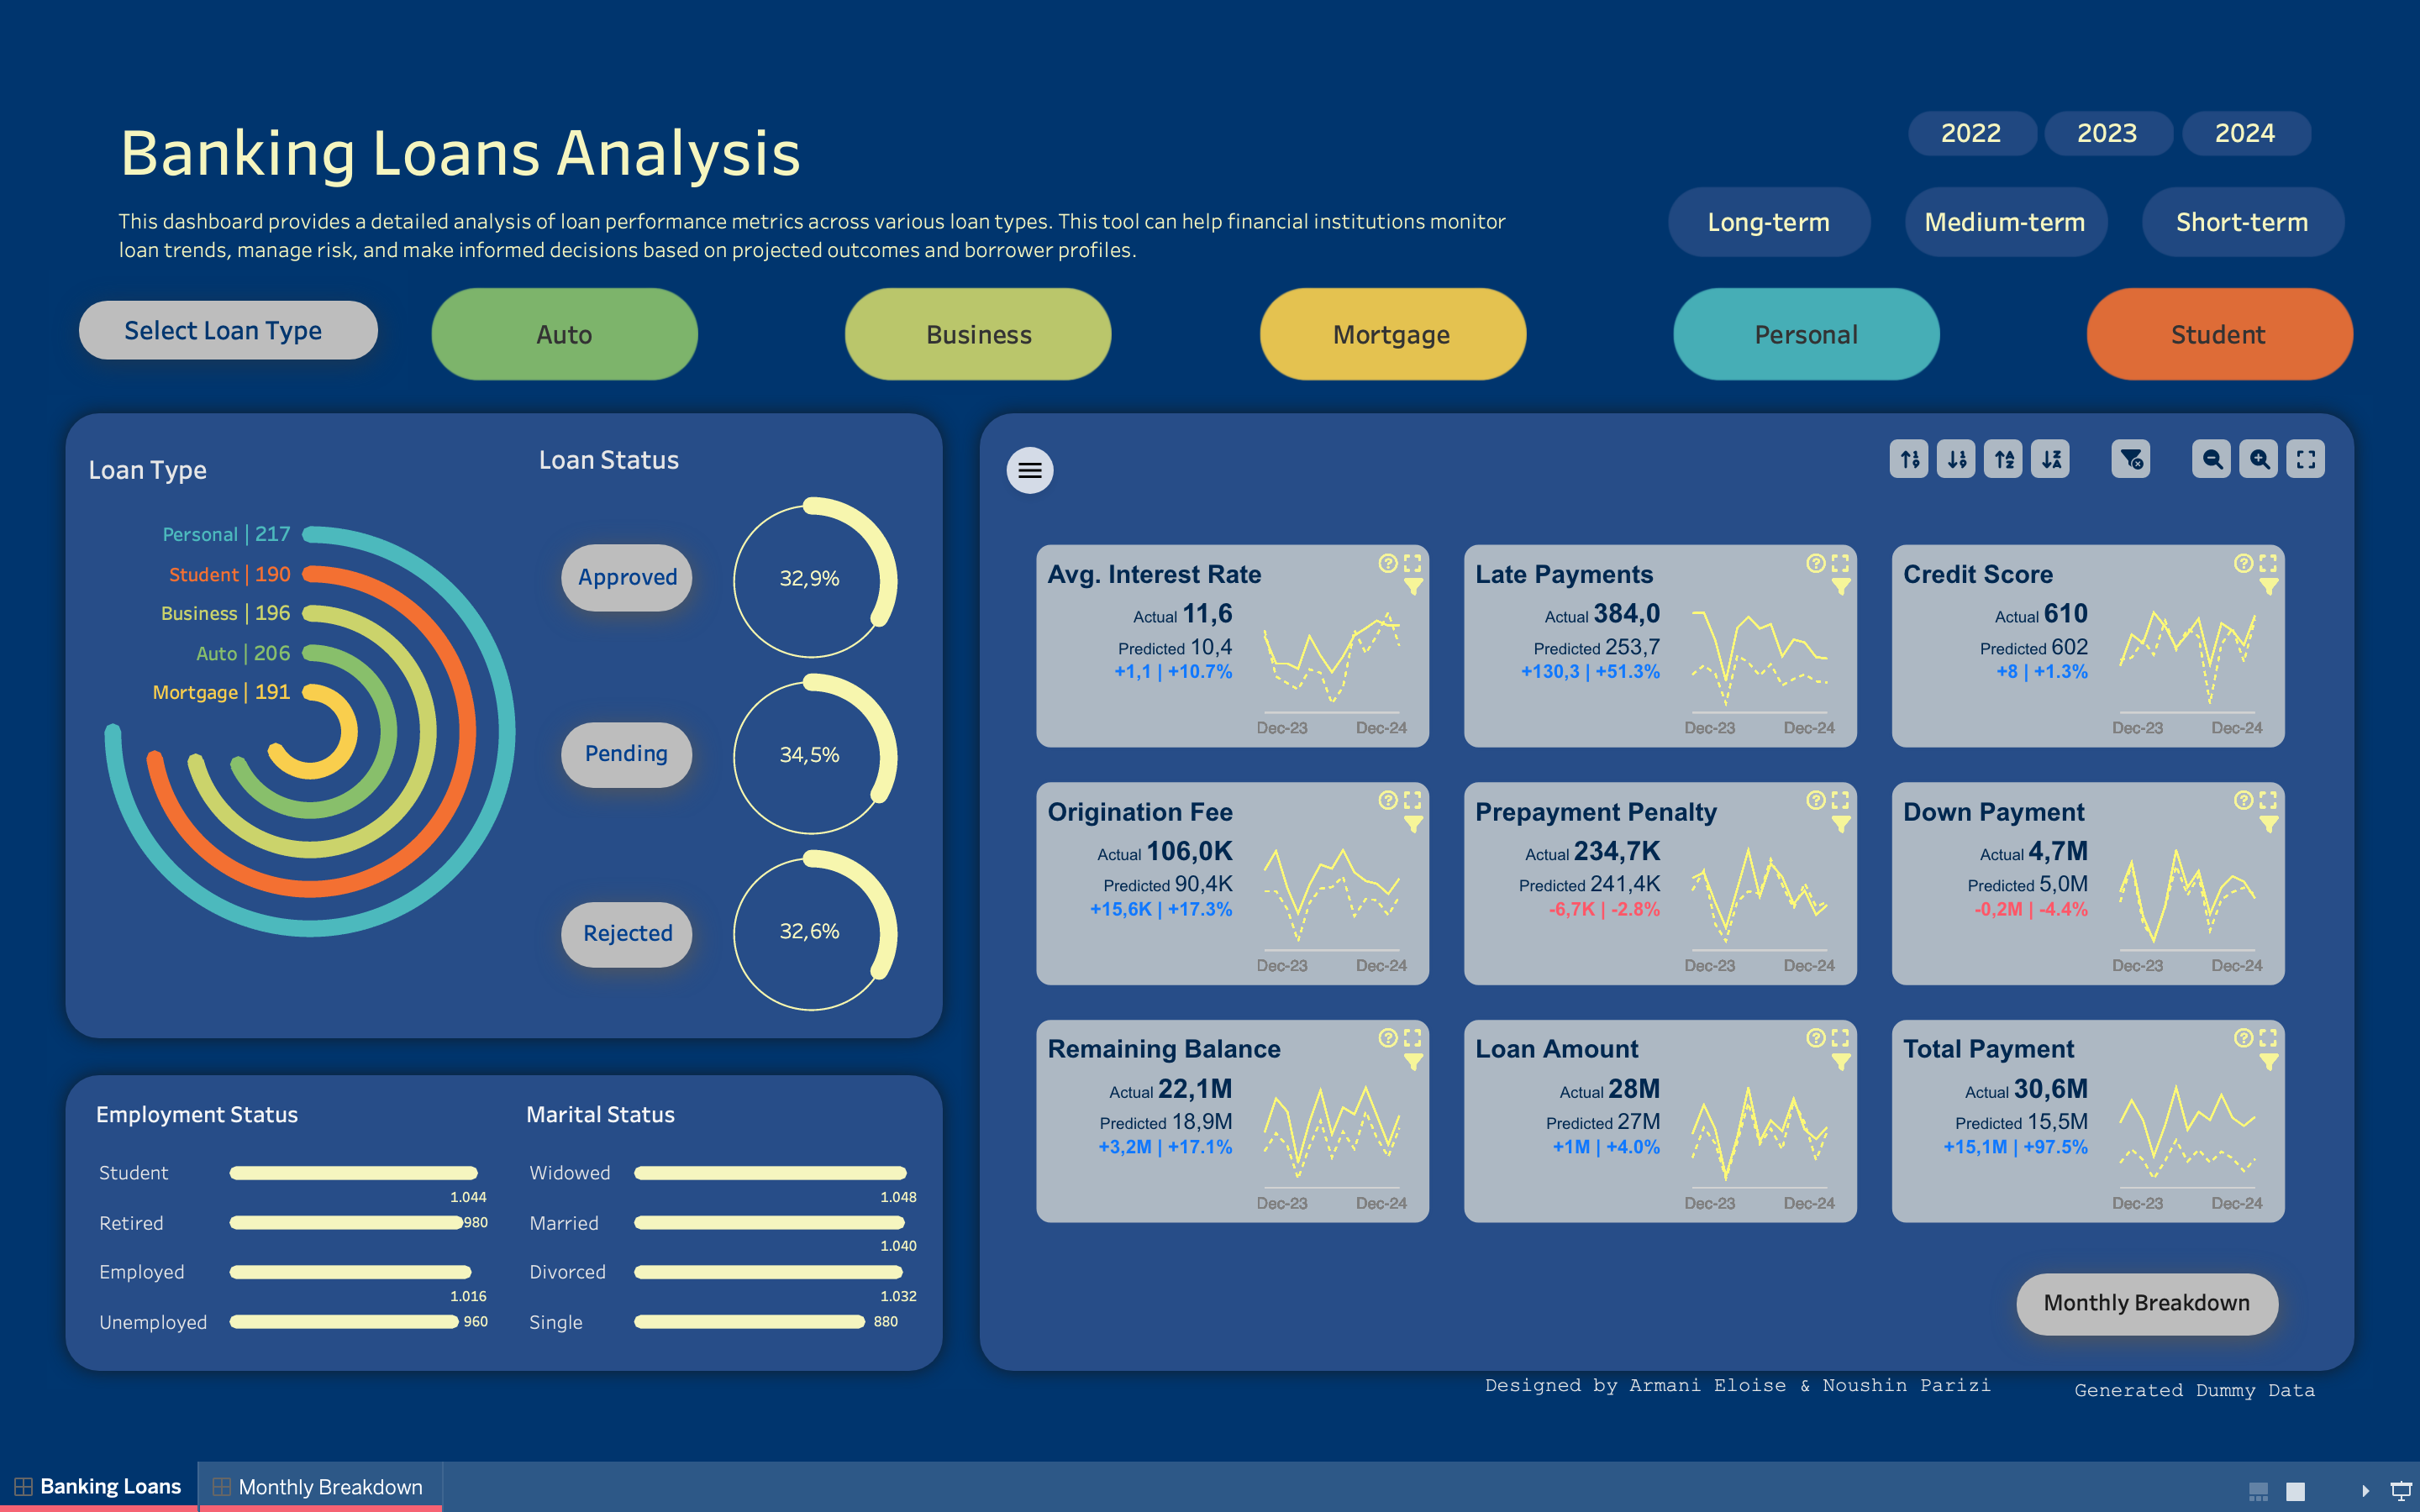
This is an in-depth analysis of banking loan performance across various types powered by SuperTables and PowerKPIs. The first dashboard offers detailed insights, allowing users to filter and explore key metrics like credit score, interest rates, and remaining balances. The second dashboard provides a high-level summary of loan status, trends, and borrower demographics, helping financial institutions track loan health, manage risks, and easily make data-driven decisions. It's a comprehensive solution for strategic insights and efficient loan portfolio management.
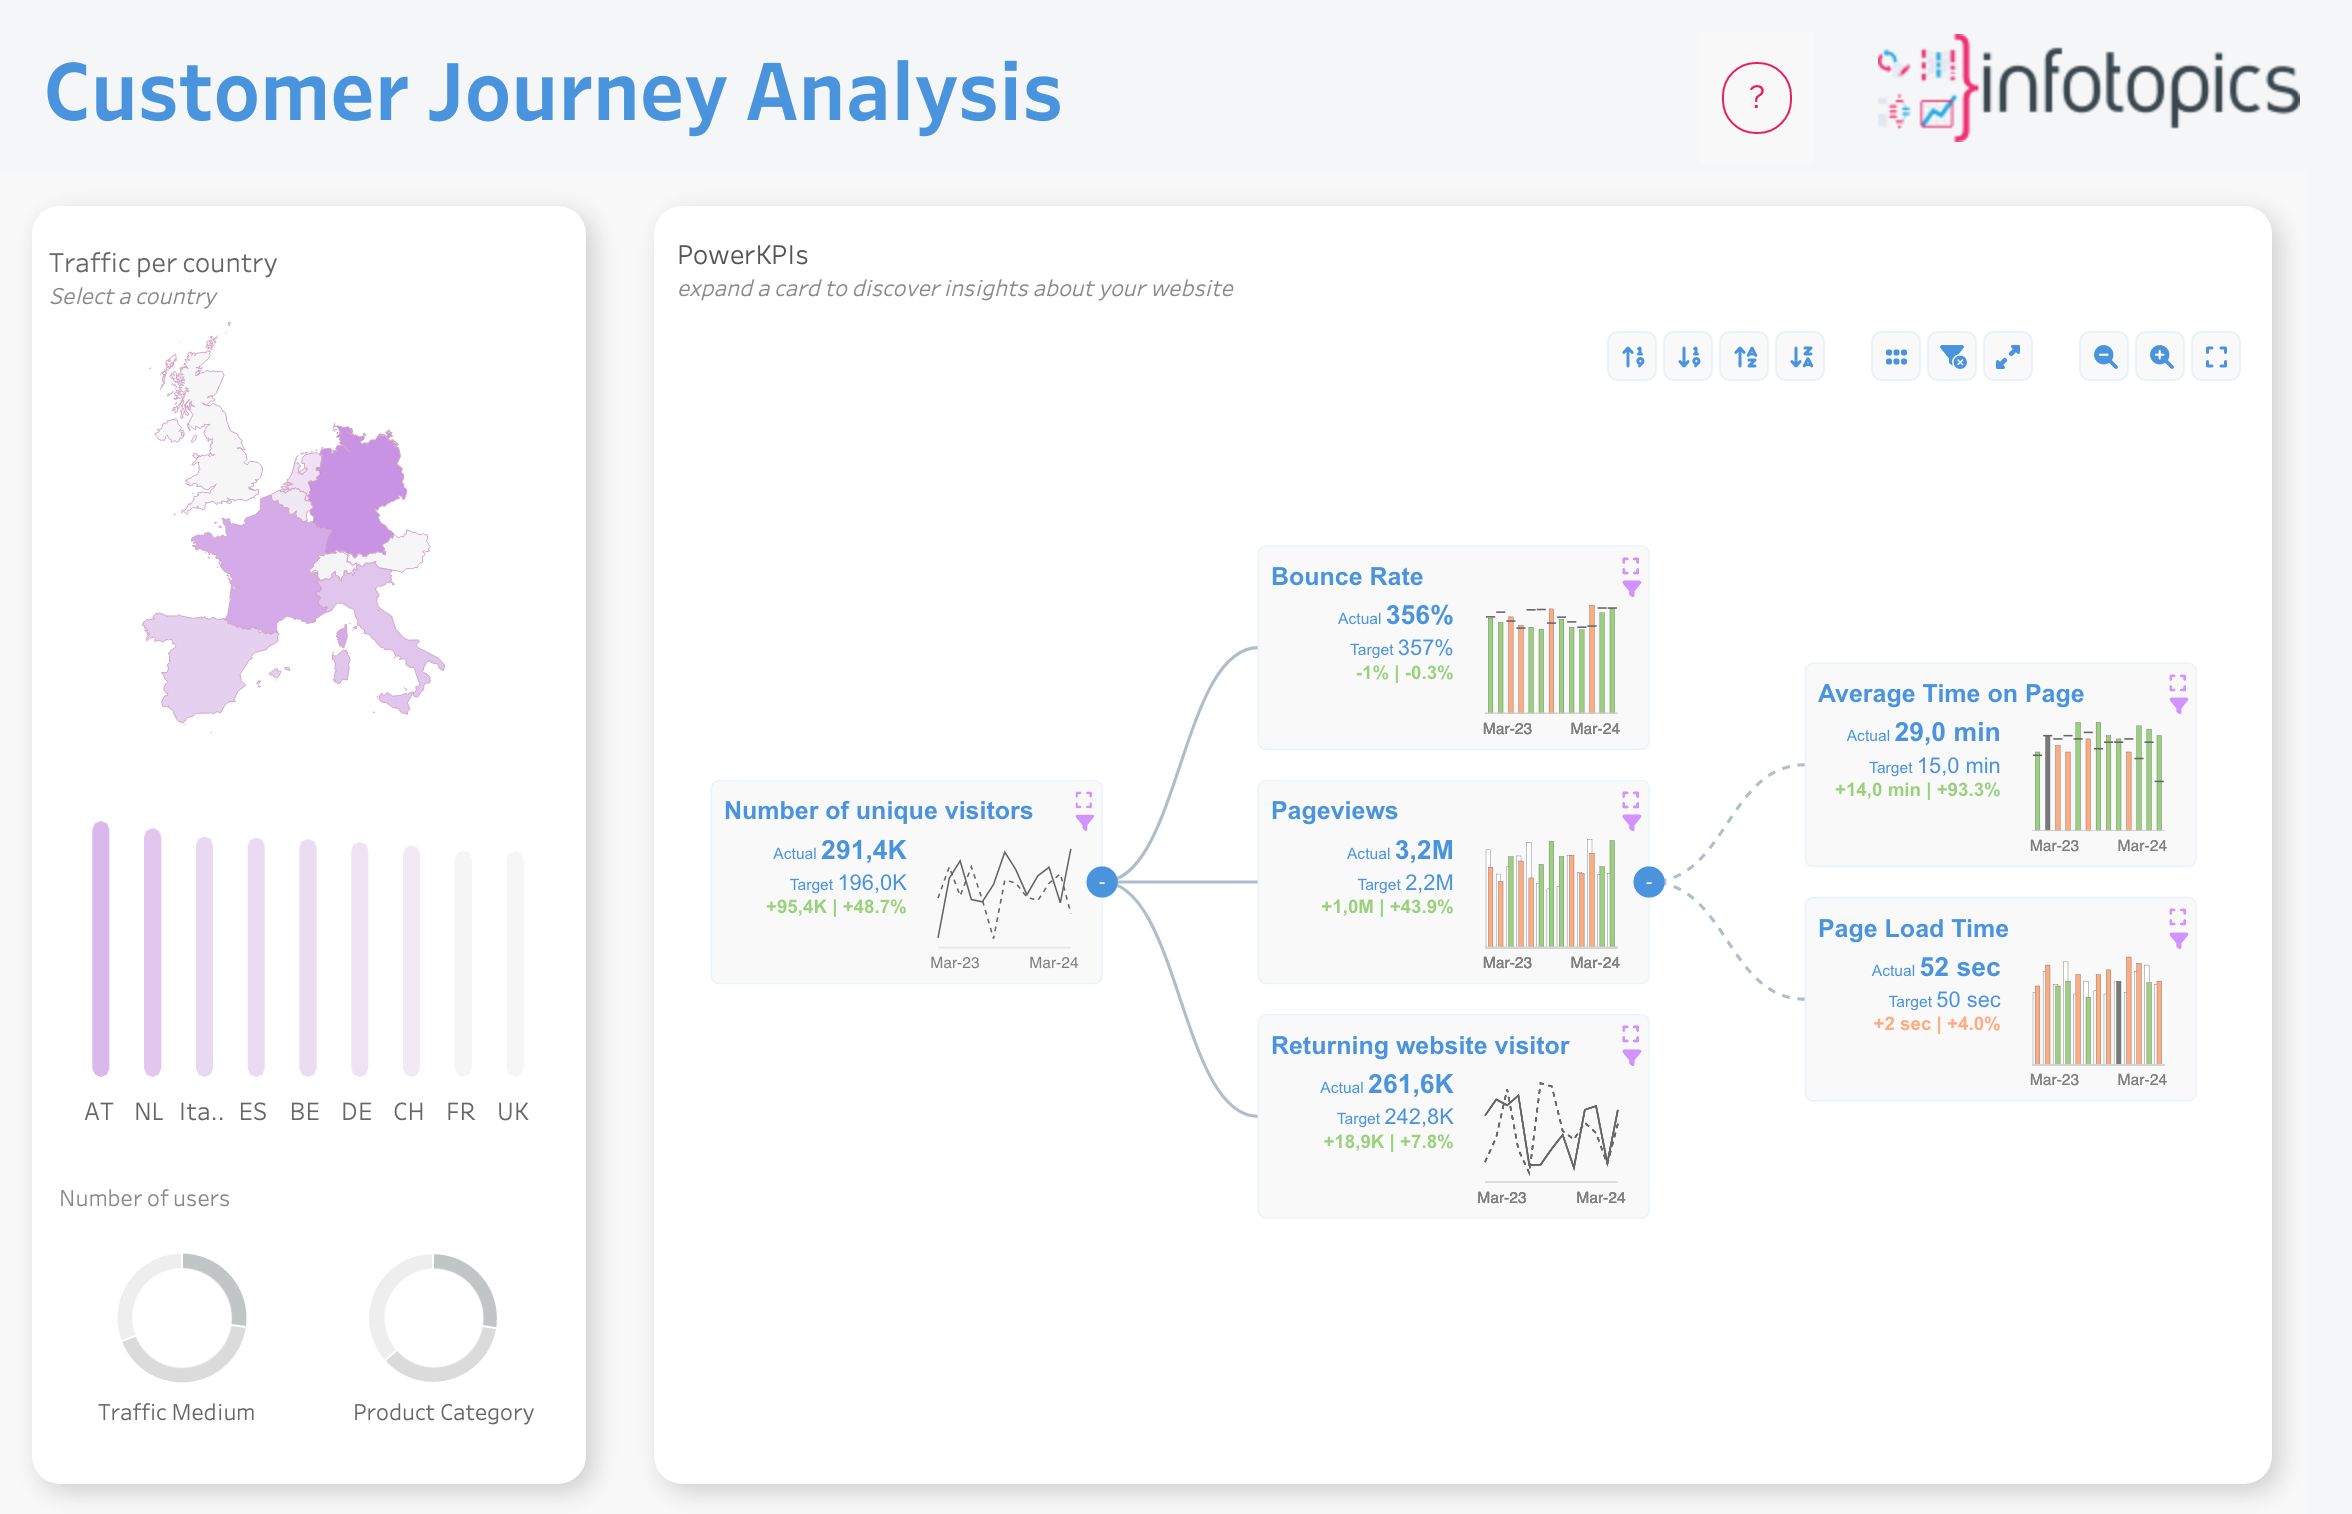
We understand the numerous responsibilities you manage, from optimising your website to monitoring performance metrics. That's why we've developed PowerKPIs—to streamline your decision-making process and make your job easier.
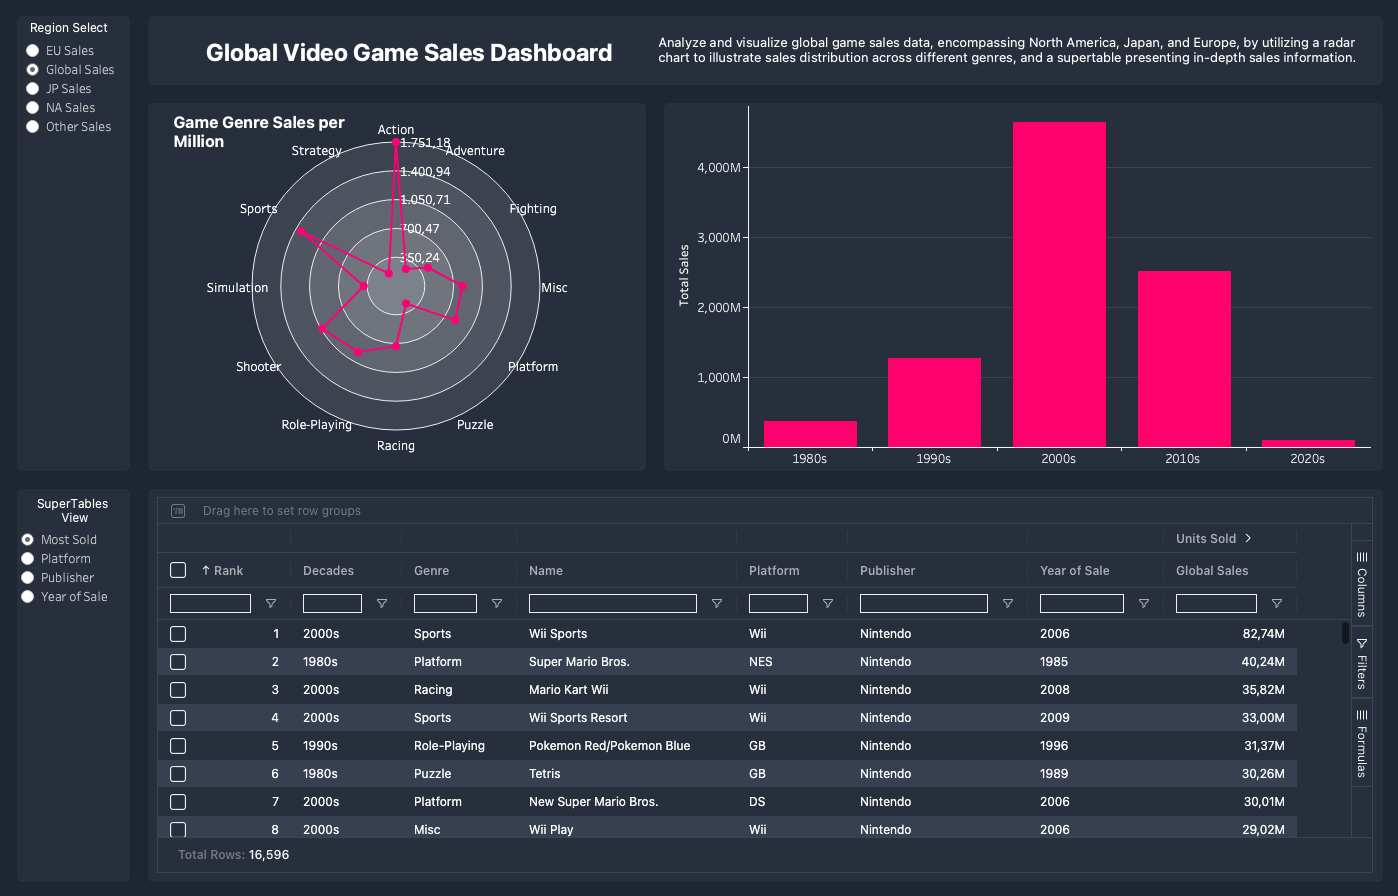
Unlock the world of global game sales with our ShowMeMore Tableau dashboard! Dive into North America, Japan, and Europe's gaming trends using a radar chart and supertable for a quick, insightful adventure. Elevate your understanding of sales distribution and genre dynamics.
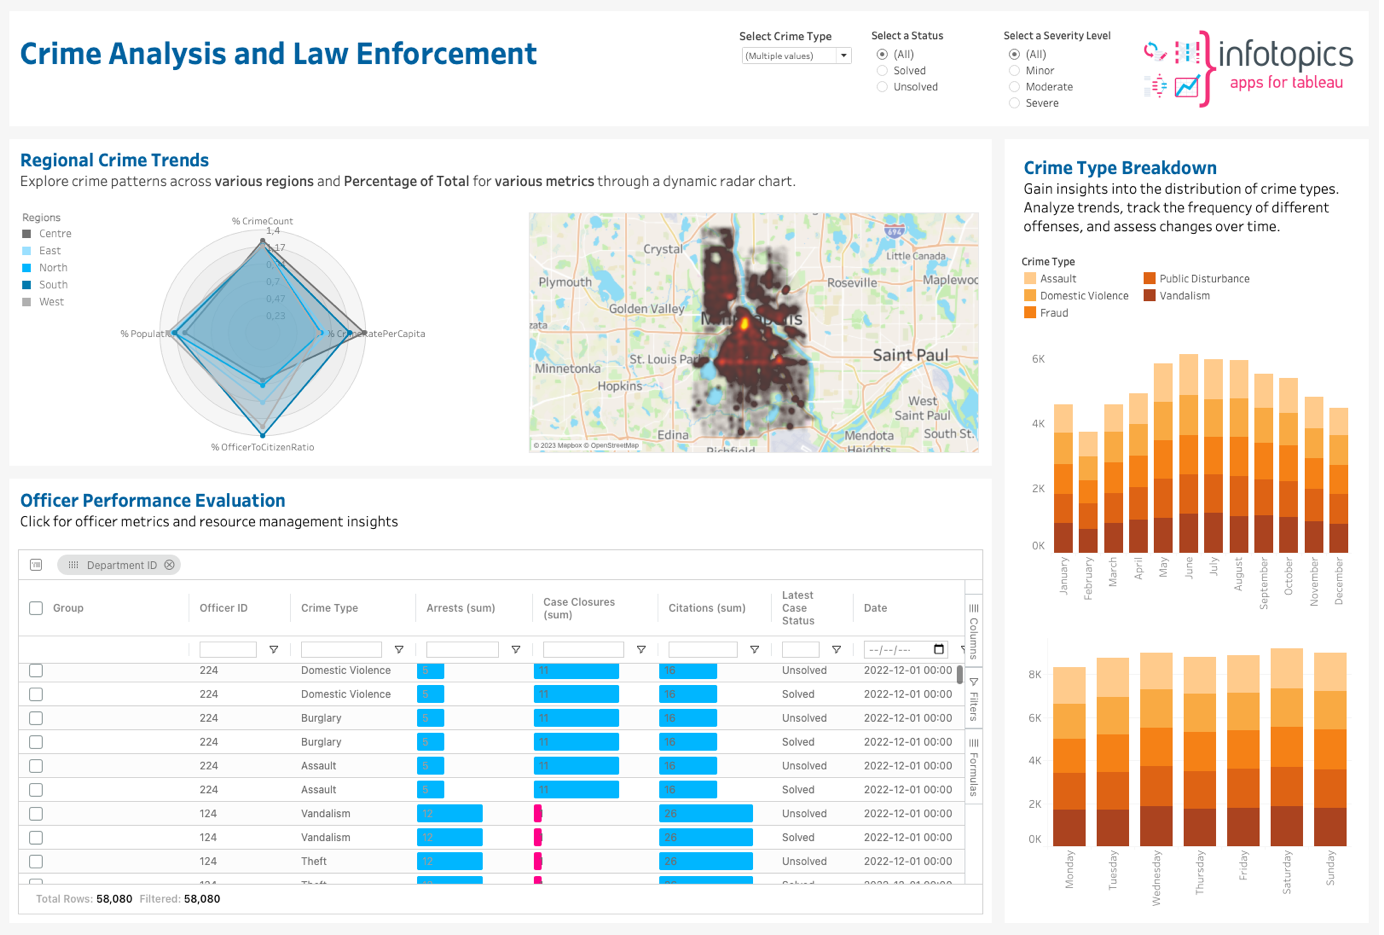
Empower your law enforcement agency with this Crime Analysis Dashboard, a robust solution designed to revolutionise crime management, optimize resource allocation, and enhance community safety. Delve into intricate crime patterns across regions using dynamic radar chart and interactive maps for proactive policing. The Stacked Bar Charts unveil crime type distribution, aiding in trend analysis for informed decision-making. With SuperTables Tableau extension, evaluate officer performance with granular detail, allowing tailored column order, grouping, and customised bar charts for optimised resource allocation. Interactive features promote community engagement, enhance resource deployment efficiency, reduce response times, and foster transparency, trust, and collaboration for safer neighborhoods.
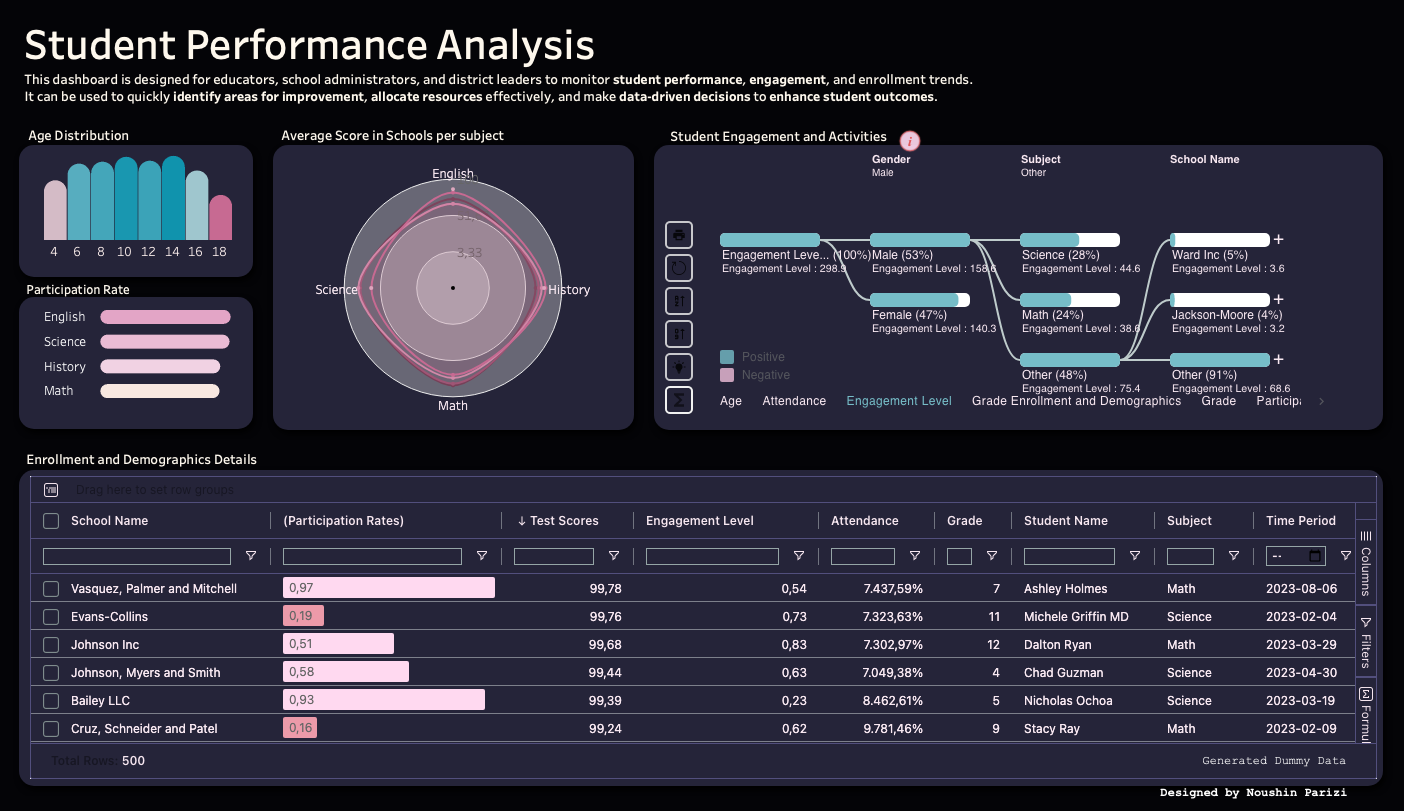
Discover the power of insights with our interactive dashboard! Designed for educators and school leaders, this solution helps you visualise key trends in student engagement, participation, and scores across subjects. Easily spot areas for improvement and make data-driven decisions to boost student outcomes. Download now and see how it can elevate your education strategy.
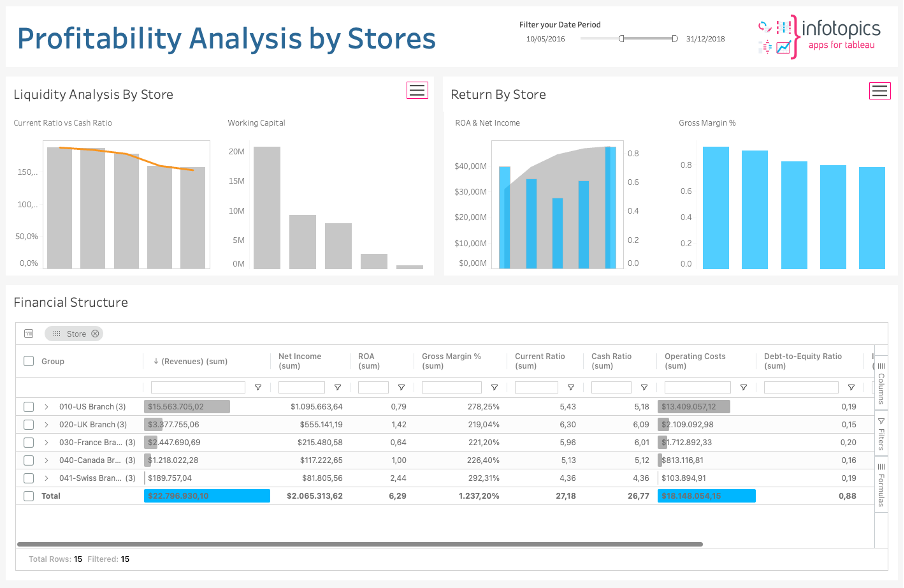
This solution for financial statements offers dynamic dashboards for real-time monitoring, strategic resource allocation, and scenario modelling. Easily explore “What-If” scenarios, monitor financial health in real-time, and optimize resource allocation game-changing capabilities in SuperTables. Use the ShowMeMore Waterfall Chart to model various financial scenarios, from cost reductions to market expansions, making informed choices. Uncover opportunities and address risks with this solution.
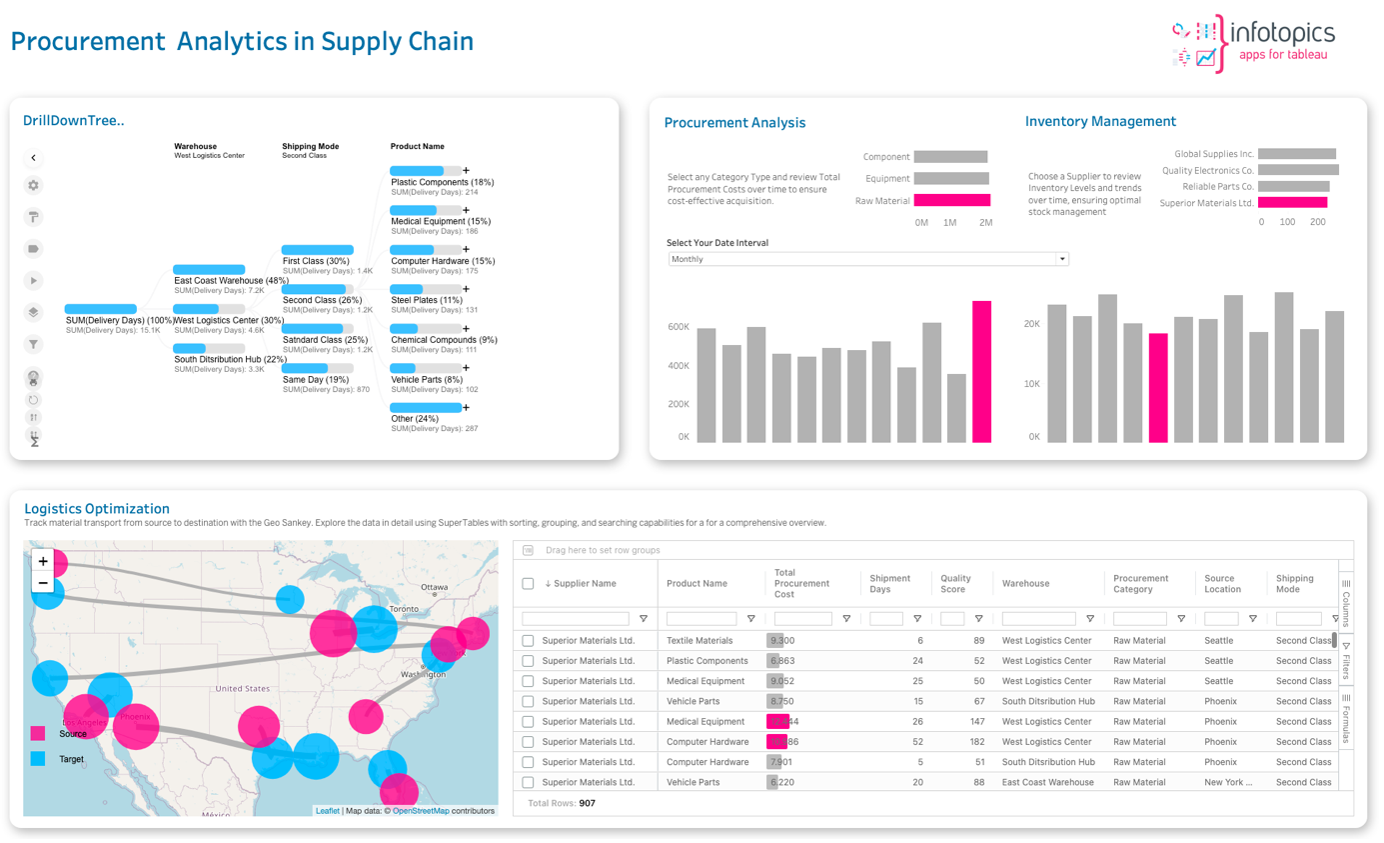
Explore this solution to simplify the complexities of supply chain management. Whether you're in manufacturing or logistics, this dashboard is tailored for you. With an intuitive overview and DrillDownTree, it offers insights into your entire supply chain. The Performance Metrics Dashboard tracks key metrics, and Geo Sankey visualizes material flow for optimized transportation routes. SuperTables at the bottom right create a user-friendly space for easy exploration, streamlined logistics, enhanced category-based performance, and informed decision-making. This dashboard, powered by extensions, adds immense value by providing insights for a seamless supply chain operation.