


Transforming KPI reports and intriguing people in the organization
SuperKPIs has already made a significant difference for the Business Intelligence developers at Inova regarding time and resource optimization, Learn how SuperKPIs created an elegant, intuitive and inviting experience for senior executives that the top 300 leaders of the organization use to create focus for their teams while promoting collaboration on shared goals that affect the broader health system.

“Congratulations on creating a very easy-to-use, relevant template configurator in which the Tableau community will find much value. SuperKPIs allows you to create and maintain a wide range of KPIs with complete context, including time-series comparisons and conditional formatting for highly polished executive dashboards. Easy and fast.”
– Douglas Chope, Principal Solution Engineer at Tableau Software, a Salesforce Company


Reduce KPI Dashboard building time up to 90%

“From a developer perspective, the product is definitely saving us time and helps us optimize many of our resources. I can definitely say that I’m very excited to see what we can do, not just in this project but also in different projects.”
– Hina Waheed, Senior Business Intelligence Developer

Let us help you get started.
Support
Our team is committed to your success with Apps for TableauContact us by mail:
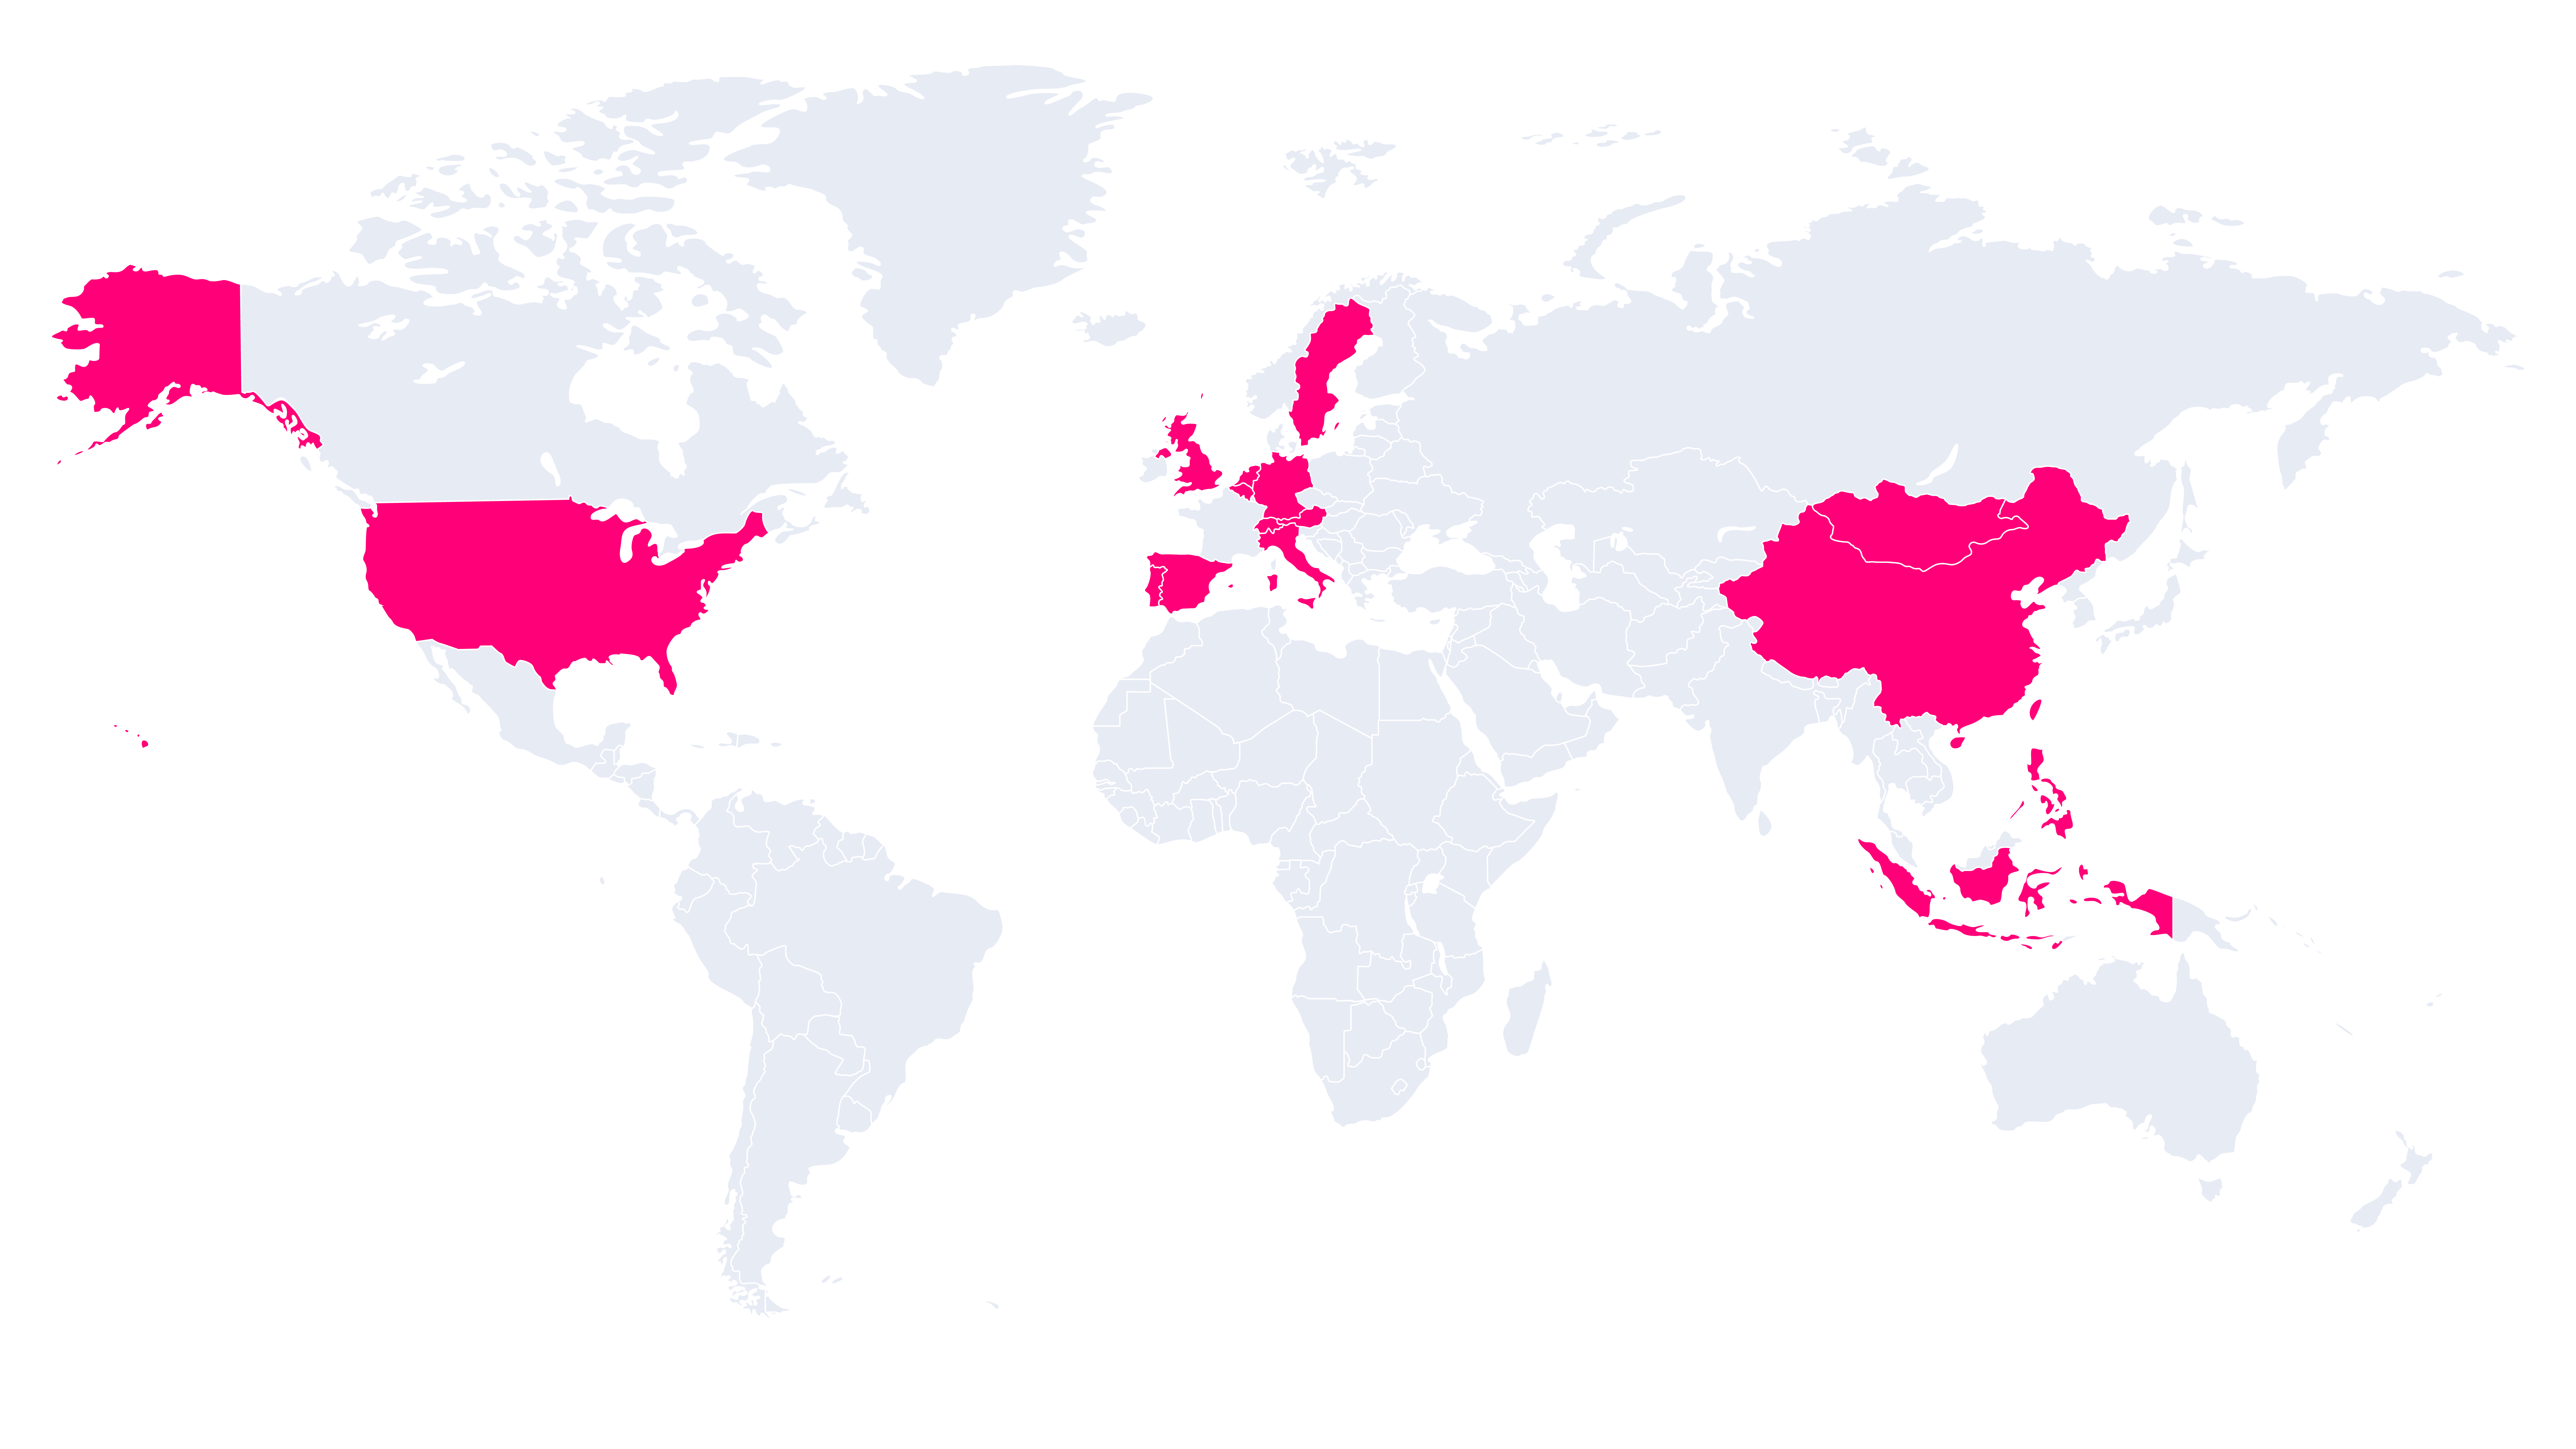
Revolutionize your data with trusted partners.
The Apps for Tableau partner network is a trusted and experienced team of consulting and reseller partners, dedicated to serving professionals worldwide in their native language.
Discover how SuperKPIs can revolutionize the way you handle data, enabling you to make better-informed decisions and achieve remarkable outcomes in your industry. Locate one of our trustworthy partners and start optimizing your data-driven journey.
Merlijn Buit & Klaus Schulte:
A cross-border collaboration
Merlijn Buit and Klaus Schulte have been collaborating since achieving Tableau Visionary status in 2019.
When they realized that they lived only a few kilometers away from each other (Dutch-German border) they initiated sessions to exchange Tableau expertise. Combining their unique strengths, they formulated efficient and scalable solutions applicable to large organizations and presented SuperKPIs to the world.
FAQ
Yes, you can request more information by filling in the form on the pricing page.
Yes, the on-premises version does not require an internet connection to work.