SuperKPIs Product Guide
STEP 1: Configure SuperKPIs
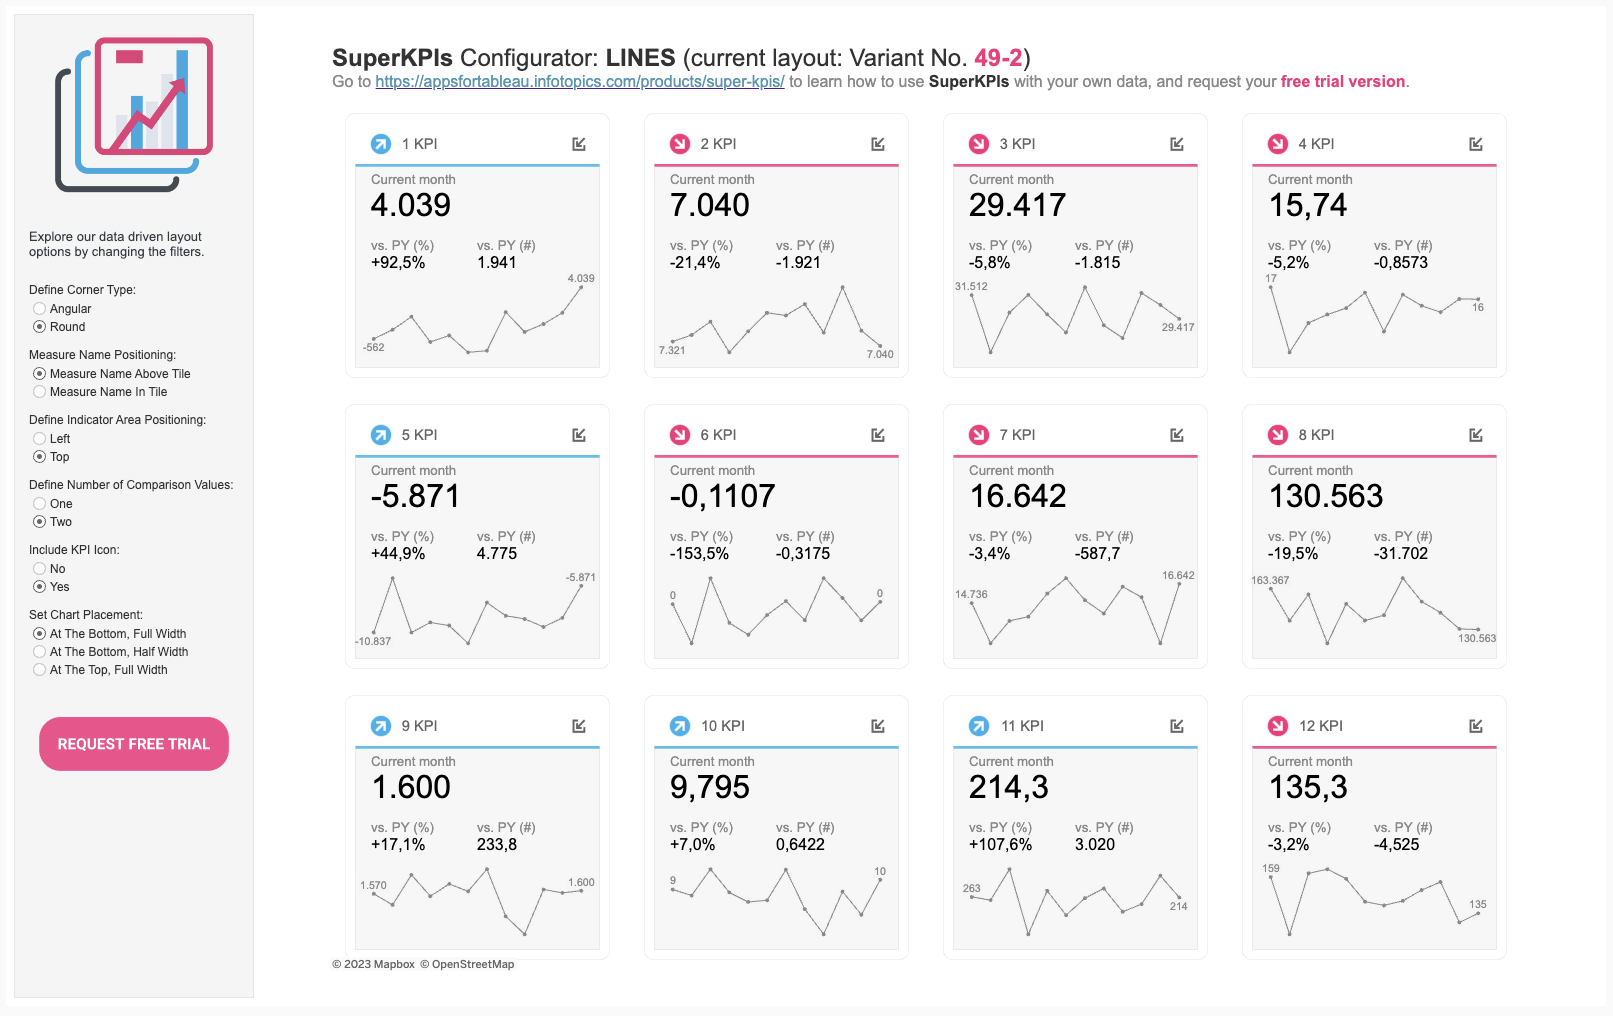
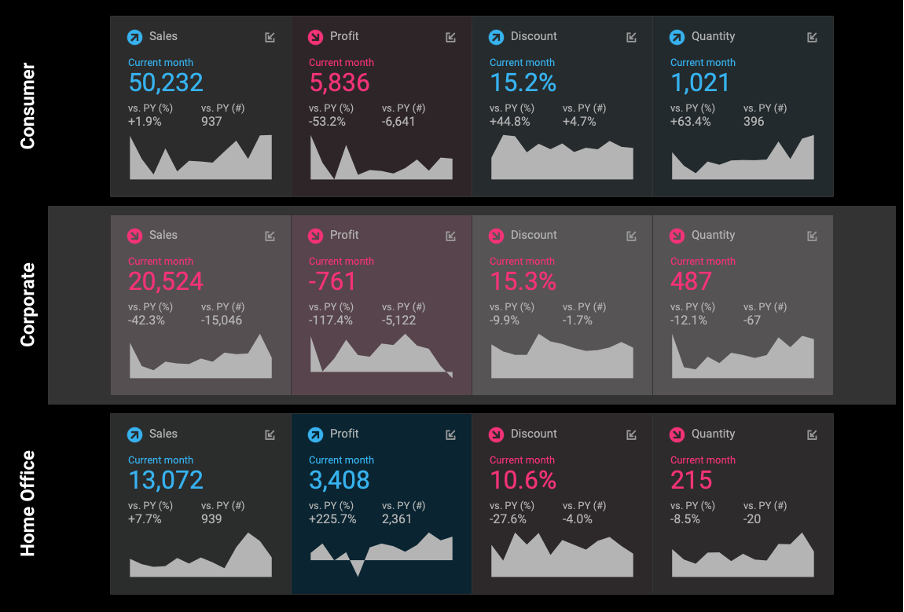
Use the SuperKPIs Configurator Dashboard to select a layout. Each change of a filter in the Configurator will result in a different and unique variant number. SuperKPIs layout can be then adjusted using the Selected Variant Parameter.
STEP 2: Connect Your Data
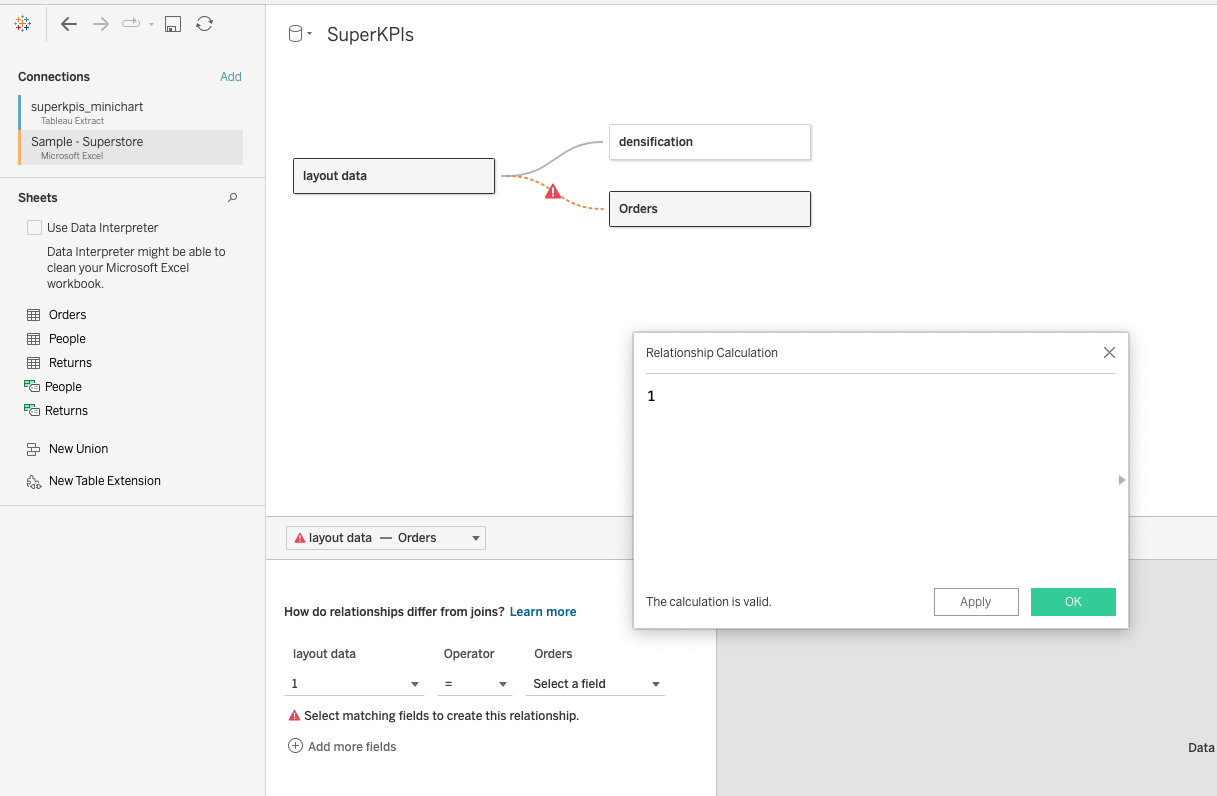
Connect your data on the data source page with a relationship calculation like 1=1.
STEP 3: Define KPIs
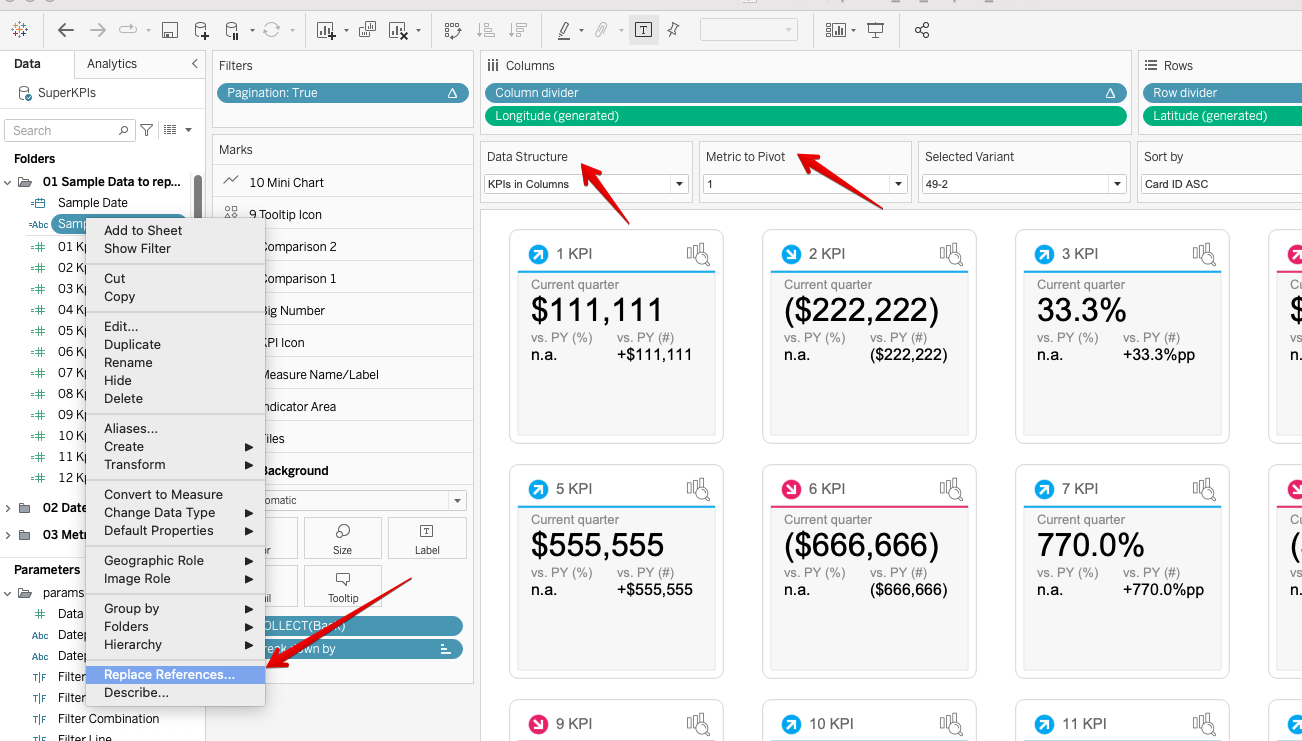
Go to Folder 01 Sample Data to replace and use the Replace References feature.
- Replace Sample Date with Your Date
- Replace 01 Kpi – 12 Kpi with your (Row-Level) Measures (Measures are directly mapped to Card Ids)
- Replace Sample Dimension with any Dimension from your data. This can be a dimension you want to break down your measures to further in the process.
Use the Data Structure Parameter to switch between looking at all KPIs (“KPIs in Columns”) or pivoting one KPI to the Dimension defined previously (“KPIs in Rows”). Use the Metric to Pivot Parameter to define the Metric to break down.
STEP 4: Date Calcs
Go to Folder 02 Date calcs and adjust calculations according to your business logic. Date calculations are connected to the Datepart parameter (for all KPIs in the view) and to the Datepart_chart Parameter (for the trend charts) to select the date aggregation to work with (year, quarter, month, week, day)
- Max Date: Calculates the maximum date in the data source and updates the Max Date parameter.
- Is current period: Defines current period based on Max Date parameter and Datepart parameter.
- Is prior period: Defines prior period based on Max Date parameter and Datepart parameter (YoY by default).
- Is chart period: Defines relevant periods for minicharts based on Max Date parameter, Datepart_chart parameter, and Periods shown parameter.
- Datepart_view: Selected datepart for the view
- Date_tooltip: Date used in Tooltips
STEP 5: Adjust Metrics
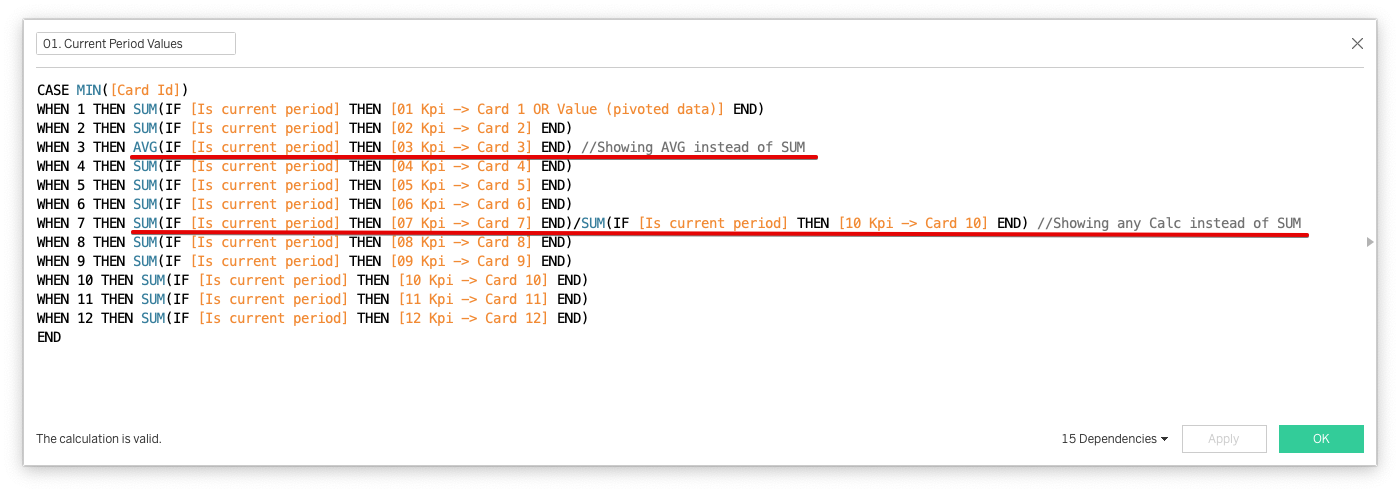
In most cases, there will be a need to further adjust your KPIs and define aggregations (SUM, AVG, …) and calculations (like ratios) specifically.
Go to folder 03 Metrics and adjust calculations and/or aggregations for:
- 01. Current Period Values
- 02. Prior Period Values
- 03. Chart Values
- 09. Chart Values (Targets) (if applicable)
Adjust Number Formats in 06. Big Number, 07. Comp 1 and 08. Comp 2 and implement in the view as needed.
STEP 6: Features
Go to folder 04 Features and adjust calculations as needed:
- Adjust Measure Names (if using KPIs in Columns data structure) to change Metric Labels used in the view.
- Adjust Color_any_object based on metric-specific color logic (is increase good or bad)
- Adjust Sort and Sort by Parameter to implement other sorting logics
STEP 7: Layout Options
On the dashboard, set the predefined layout options to your preference.
Optional Settings and Advanced Features
Tooltips
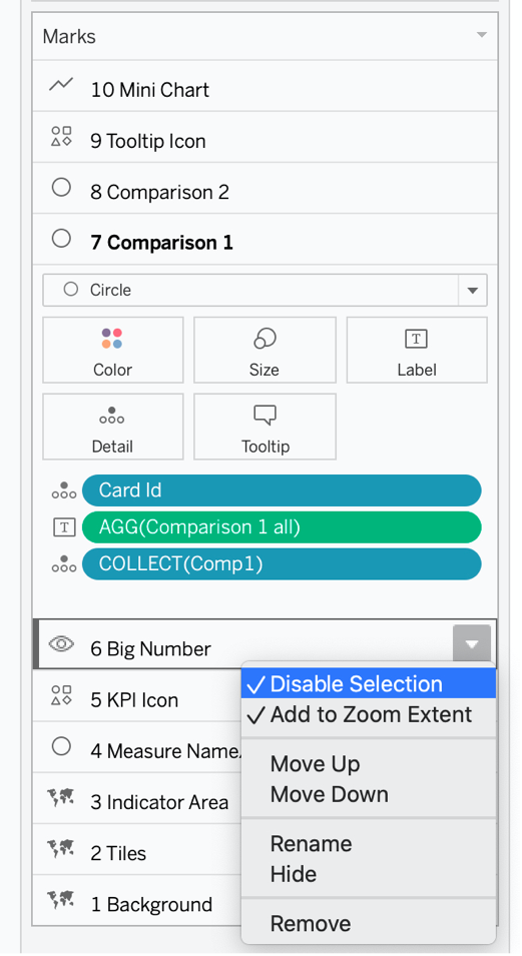
You can also add tooltips to every component/layer of the KPI cards.
By default, tooltips are only implemented for the tooltip icon at the top right of each card. If you want to add tooltips for more components, enable selection for the respective layer first:
Dashboard Actions
Instead of viz-in-tooltips, use Dashboard filter actions to jump to separate sheets or dashboards, to further drill into the KPI you’re looking at. Break down by is the field that has to be implemented on all sheets/dashboards.
Mobile Layouts
SuperKPIs are not yet fully responsive. But it takes just a few steps to create mobile layouts.
- Change the number of columns in the Total Columns Parameter.
- Use sheets on designed-for-mobile dashboards.
Color
Go wild with colors! You can customize colors in SuperKPIs to your absolute will. Implement your organization’s color palette, and use color to encode further information.
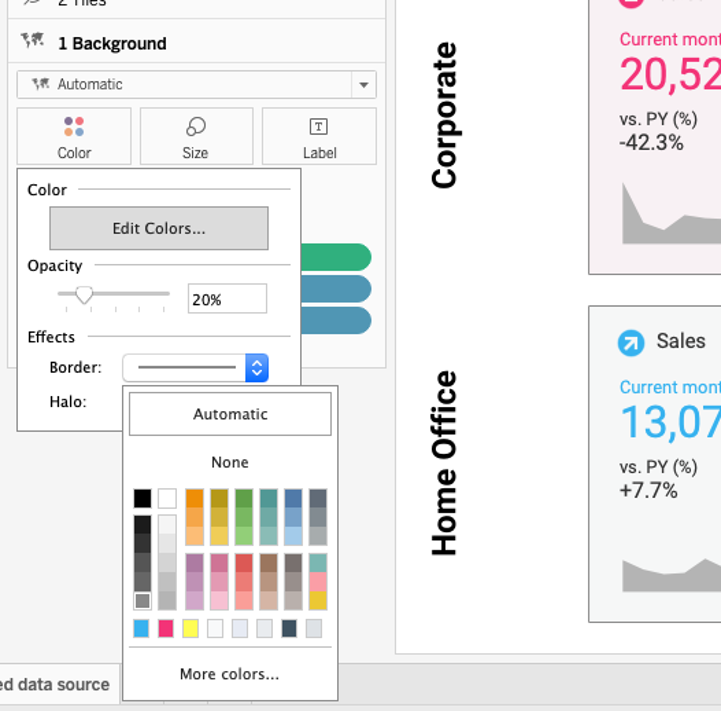
Borders
Use borders on the tile and on the background layer to create different designs of your KPI cards.
Format Options
Use all available Format options to create unique designs:
- Fonts
- Shadings/Background Color
Performance Optimization
SuperKPIs run at a decent performance. If you feel the need to further improve query and load time, consider the following simple rules:
- Use the KPIs in Rows Data Structure
- Extracts > Live connections
- Extract Filters > Data Source Filters > Quick Filters
- Limit the number of Quick Filters in the view
- Hide unused fields
- Run Workbook Optimizer
Published Data Sources
SuperKPIs requires by default a data model using a relationship between our layout data tables and the kpi data table itself, which is not yet supported for published data sources.
If you want to use SuperKPIs with your published data sources, please reach out to us for our PDS enabled version of SuperKPIs (not available as a trial).
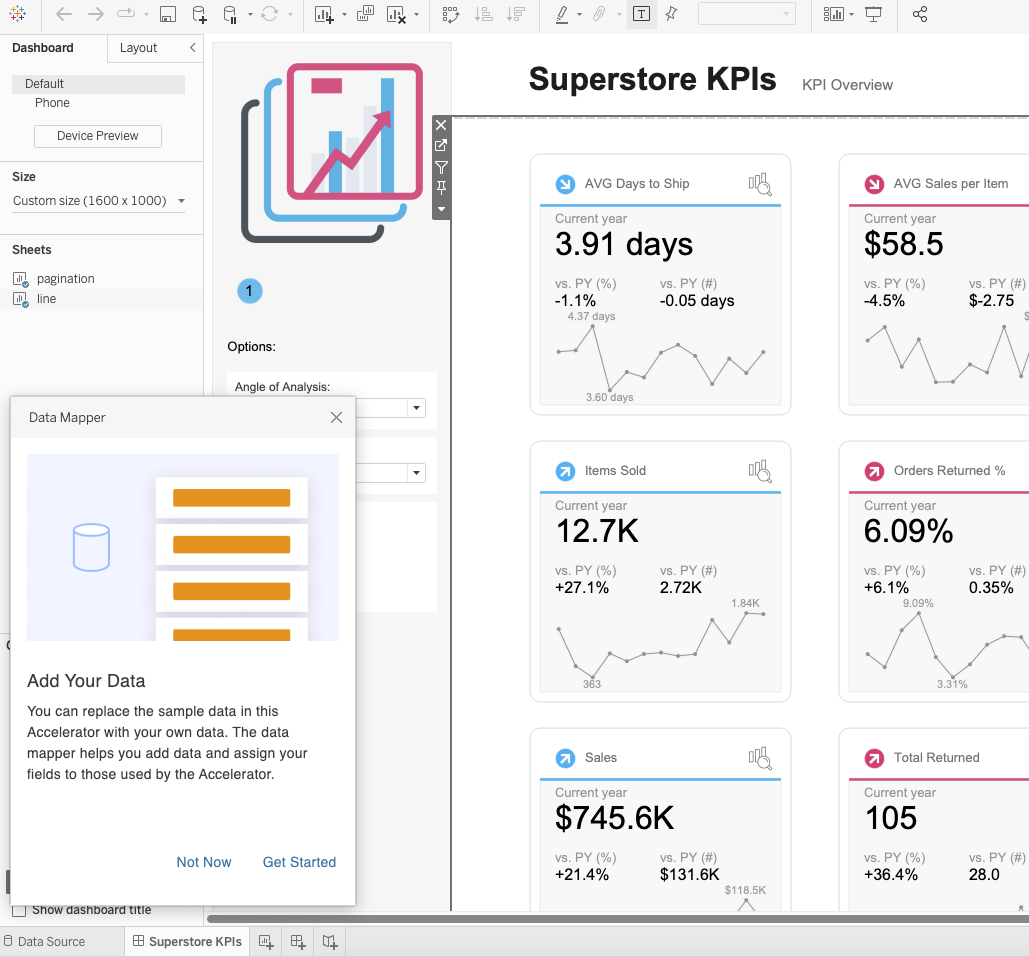
Data Mapping
By default Data Mapping is enabled for all our templates. You can build your data models including the layout data table and safe them as a .tds file. Then use the data mapping dialogue to change data sources.
Contact us for more support on this.
FAQ
Yes, you can request more information by filling in the form on the pricing page.
Yes, the on-premises version does not require an internet connection to work.
Of course! Our products thrive on customer feedback, feel free to contact us with your feature requests.
Yes, you can contact sales at any time to upgrade or extent your license.
No, that is not necessary. SuperKPIs workbooks work with extracts that can contain your own data.
We currently have three templates: Normal transactional data where KPIs are in the columns. We have pivoted data, so if you have your KPIs in one column and the values of the KPIs in a different column and we have an aggregated pivoted, more advanced layout, which is also possible. If you have different use cases; we are up for a challenge if you have more use cases!
We are working with map layers and they are available since 2020.4, so that’s the minimum version you need to work with.
You can change everything as it is native Tableau!
We support transactional data, Pivoted data, and aggregated pivot data, and we are open to more challenges of course!
It is the same behavior like other Cross-db relations
Everything is one worksheet

