Innovating in the fast-paced world of fintech with ShowMeMore
TradeSmith allows individual investors to manage their portfolio with hedge fund-level insights. Discovering ShowMeMore, they found a game-changer that not only saved time but also simplified complex tasks, making data insights accessible to all. This Tableau Extension empowered their team to effortlessly create a variety of charts, impacting their ability to present insights during management meetings.
About TradeSmith
The mission behind TradeSmith is to put easy-to-use, technology-based tools into the hands of individual, self-directed investors. TradeSmith began as a simple way to track portfolios using trailing stops, and has evolved to become a powerful suite of risk-management and portfolio analysis tools. Ideas by TradeSmith bring the most successful and proven investment strategies directly to your fingertips. Crypto by TradeSmith puts crypto algorithms to work for you. These algorithms and research tools help you navigate the volatile world of cryptoasset investing – for greater profits with less risk.
Create complex data visualizations
With the company’s rich data resources and team of talented analysts, they searched for a way to supercharge their Tableau Dashboards and create new charts more easily and less time-consuming.
Simplifying the process and gaining deeper insights
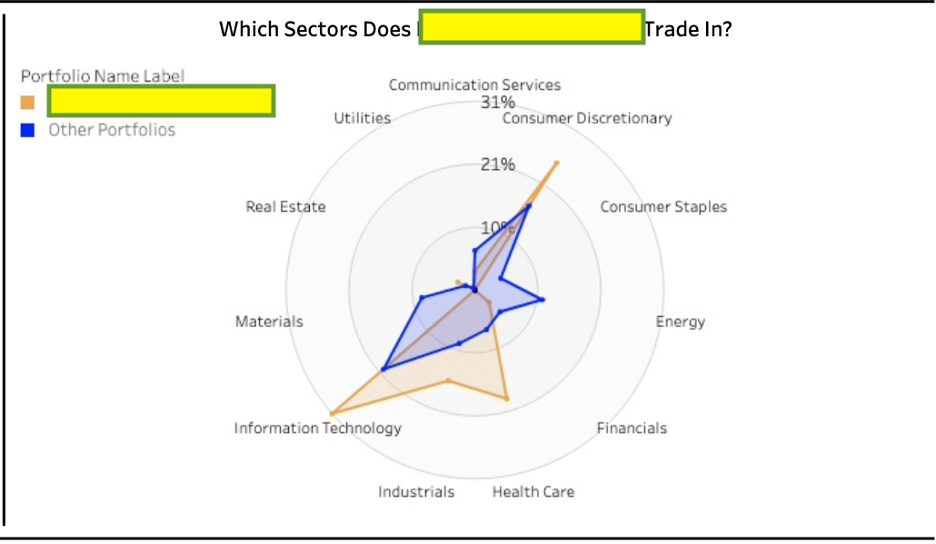
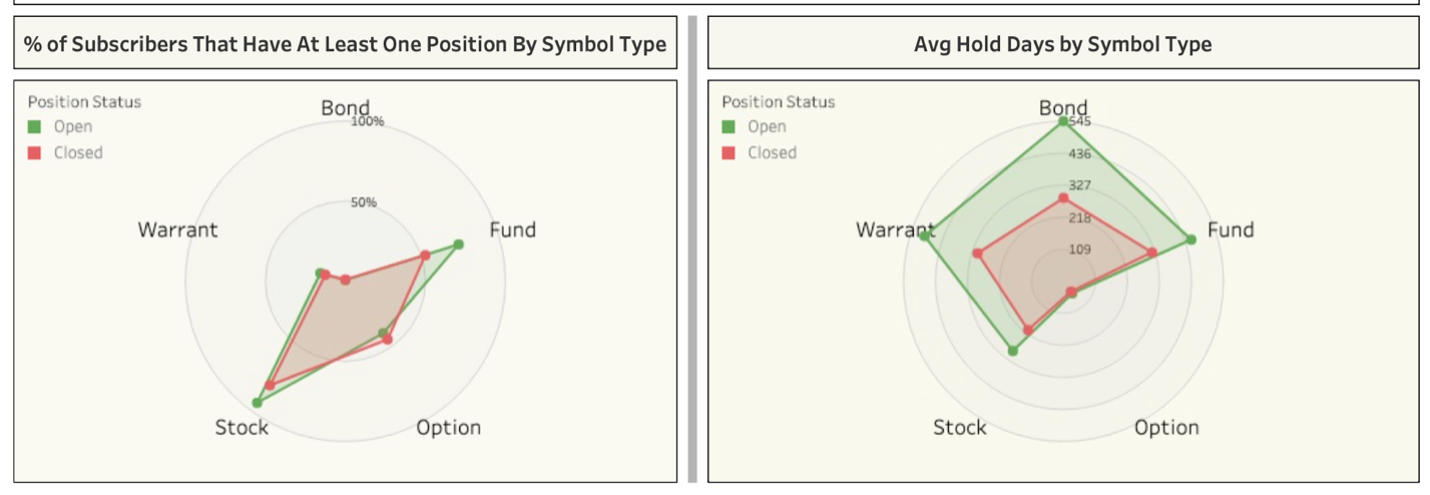
Discovering the ShowMeMore Extension, they found a new way to simplify the creation of Radar Charts and other complex data visualizations. The implementation turned out to be a smooth process and the company’s representative started using the Extension to create various types of charts allowing for deeper insights into customer behaviour. This helped with improving portfolio tracking and sophisticated risk management strategies which could now effortlessly be presented during management meetings.
Bringing efficiency to processes
In conclusion, TradeSmith’s journey with ShowMeMore has been transformative, as this Tableau Extension proved to be a game-changer, streamlining complex data visualization taks and bringing efficiency to their processes. ShowMeMore enabled their team to effortlessly create a variety of charts, leading to the ability to present critical insights during management meetings.

“Tableau is in my opinion the best BI tool for building high quality data visualizations and dashboards. Instead of having to create time consuming and complex workarounds to accomplish out of the box charts like Radar charts, Calendar charts, Sankey charts, etc. ShowMeMore allows me to build them quickly and easily, saving me a lot of time and headache.”