DashboardUsage Product Guide
- The initial setup of the extension
- How to use event tracking
- How to use client tracking
- How to use extension tracking
Initial Setup
To start using the extension, make sure you have everything installed and running. If this isn’t the case, please take a look at the installation guide.
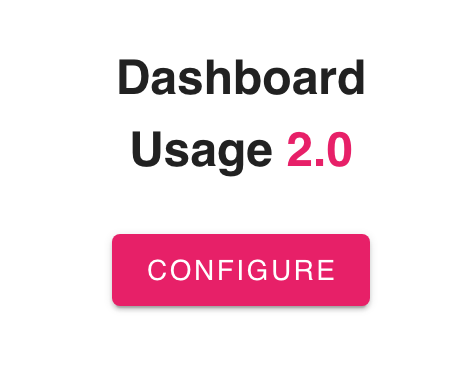
If everything is up and running, simply drag the extension object onto your dashboard and select the Dashboard Usage extension’s .trex file. You will be welcomed with the “Dashboard Usage” title and a “configure” button. Hit the button to do the initial setup. Important fields to fill out for the initial setup are:
- Workbook name
- Username
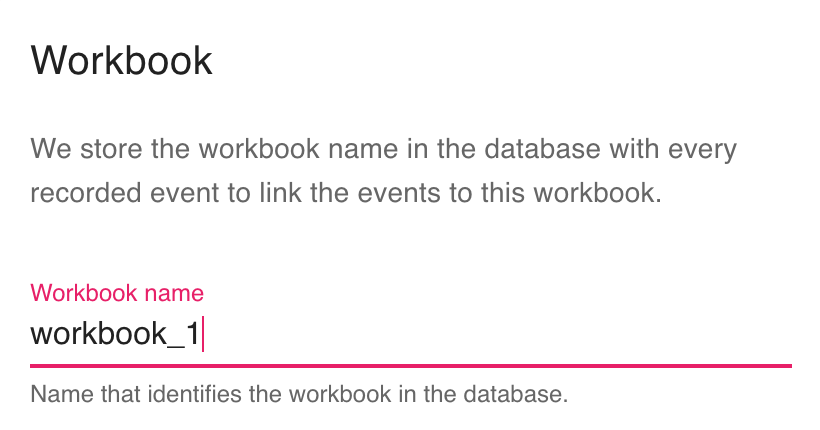
Workbook name
The workbook name is the name that will be stored in the database which refers to the current workbook. Choose a name that is unique to the workbook and that will be recognisable to users that will perform analytics of the gathered data. Your Workbook name will not be filled automatically, you have to come up with a plausible name.
When no workbook name is specified, the value for ‘workbook_name’ will be empty.
Username
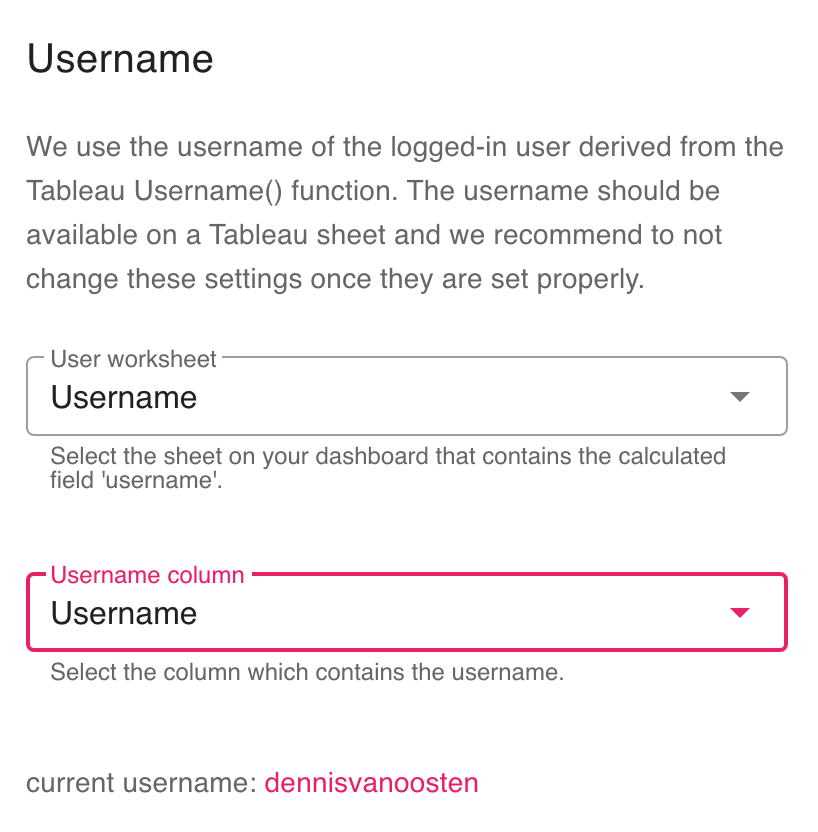
The username is a dynamic value and will log the current Tableau username. To link the correct data to this field, you first need to create a calculated field that contains the standard Tableau ‘USERNAME()’ function. This function retrieves the username of the logged in user. Place this new calculated field onto a worksheet and drag the sheet on your dashboard as well. (the sheet containing the username must be available on your dashboard but you can hide it by making it floating and resize it to 1×1 pixel). In the configuration of Dashboard Usage, you have to specify which worksheet and column contains the username. You can verify correct implementation by checking the ‘current username’, right in the Dashboard Usage configuration.
When you do not specify a username column, the value for ‘username’ will be ‘unknown’.
Event tracking
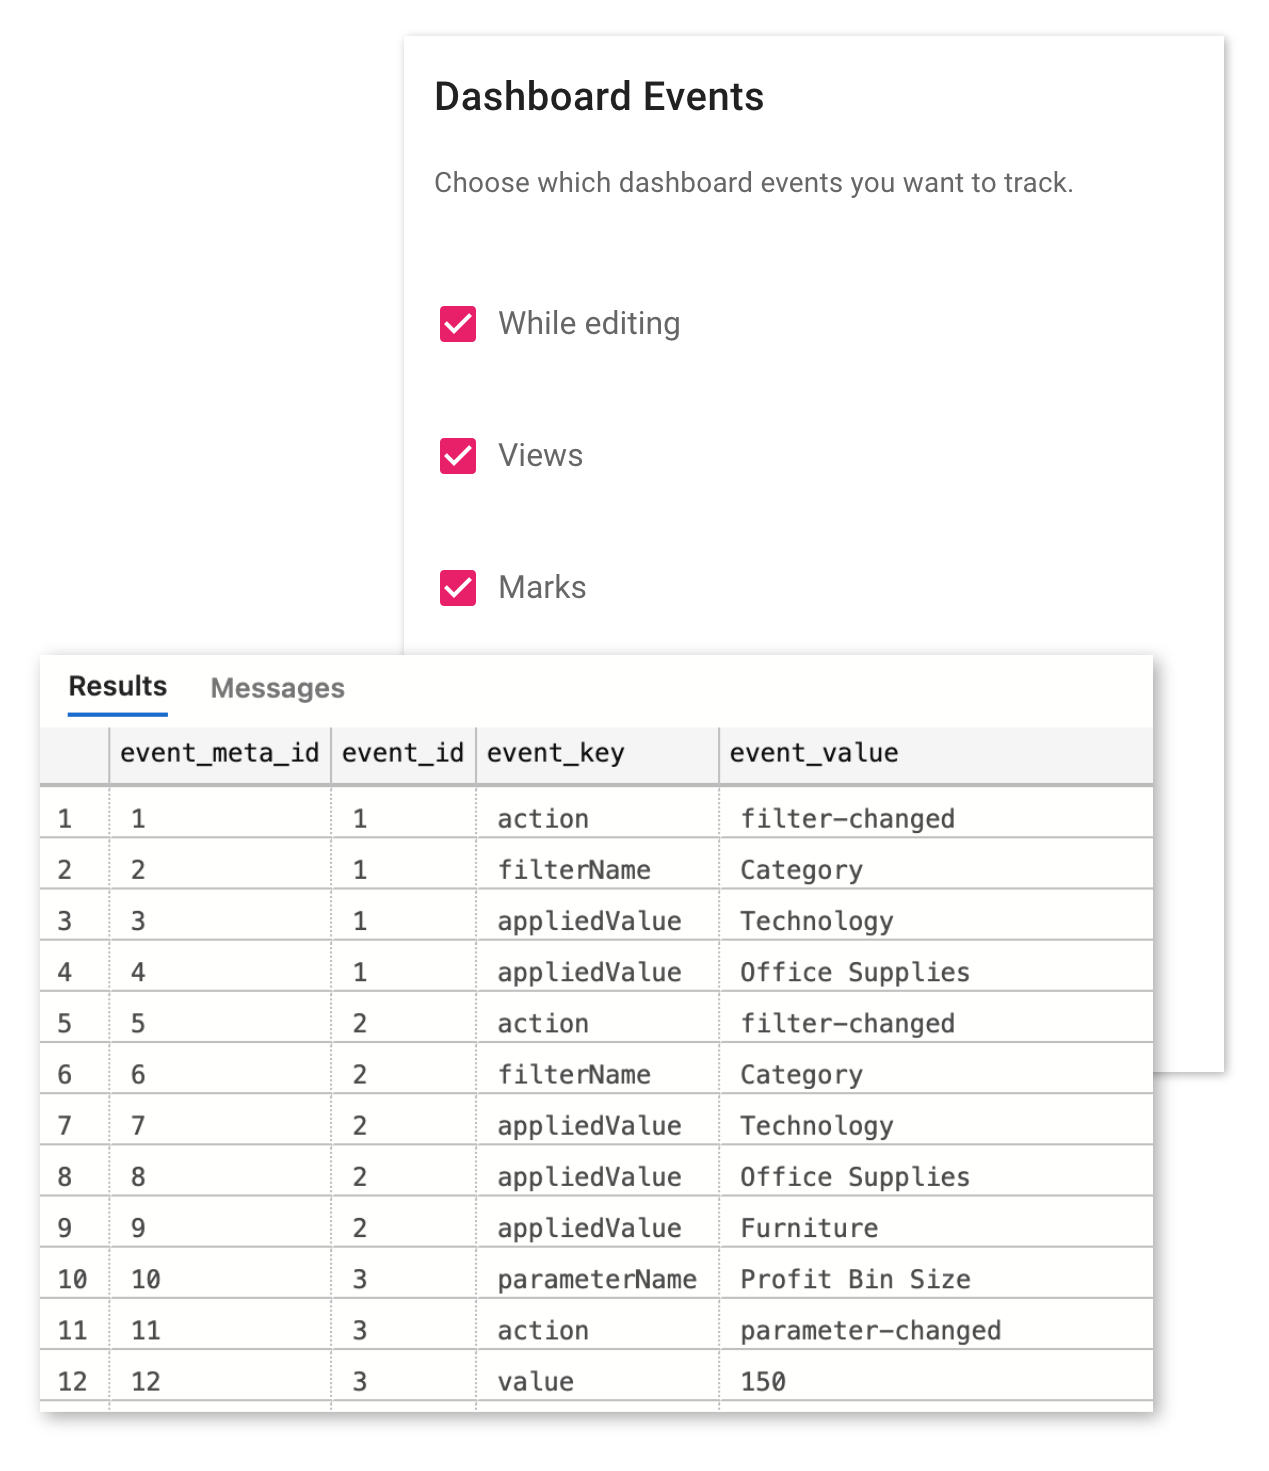
In the Dashboard Usage configuration pane, you can find options to customize how you want the dashboard events to be logged into your database. The following options are available in the Event tracking section of the configuration pane.
- While editing (whether or not to track events while editing the workbook)
- Views (track views)
- Marks (track mark selections)
- Filters (track filter changes)
- Actions (track use of dashboard actions)
- Parameters (track parameter changes)
The information logged for every event is different, even for the same type of event. For example; a range filter will log a different set of data than a categorical filter.
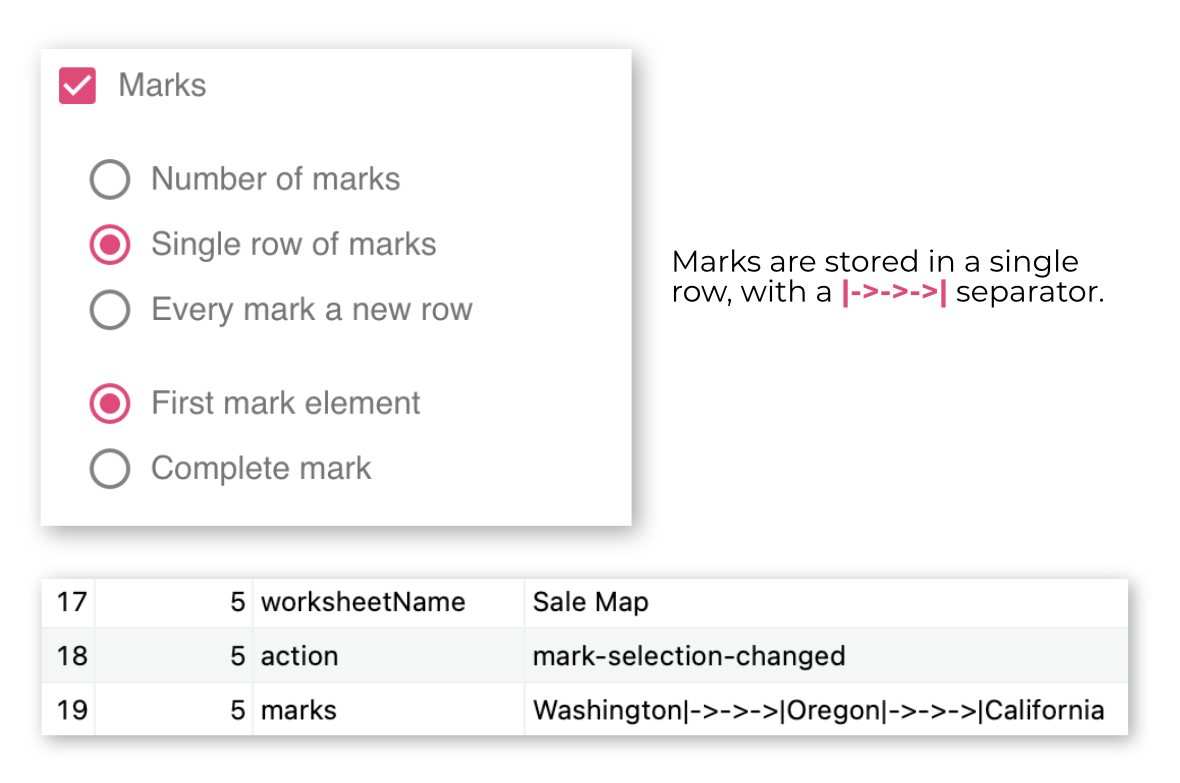
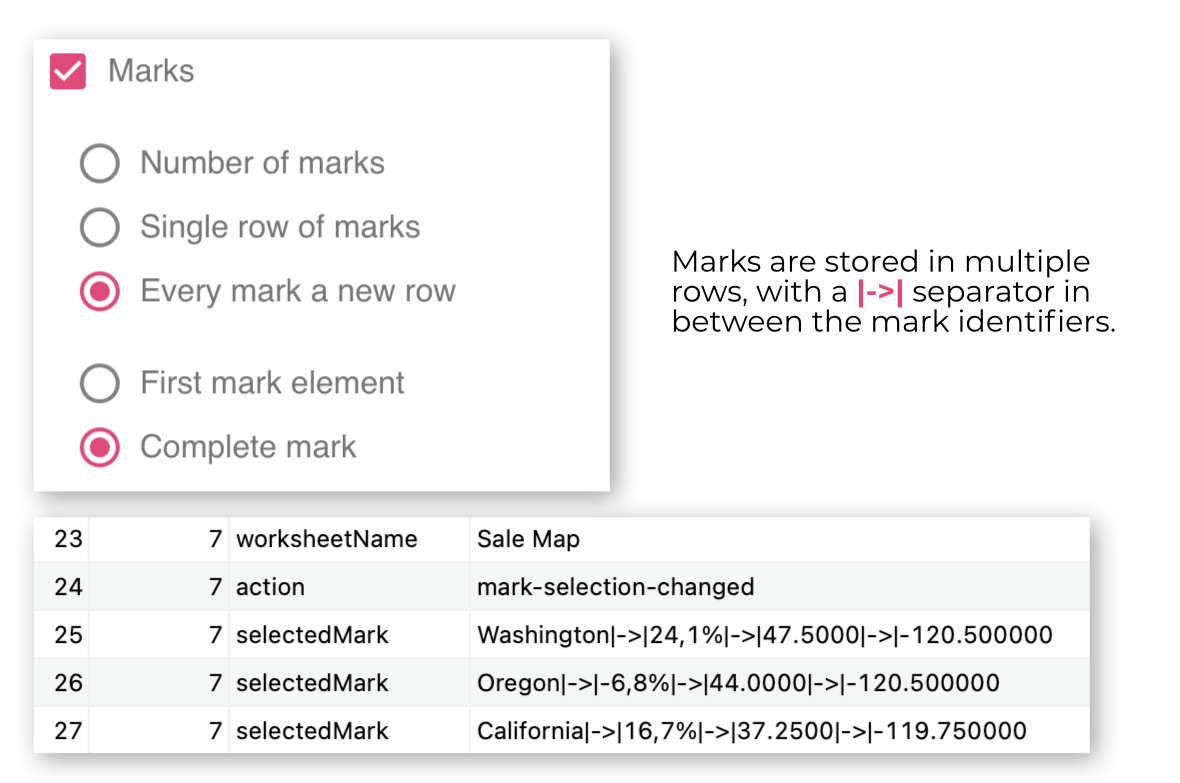
For mark, filter and action tracking you can specify how to store the data. As standard, all values are stored in a single row (a record). However, you can choose to only store the number of values or store every item on a new row. Additionally, you can choose to store the full mark information or only its first identifier. When storing all values in a single row, different items will be separated by the following characters: |->->->|. When storing the full mark path, mark items will be separated with the following characters: |->|. For a visual explanation, see the images below.
In summary, These configurations help you to define the granularity of logged information from the dashboard usage. It’s up to you to decide what kind of information you need to track from users of the dashboard extension, to formulate actionable information.
Client tracking
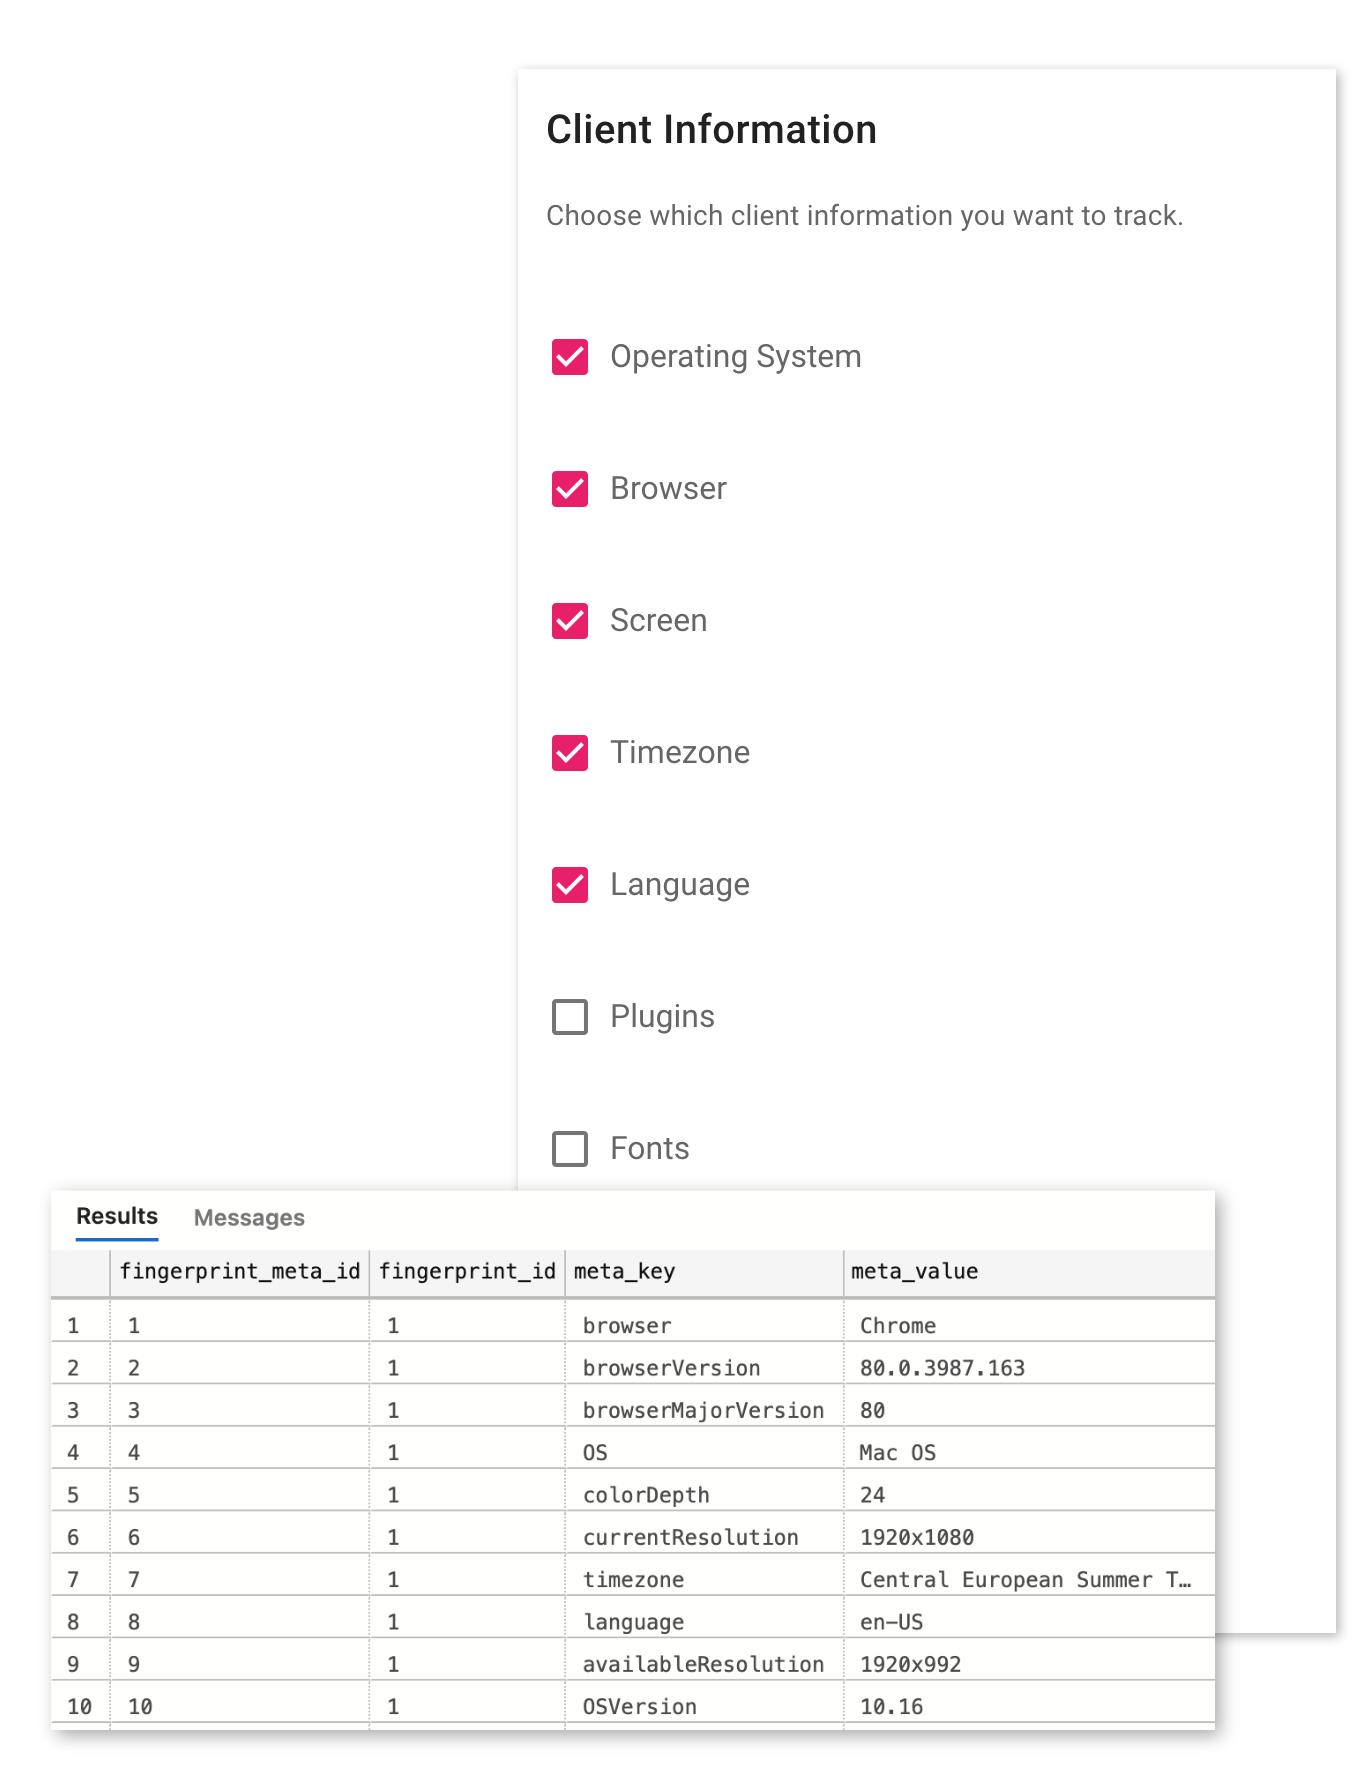
In the Dashboard Usage configuration, you will find a card with the title ‘Client Information’. This configuration section will give you the choice to toggle on or off the following tracking options:
- Operating System (OS and OS version)
- Browser (browser, browser version and browser major version)
- Screen (color depth, current resolution, available resolution, device XDPI and device YDPI)
- Timezone
- Language (language and system language)
- Plugins (plugins, Java version, Flash version and Silverlight version)
- Fonts (installed fonts)
- Device (device, device type and device vendor)
- Mobile (is mobile, is mobile Android and is mobile iOS)
- CPU
For font information you can specify how to store the data. As standard, all installed fonts are stored in a single row (record). However, you can choose to only store the number of fonts installed or to store every font on a new row. When storing all fonts on a single row, fonts will be separated by a comma.
Extension tracking
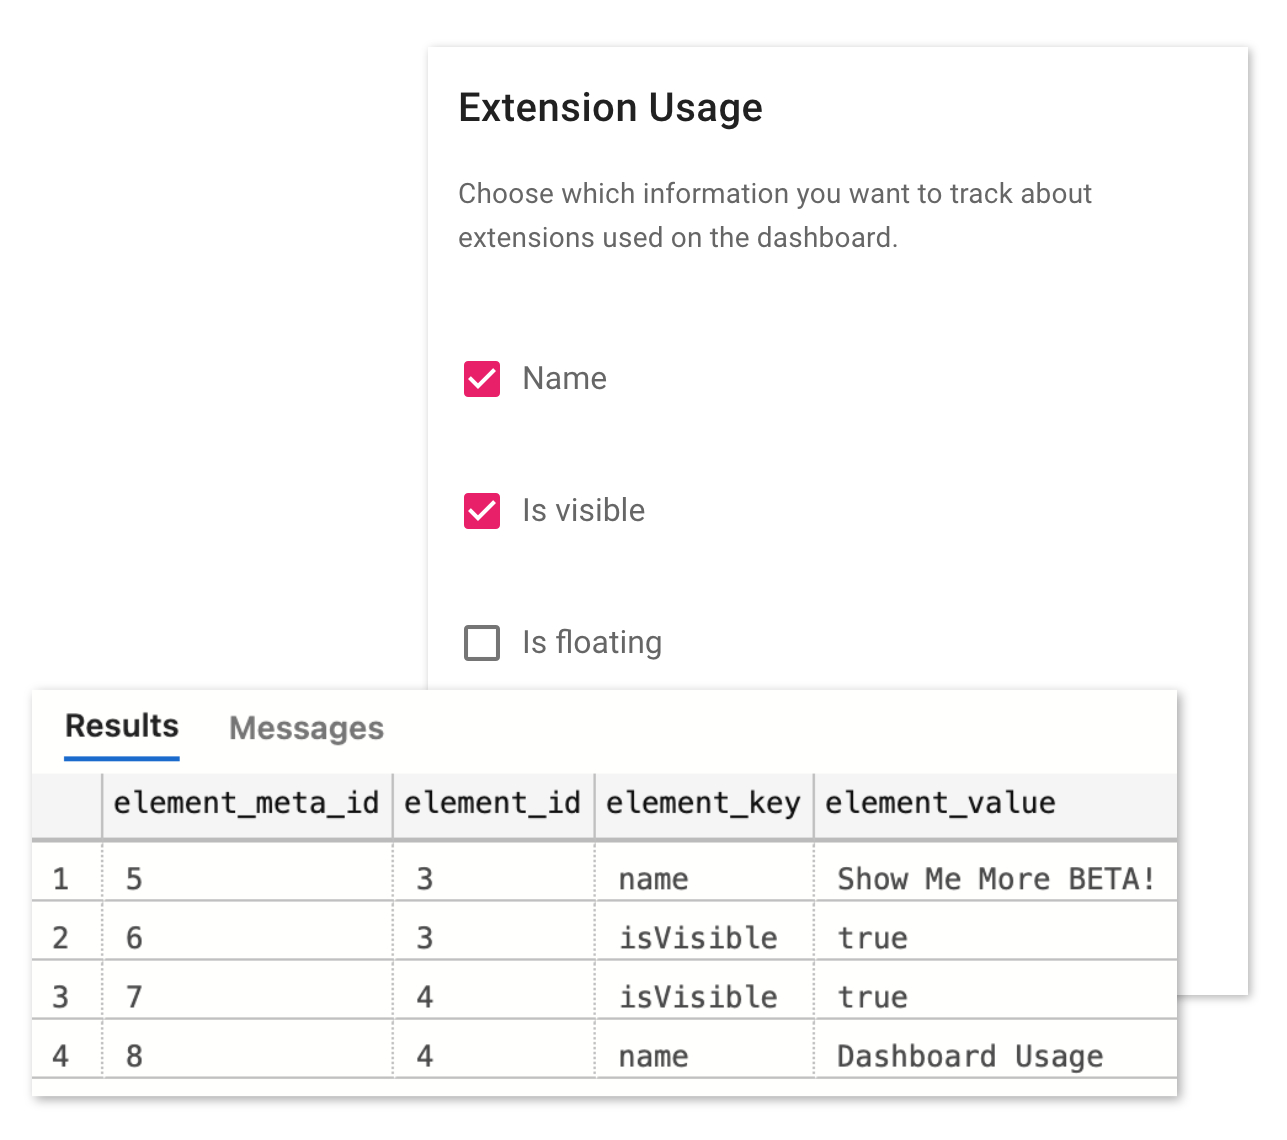
In the Dashboard Usage configuration, you will find a card with the title ‘Extension Usage’. This configuration section will give you the choice to toggle on or off the following tracking options:
- Name (name of the extension on the dashboard)
- Is visible (whether or not the extension is visible on the dashboard)
- Is floating (whether or not the extension is floating on the dashboard)
- Position (the position of the extension on the dashboard)
- Size (the size of the extension on the dashboard)
Analytics
All Dashboard Usage data will be stored in the (local) database you configured during the Installation process. To help you kick start gathering insights, we prepared a free Tableau analytics workbook. It comes included with in your .zip file when you download the extension.
The workbook connects to our demo database as standard. Credentials are:
username: demodemo
password: demodemo
The demo database has the exact same structure as the dashboard usage database, so integrating your own data is simple. Just replace the data connection with your own and you’re set.
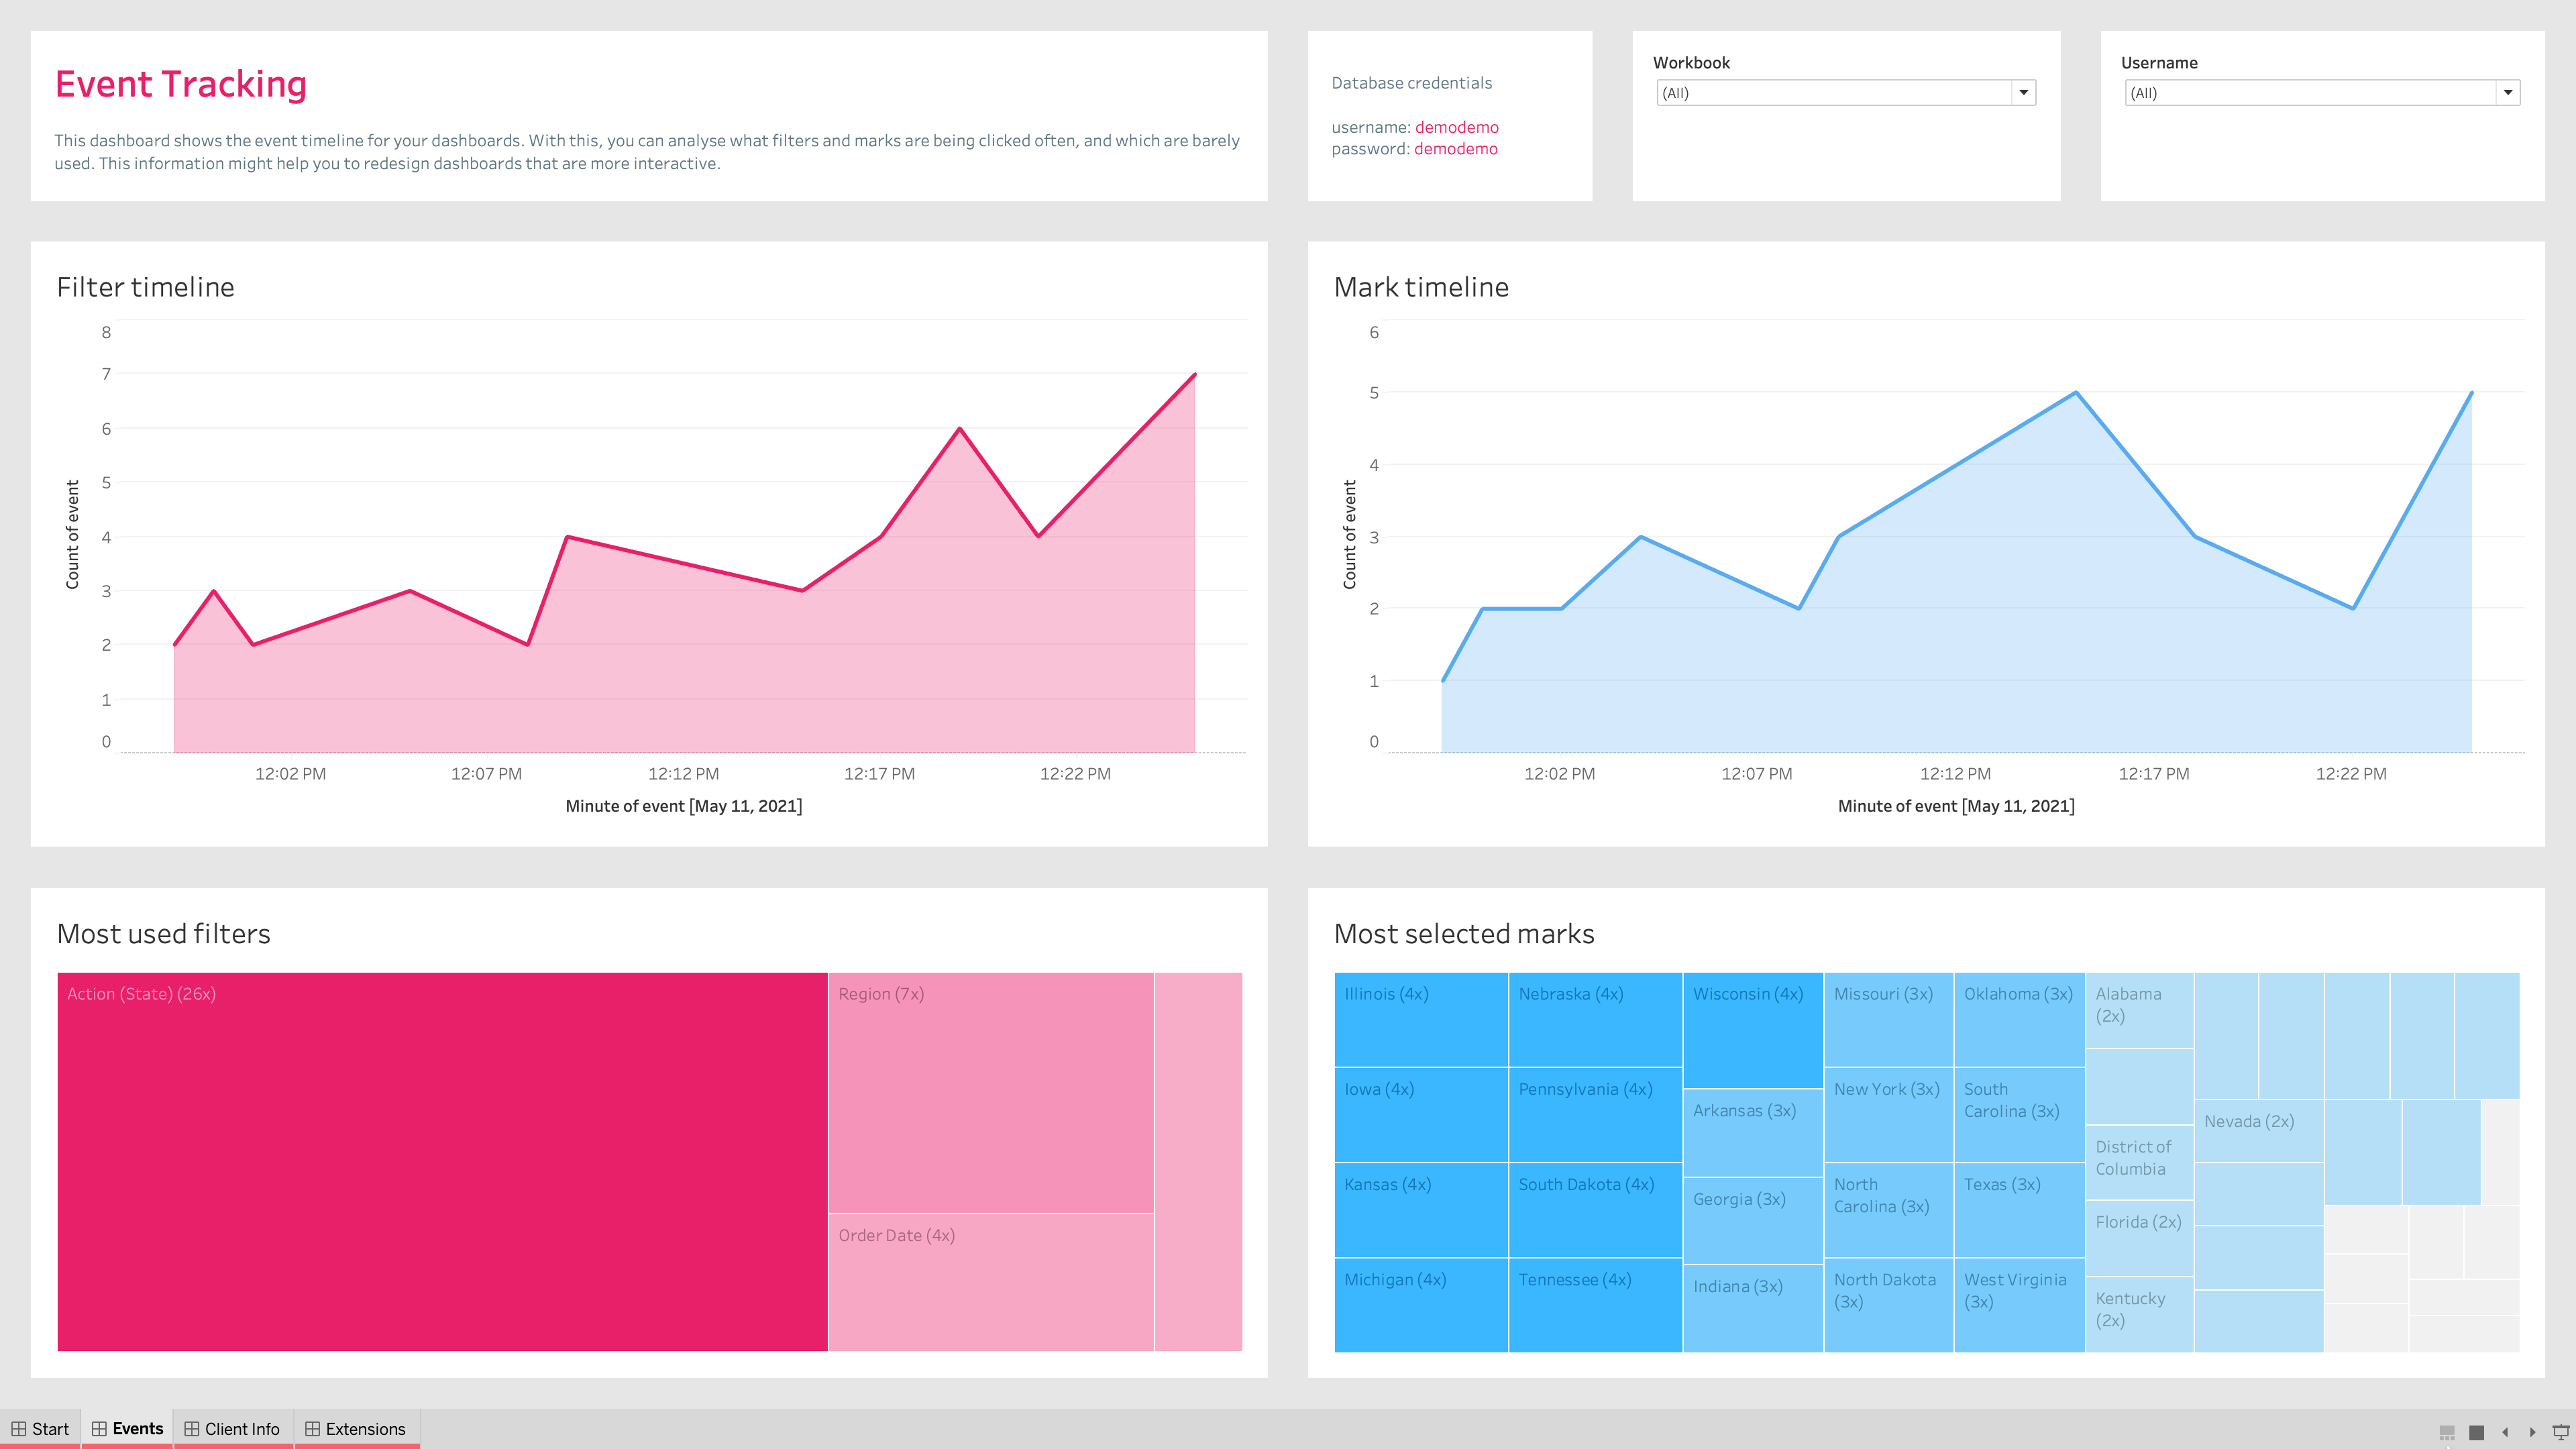
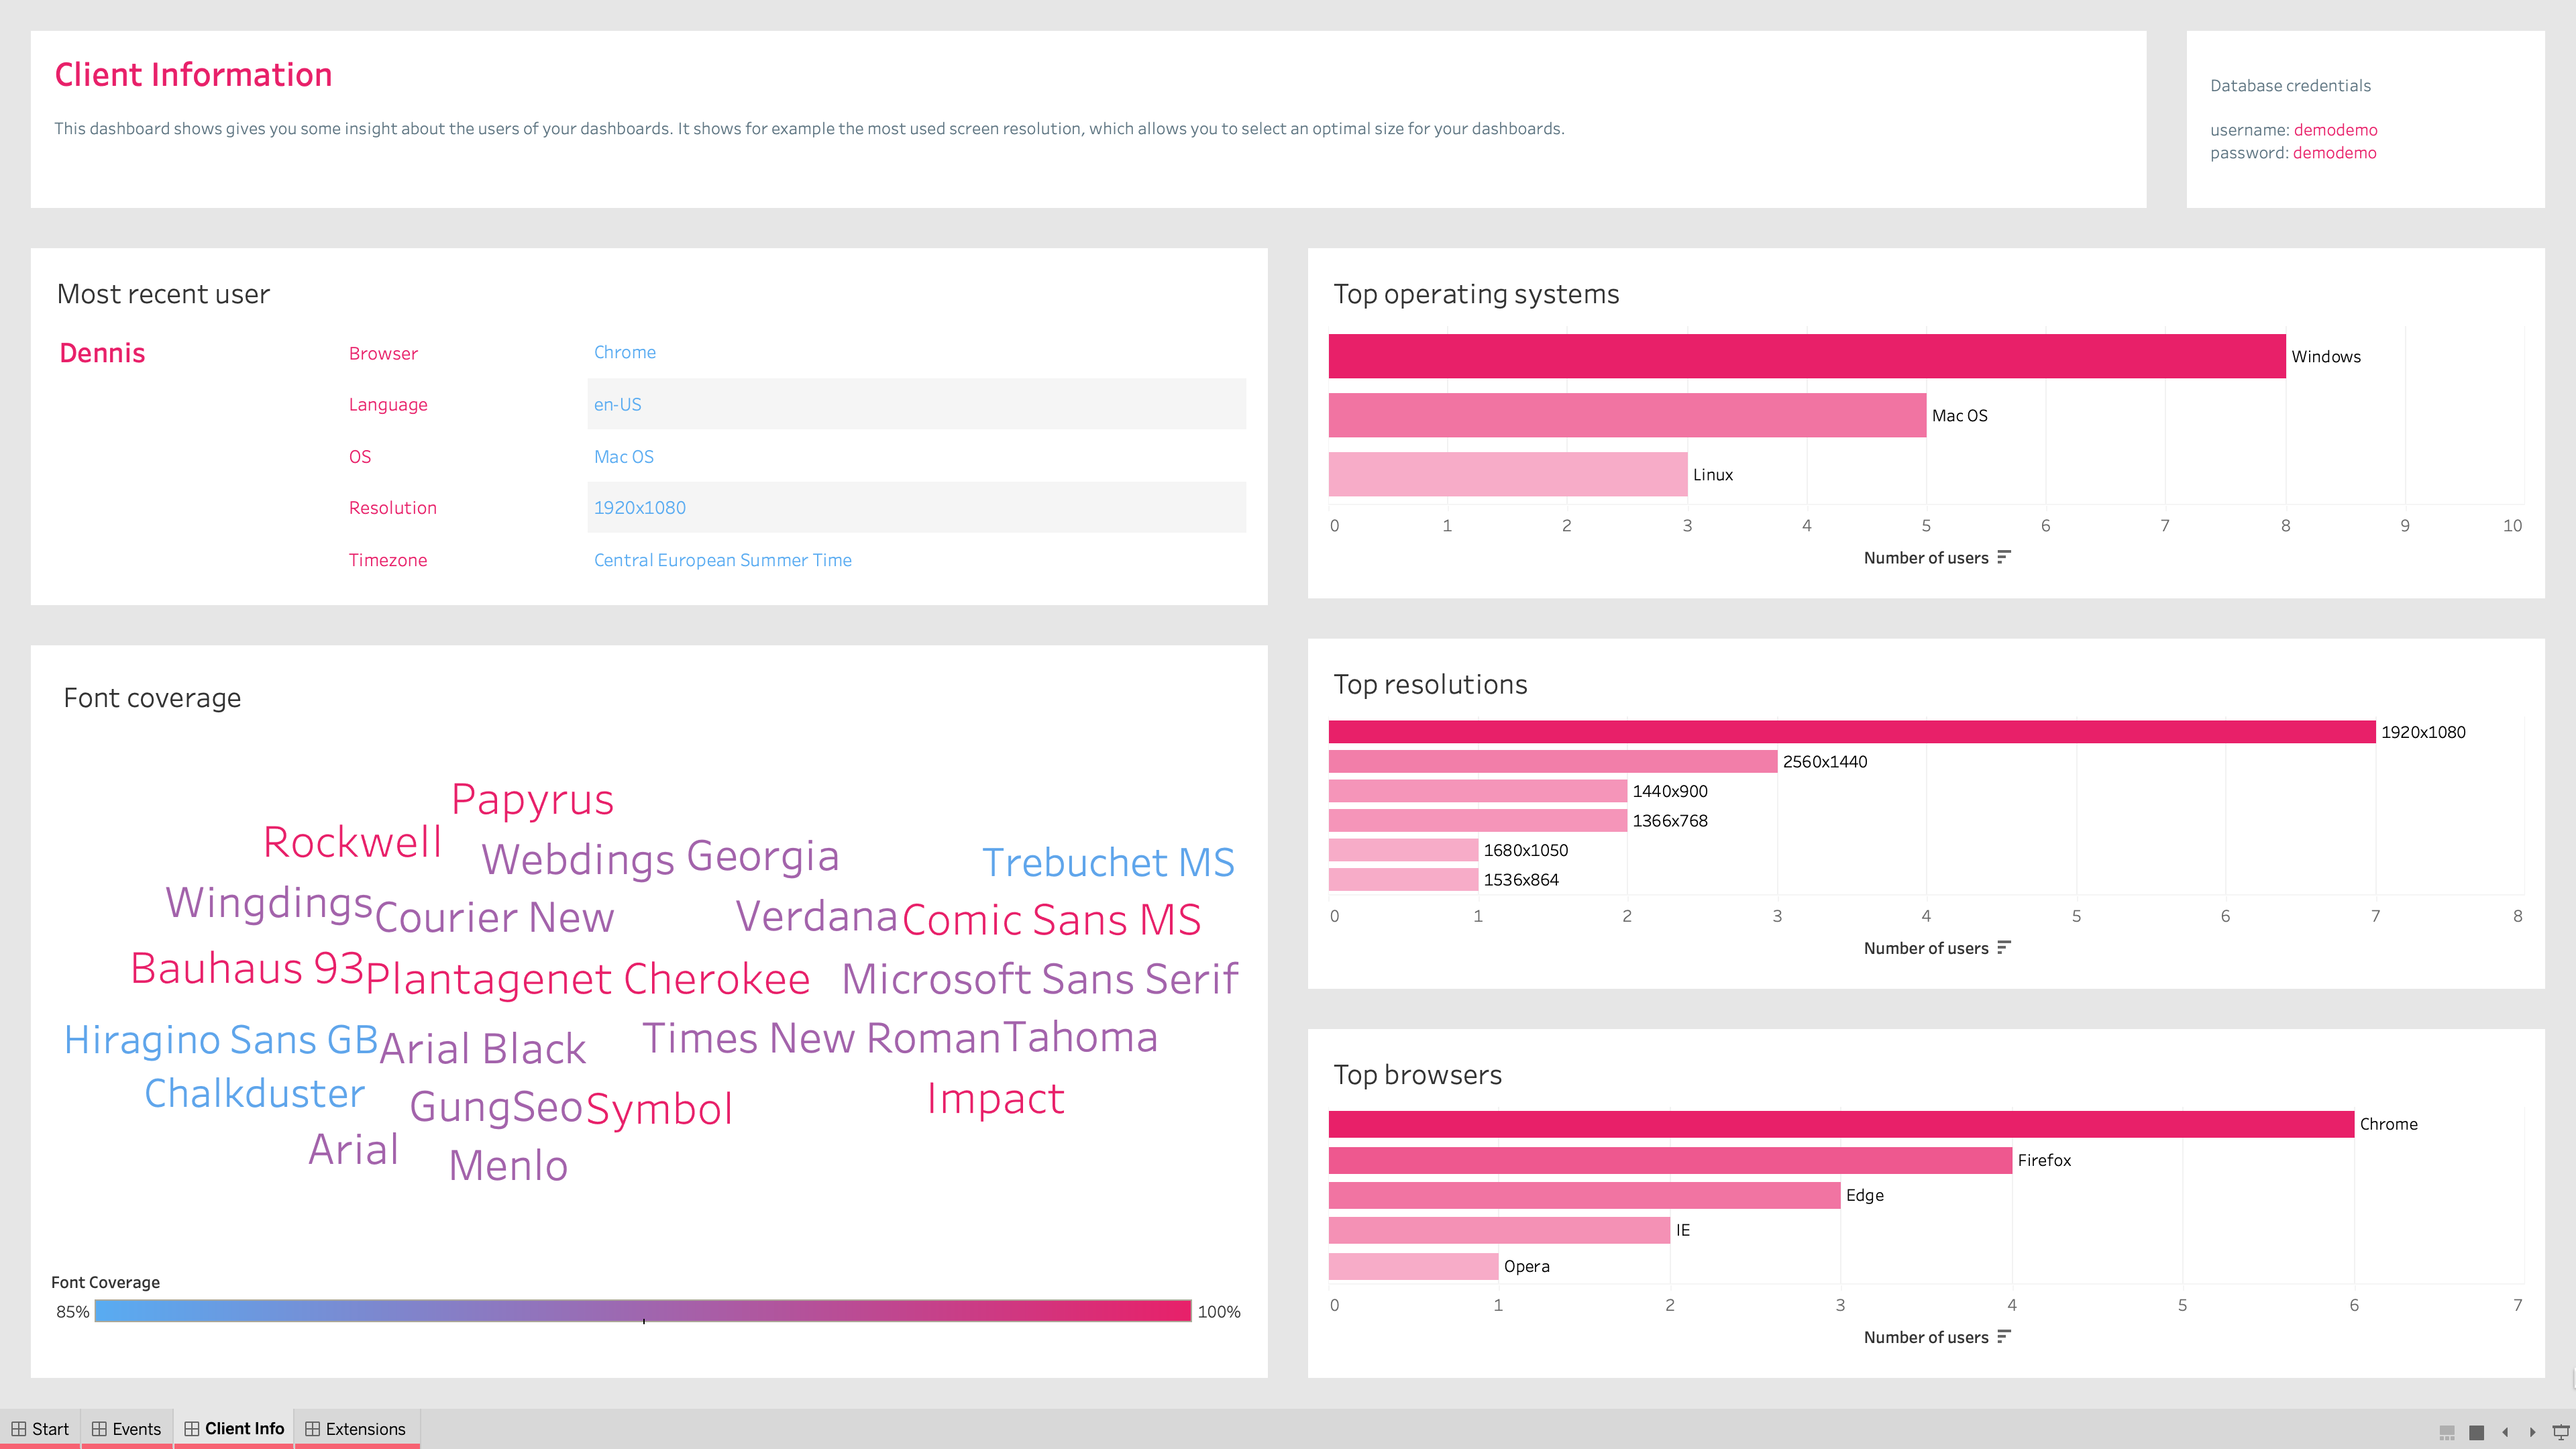
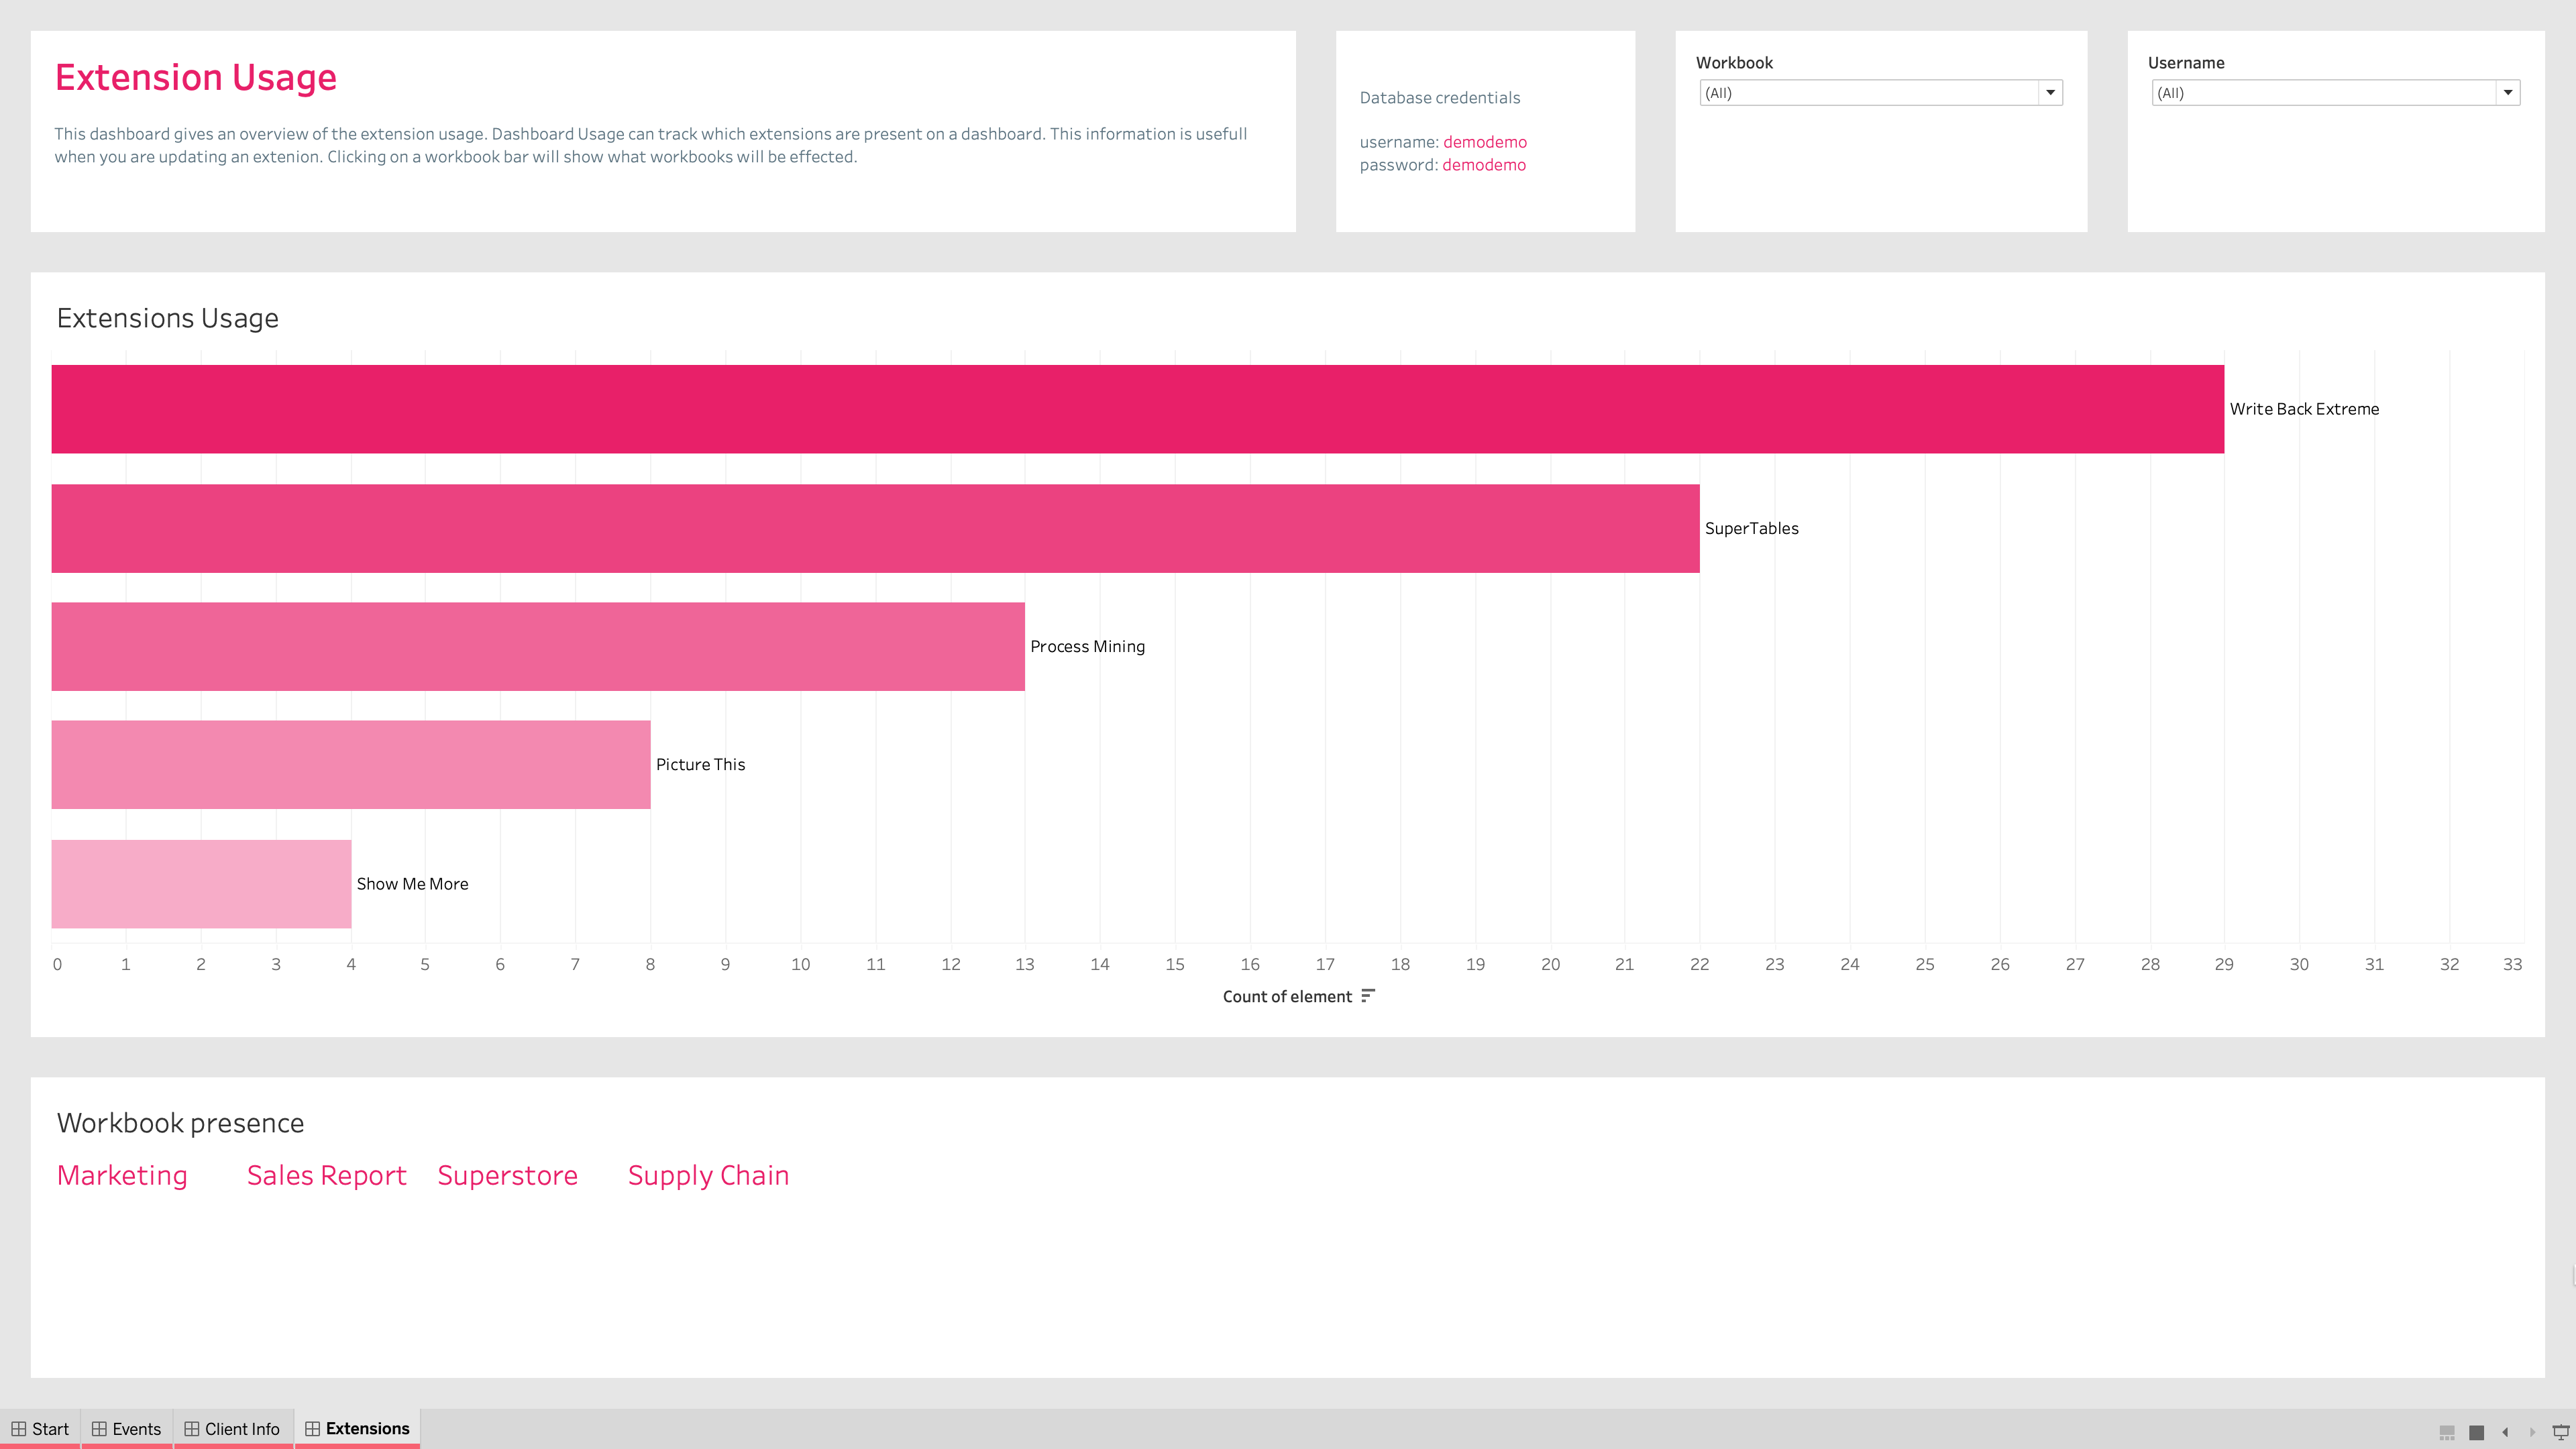
Dashboards in this workbook are:
- Events
- Client info
- Extensions
These respectively help you gather insights on dashboard events, user information and extension usage.
There is much more information that can be gathered from Dashboard Usage. We’re curious to see what you’ll do with it!
