
DrillDownTree Product Guide
DrillDownTree allows you to drill down on any measure to any dimension you wish. The extension offers a flexible DrillDownTree for dashboard users. It will let you visualize data across multiple dimensions without setting up Hierarchies upfront. It automatically aggregates data and enables drilling down into dimensions in any random order the user chooses without having to create Tableau hierarchies upfront. The DrillDownTree is a valuable tool for ad hoc exploration by your dashboard users and conducting root cause analysis in your Tableau Dashboards. It hugely contributes to the self-serviceness of your dashboard users in an easy and understandable self-guiding way.
Setting up your dataset
For best practice and to get the best performance on your dashboard, we recommend dropping the measure(s) and dimensions on to the detail of your marks card on a separate/new worksheet. This will give DrillDownTree the best performance and flexibility for dashboard actions. See the image below for an example of how to set up your datasheet to feed the extension. All dimensions available on the datasheet can be used in the users Drill Down path. For tips and advice check out our BLOG.
The datasheet needs to be on the dashboard. It is not the most pretty visualization so it is best to hide it for your dashboard users on the dashboard. To do so: Add the worksheet to your dashboard as a ‘floating’ container. Then edit the size to 1x1px (and the position also to the 1,1 x,y position). This will make your datasheet active on your dashboard without being shown.

Data and Calculations
Setting up the parameter
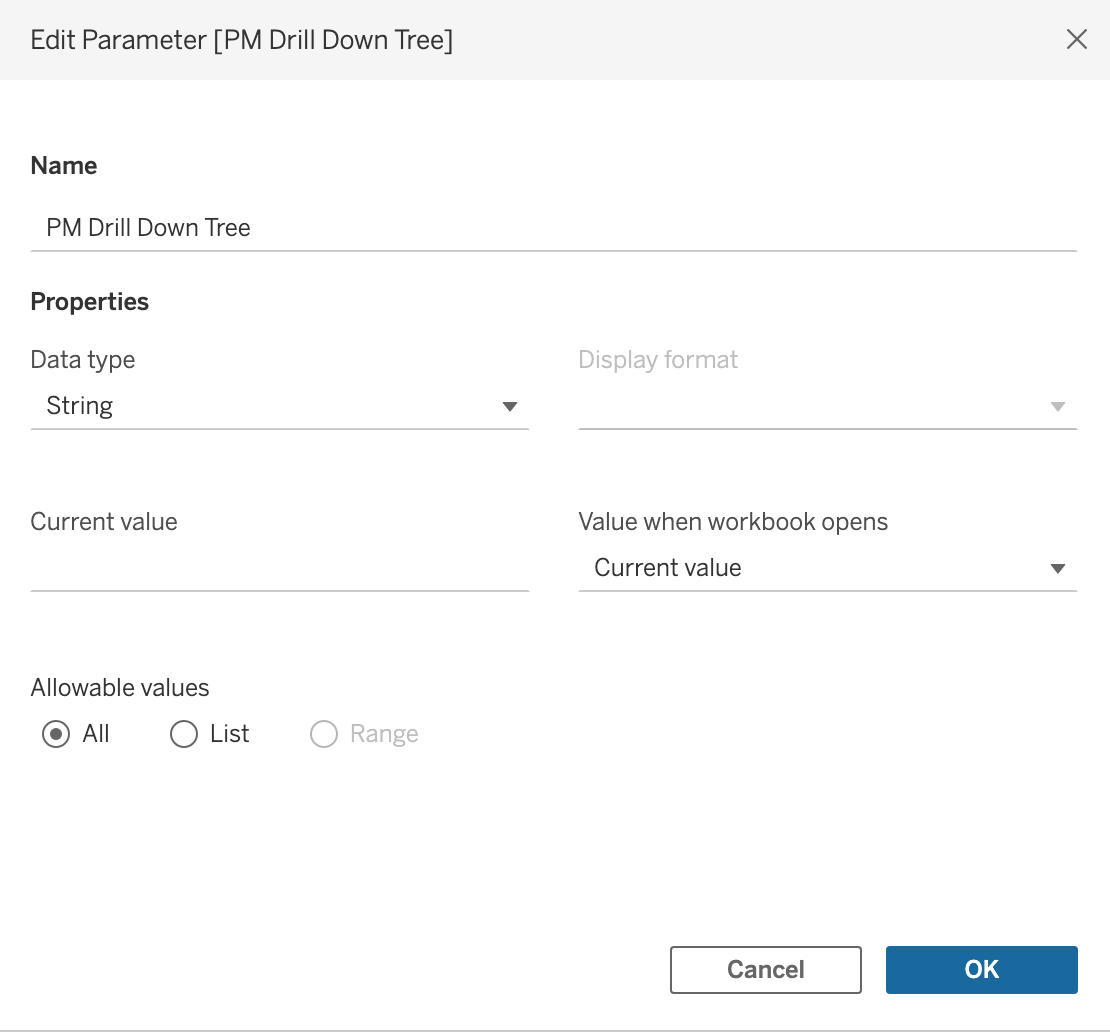
The DrillDownTree requires a parameter when configuring the extension. The parameter is needed to store the dashboard-user’s drill down path while working with the extension. To set up this parameter, choose a logical name you will remember and set it to the ‘string’ data type. Leave the current value empty and have ‘All’ under allowable values. If you are using multiple instances of the Drill Down tree in the same workbook, create a parameter for each instance, otherwise they will interfere with each other which might lead to unexpected behaviour. Below is an example of how to set up your DrillDownTree parameter.
Measures
The DrillDownTree allows your dashboard users to drill down on a measure via a path of dimensions they can choose themselves. Select your default measure, and which ones should be available through the measure selector. Measures can be excluded by removing them from the container.
The selected measures will be available through the measure selector in the lower-left corner of the extension. Click the Icon to expand the selector, select the desired measure and see your choice immediately reflected in the visualisation.
Calculations
Using the available measures, custom calculations can be created to allow for even more detailed analysis using DrillDownTree. These are non aggregated calculation as that function as a measure. Click on the pills or on the operators to add them to the text area. The calculation will be added to the measure switcher automatically.
Using DrillDownTree
There are plenty of features once you have configured your DrillDownTree that can help you get the most value in your viz.
Drilling Down
Once you have configured your DrillDownTree you will see your chosen measure in the view. Use the + button alongside your node to start drilling down. Clicking the + sign will show a dropdown with all the dimensions that are available to Drill Down on… You can do this on each node to drill down further. The animated gif shows how easy it is to populate your drill down path.

Remove a Dimension from your DrillDown path
You may have drilled down too far or just wish to go back a dimension to drill down on a different dimension. To do this, simply click on the header at the top of the view, to remove from your DrillDownTree view. You can even remove a dimension in the middle of your Drill Down path in the same way (just by clicking on it). The animated gif shows how easy your dashboard users can remove dimensions from the active drill down path.

Large Dimensions
There may be a time that not all the members of a dimension fit the view vertically. This will result in a node with the title “Other” Click on ‘Other’ where it will show the remaining members of the specific dimension that were not shown in the initial view. Below an example of the “Other” pill in your DrillDownTree.

Horizontal Scroll-bar
Drill down as much as you wish whilst keeping a beautiful viz using the horizontal scroller. This will appear once you have drilled on a few dimensions and the entire tree does not fit your container horizontally.

Formatting
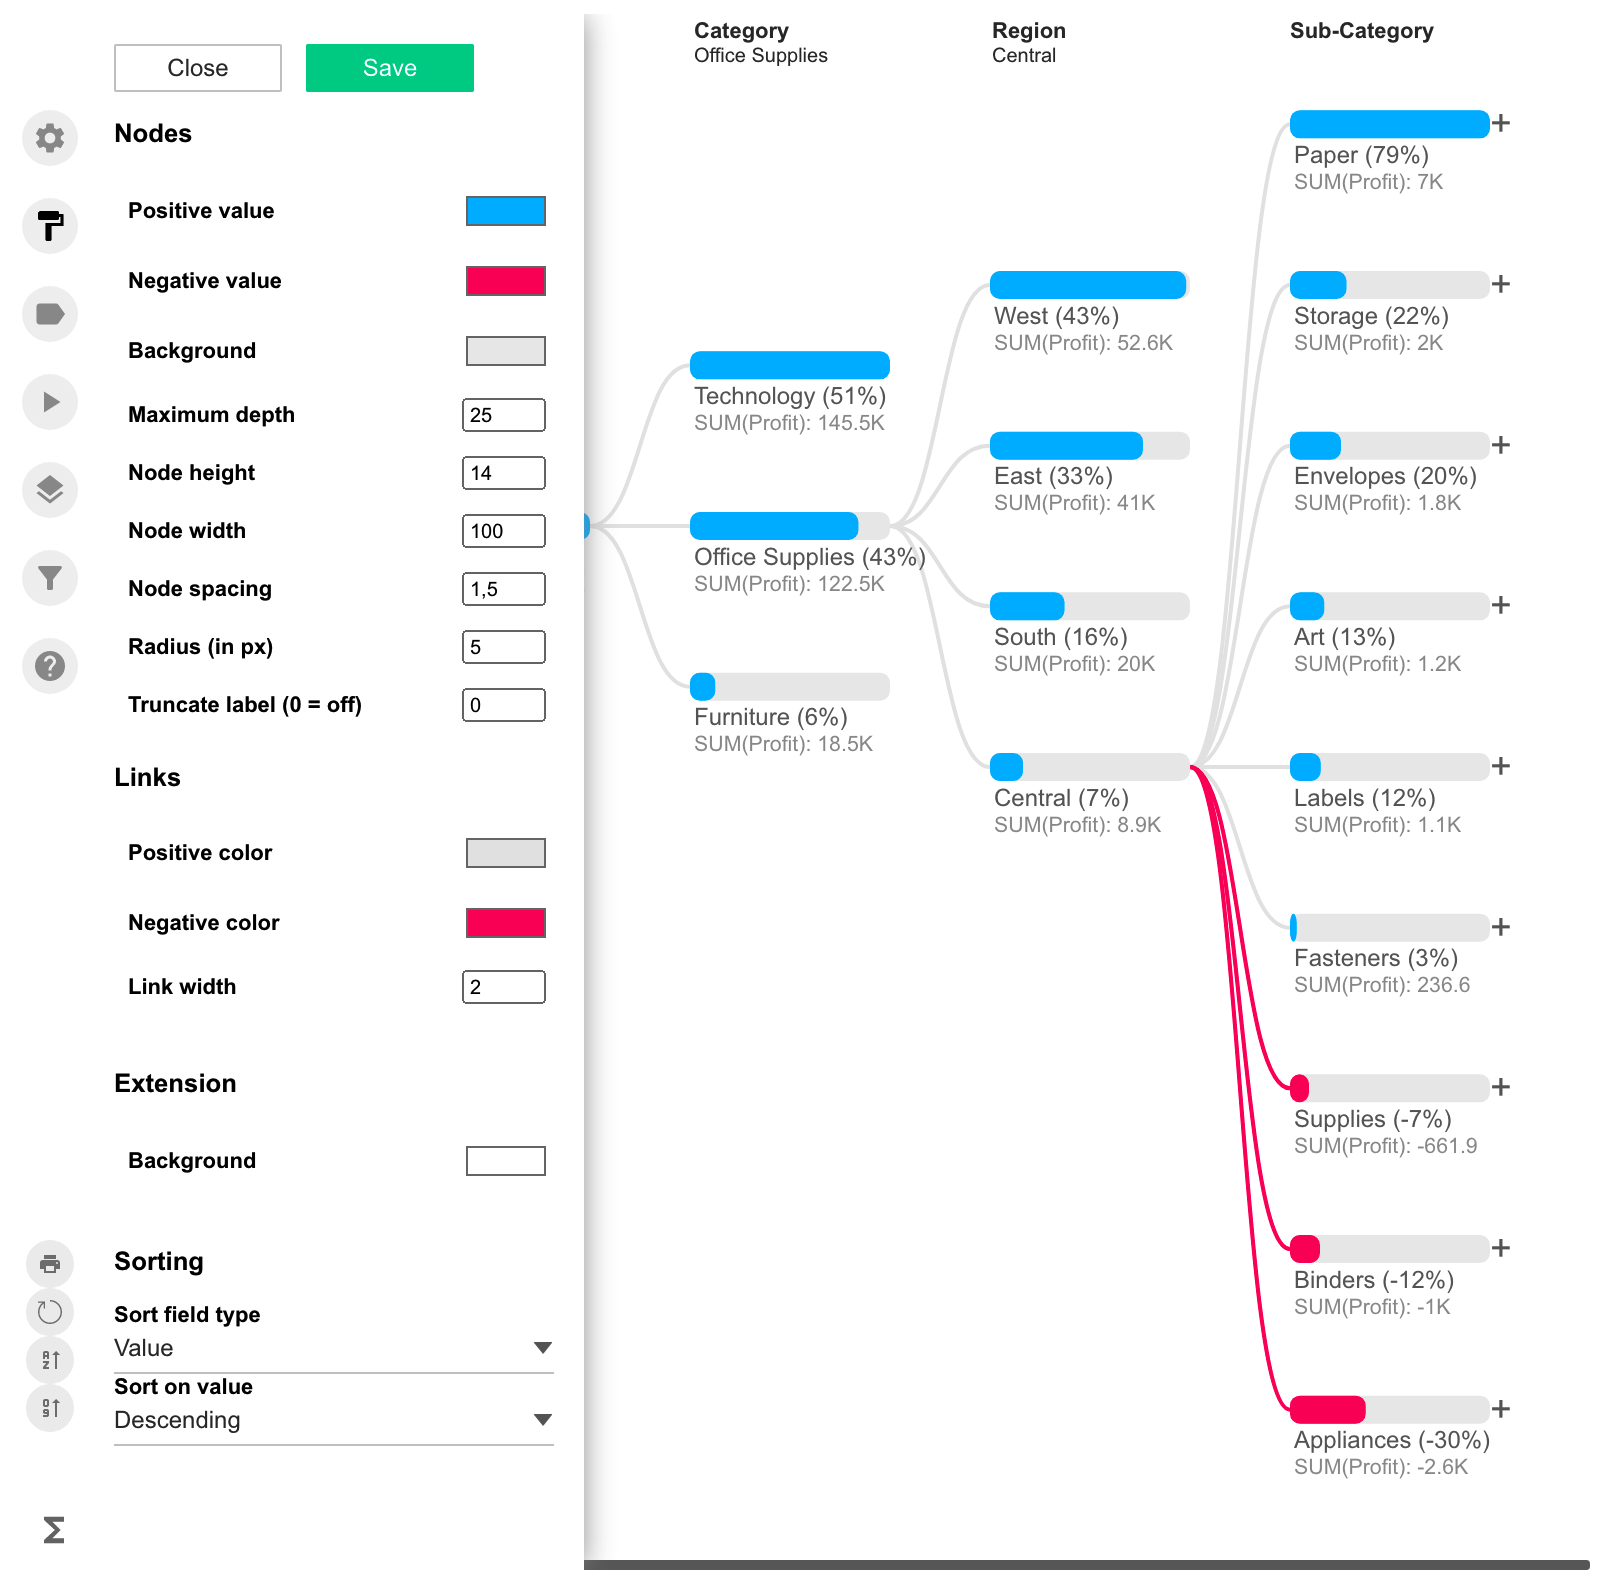
DrillDownTree allows for the editing of nodes, links and labels to create the perfect looking visualisation. When you are using the extension in Edit mode (either in Tableau Desktop or on Tableau Server / Online) you will see a configuration menu bar on the left pane of the extension. This pane holds the configuration options to be discussed in this section of the Product Guide. Use the following formatting options to create that perfect look:
Nodes and Links
Format the nodes in your view to get the most value from your DrillDownTree. A powerful feature is formatting the colors to differentiate between positive and negative values. This for example can help to clearly show which products are selling for a profit or at a loss.
Change the background color of your nodes/pills using the color palette. The background color will show when the node isn’t at 100% (so it’s the benchmark for a 100% value).
Edit your node by changing the width, height, spacing and the radius of the corners of the pills/nodes. It may be possible you will have a lot of dimensions in your view, here you can edit to get the best look to match your use case.
If you have large names for the members of your dimensions that will show on the nodes/pills you can truncate your label by showing a specific amount of character you decide. It may not be important to have the full name in your view, an abbreviation will do the job. Leaving it at 0 will always show full label.
Maximum depth
Sometimes less is more and limiting the amount of dimensions shown in your DrillDownTree could be the case here. When there’s too many dimensions drilled down on you will be presented with a horizontal scroll bar, that is something you may not want to see in your viz. Ensure all dimensions stay in your view by restricting the amount of dimensions.

Truncate label
Sometimes the names of your dimensions are just too long to fit in to the view. In the configure screen of the extension, in the ‘Nodes’ section, enter the amount of characters you wish to be shown. Leaving this value at 0 will not truncate.

Links
It is also possible to use the links to show where the positive and negative values are. When drilling down on a measure such a profit, you can see which categories or regions are or are not performing. Edit the width of the links in the text box, up to 10px.
Extension Background Color
Use the color palette to change the background color of the extension, this may be useful if you wish to blend in the DrillDownTree in the rest of your dashboard.
Sorting Default
There are many ways our users get their insight from DrillDownTree and many ways they wish to see the insight. Adding our new sort by name to have the tree displayed in the order you prefer, by measure value and now dimension name. Find this in the ‘Nodes’ tab of your extension configurations screen.
Labels and Measures
Measure Name and Alias
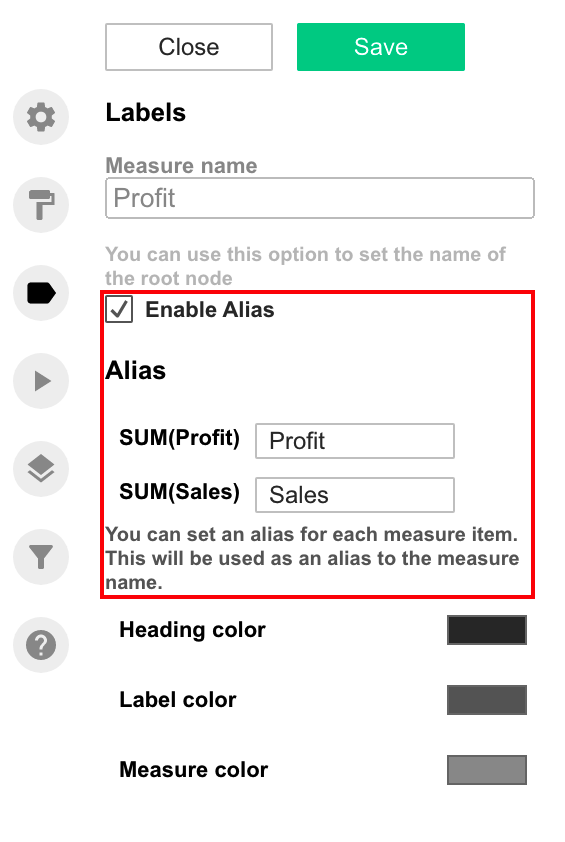
Here is where you are able to edit and format the label of the measure, heading and context labels within your end-user-view. You may wish to rename the measure you are using by typing in the text box. This will alias the measure used in the DrillDownTree view.
Beyond the default name, it is possible to set individual Aliases for each measure. Enable this option in the labels tab and configure the Aliases as desired.
Color and Font
Edit the text color of your headers, labels and measure values. It may be important to show clearly the measure value under each node, so formatting the color will help with that. It’s also possible to change the text size of the label and the measure.
Show measure percentage
Show the percentage of the measure within the particular node. It’s a clear way of showing how of the measure is represented per node. Turning this off the bar within the node represents the % of the node, but the label in the context below will disappear.
If you wish to have a quick overview, deselect the ‘Show measure value’ button. It may or may not be important to show the exact values in your view, all depending on your use case.
Value formatting, Prefix & Suffix
Decide how you wish to show your values such as K for thousands and M for Millions, for a clearer view in your viz. Add a prefix of a suffix to using a currency for example.
Percentage Label
You can now decide which percentage is most important to be shown in your viz, if you can’t decide which one – show both! By default the % of the group total will be shown, each node of the dimension will show by % of how much of the value is in each node, through the dimension, adding up to 100%. We’ve now added the ability to show the % of the total value from the start of the tree, as you drill down you will see the % of the total measure through your tree.
Optimised label sizing
After great feedback from our customers we have improved the label sizing for both the label and the measure. The value of the node may be the most important insight from your DrillDownTree, having that more visible at first glance could really enhance your dashboard! These changes can be made in the ‘Label’ section in the extensions configuration screen.
Rounding precision
Use the dropdown to decide how many decimal places you wish to be shown within your percentage as well as your measure. Use this for more precise detail.
Animations
Have fun with our selection of animations.
Click on the dropdown to choose your favourite animation for building your DrillDownTree. When changing the animation you will see the exmple of the new animation immediately
You can edit the duration of the animation within the text box. The duration is calculated in milliseconds (ms). The higher the number entered, the slower the animation will take (1000 ms means 1 second).

Layout Configuration
Configurable options
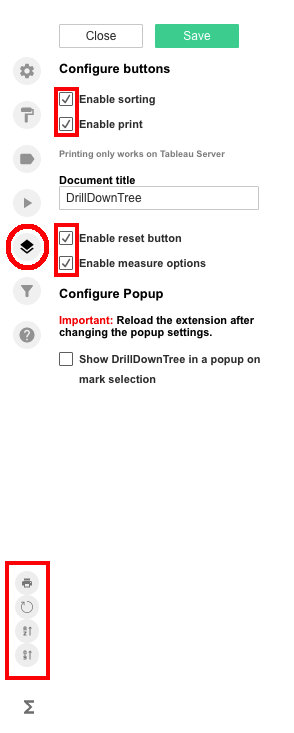
In the “Layout” tab, enable several analytics options like changing the sort type, measure switcher, one click reset and printing.
- Measure Switcher
The measure switchers allows users to switch between multiple pre-selected measures with a single click - Sort Options
Sort on your dimensions ascending or descending either on value or alphabetically. This will change the order of each dimension shown in your view. Below the sorting is the measures chosen in the data pane. - Measure Options
Click on your chosen measure and your DrillDownTree will instantly render. NOTE: change the name of the new measure in the “Labels and Tooltips” tab or your side pane. - Printing Option
Enabling this option displays a print button, allowing your users to print DrillDownTree on Tableau Online/Server.
Popup
Have the DrillDownTree configured as a popup! A perfect way to save valuable space on your dashboard is to use the popup feature. DrillDownTree can be opened using a trigger from another sheet on your dashboard. Use the dropdown to decide which sheets you wish to trigger the extension, you may select multiple sheets. When activating the pop feature the extension will be shown as a button, which can be clicked on at any time you wish.
*Important: Reload the extension after changing the popup settings. This need to be done when turning on and off popup.

Format pop up button
A DrillDownTree can take a lot of valuable dashboard space when it has a permanent container in your dashboard. Maybe you just want the DrillDownTree to show up when users click a button or select a mark in you dashboard. This is possible using the “Pop-Up ” mode of DrillDownTree. One of the most powerful features of DrillDownTree. It’s now possible to format the popup button to suit your corporate identity and dashboards color style. You can also change the button text to show clearly where the DrillDownTree is on your dashboard. Small changes that add big value!

Dashboard Actions
To improve interactivity we introduced Dashboard Actions in the DrillDownTree extension. With this option you can choose your target sheets for the dashboard action once a node/pill is clicked. Multiple sheets may be chosen as target sheets.
Now you can see real time changes by clicking on any blue pill twice. You may also trigger the DrillDownTree using dashboard actions on any of your other worksheets on your dashboard. Dashboard actions work both ways! Decide what you wish to happen when clearing your selection using the dropdown menu. You may wish to leave the filter in place when deselecting, that can be chosen here.

We love to make solutions and help Tableau users to do things more efficiently. If you have feedback, ideas, questions or need support, please make sure to share it with us! Also, don’t forget to follow us on social media for our latest news and updates.