Saving hundreds of hours a week by using SuperTables
SuperTables brings a lot of value by reducing the number of dashboards that have to be created and maintained. For Mario, the data process became faster and hundreds of hours per week were saved by not constantly being asked to make a report or having to hire an expensive contractor.
Speeding up data processes
Mario Giovannitti works at a large Health organization in Texas as Manager Data Centre & Operations Management. He works with a small team and he was in need of extra help in order to move the data processes faster. This use case led him to the SuperTables extension at Infotopics | Apps for Tableau, where he experienced a positive, high level customer journey and a high-value product. He was amused by how quickly questions were answered despite the huge time difference between Texas in USA and The Netherlands.
Mario Giovannitti : “When we saw SuperTables it was very compelling and very easy. It allowed me to present data without the need to have a dozen different individual dashboards to multiple different questions. More work can be done in a shorter period of time and it allows for a lot of self-service access to data.”
Controlling Access
Mario can control access through the Tableau Server and allow users to only deal with the data that they are entitled to seek. It allows all users to explore the data the way they want and there is no more extra spent time on dealing with continuous questions from the users.
Saving time
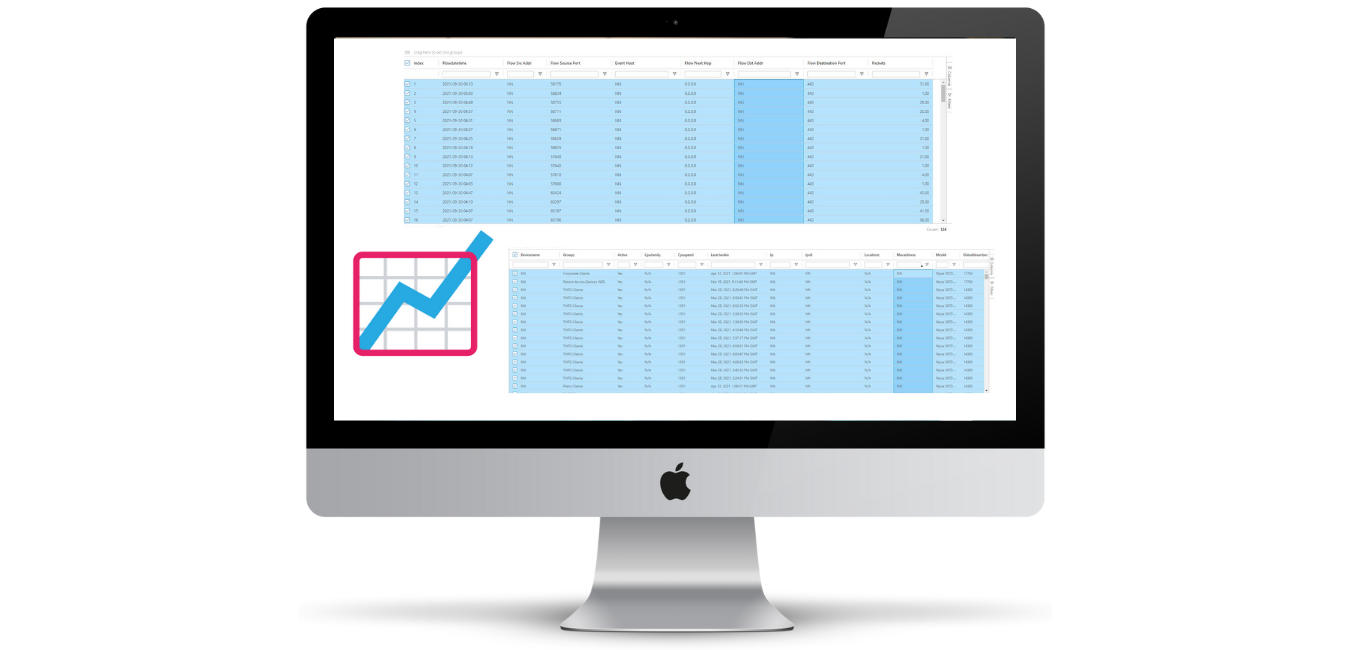
Instead of having to go through the multistep process of downloading tabular data from Tableau, where Mario had to deal with a lot of individual work, he could use SuperTables to allow users to explore the data right in Tableau to stay in the flow in a governed and secure way!
“The SuperTables extension allows more self-service and access to data that is very self-explanatory so almost every dashboard has a SuperTables component to it which we happily use. The SuperTables extension was a real gamechanger for us!” – Mario Giovannitti
Start using SuperTables!
You’ve never seen a more powerful table!
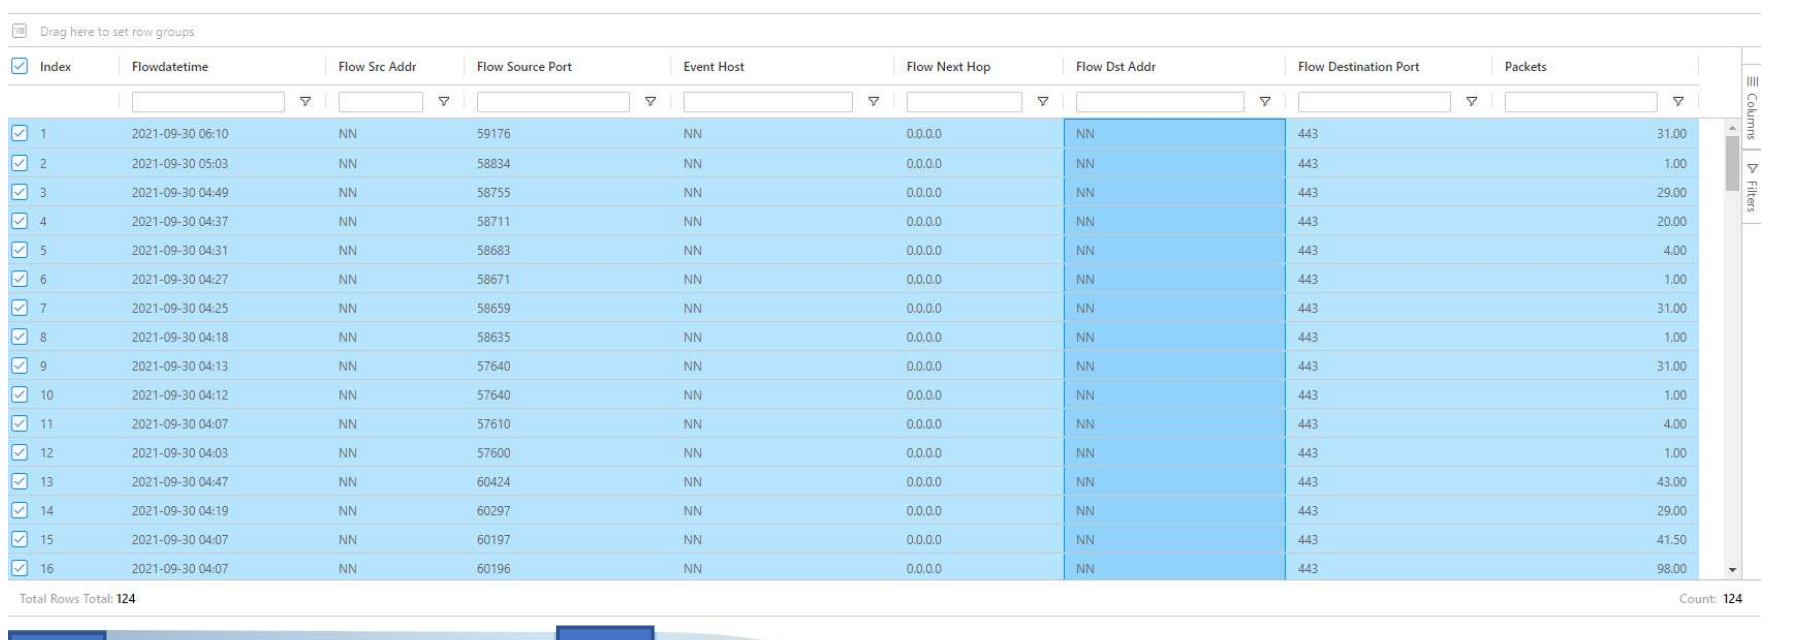
- 1Offer your dashboard users the power of interactive and dynamic Excel-like tables
- 2Allow users to decide how to organize and analyze their data in a flexible grid
- 3Use the features just like in Excel without leaving Tableau!
- 4Allow your visitors to do their own analysis with the summarized data of your visualizations

