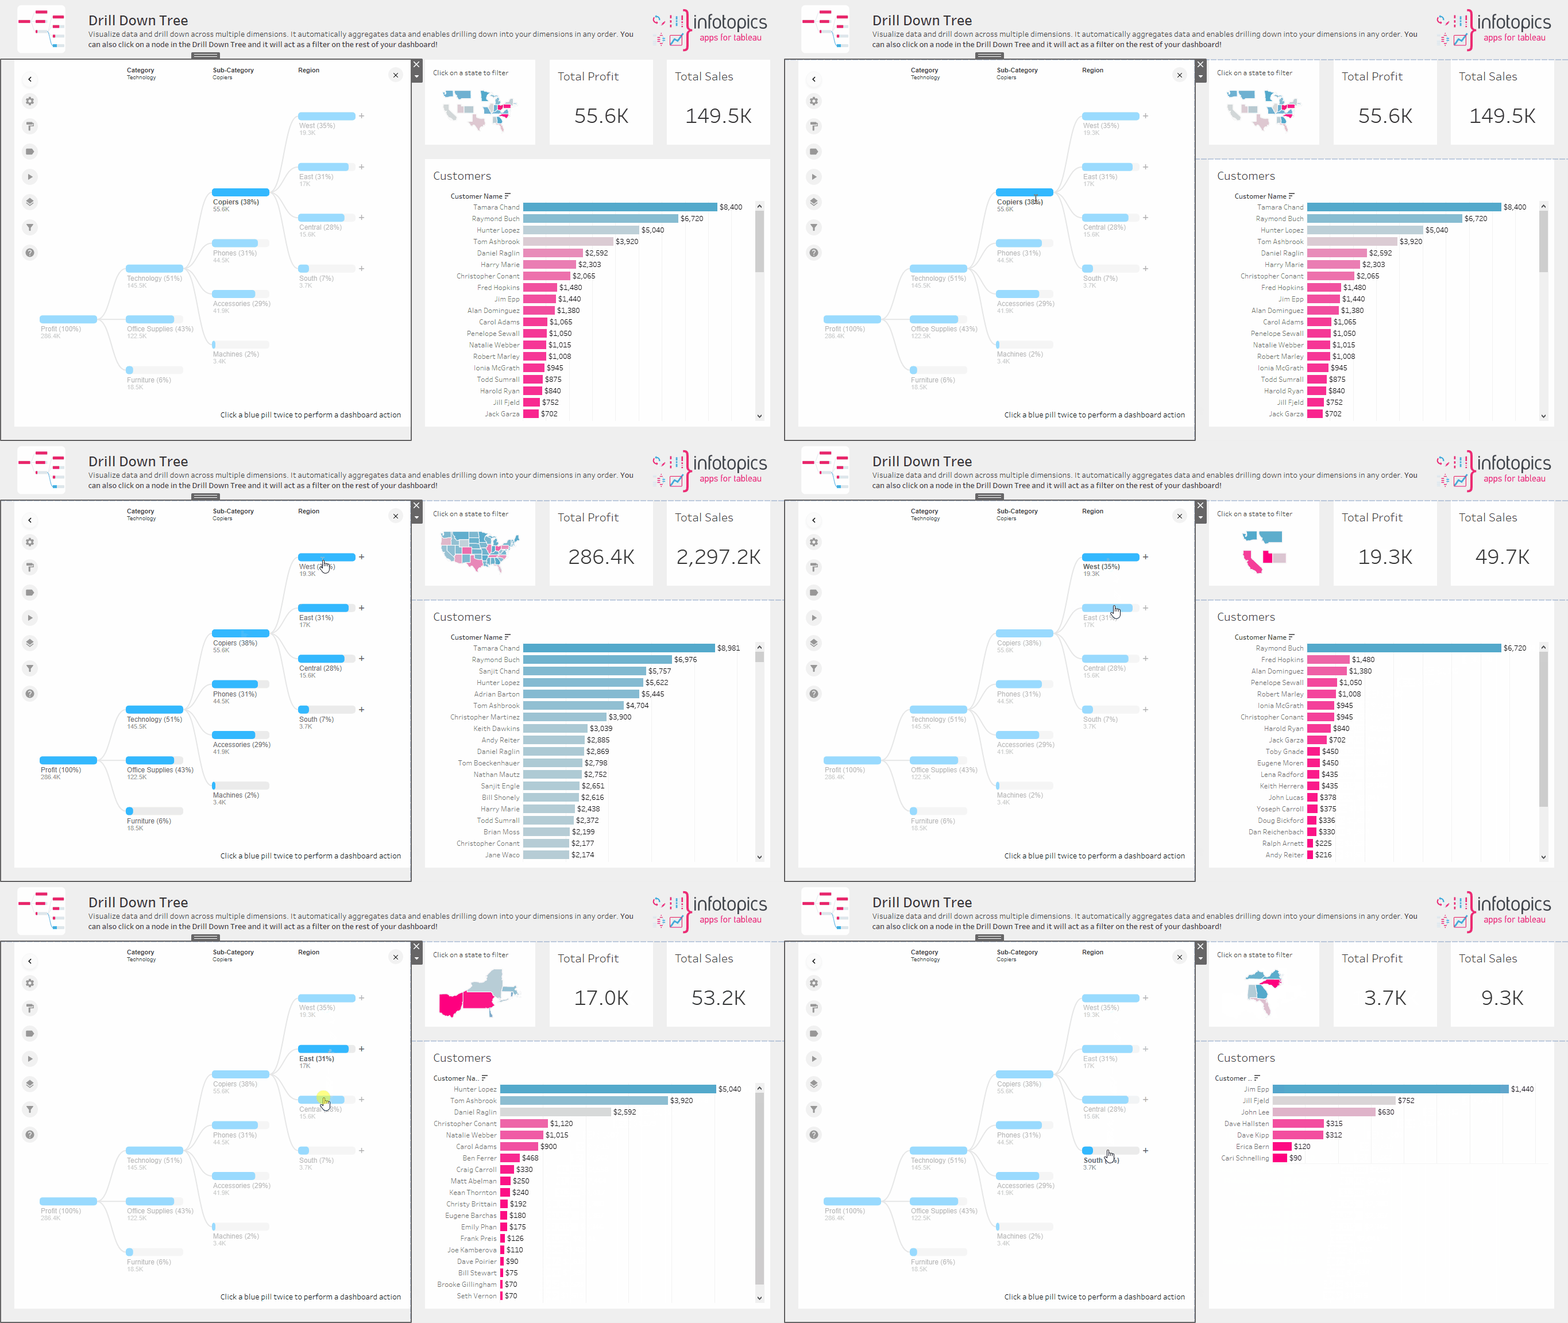
Unlocking Deeper Insights with Custom Calculations in DrillDownTree Extension
The DrillDownTree extension is a powerful tool that allows users to explore hierarchical data in a visually appealing way. With the recent addition of the custom calculation feature, users can now create non-aggregated calculations to use as measures in the DrillDownTree, providing even deeper insights into their data.
Aggregated vs Non-Aggregated Calculations
In Tableau, there are two types of calculations: aggregated and non-aggregated. Aggregated calculations perform an operation on a group of values, such as summing or averaging, to produce a single value. Non-aggregated calculations, on the other hand, operate on individual values and can produce multiple values.
Aggregated calculations are useful for analyzing overall trends and patterns in your data, while non-aggregated calculations allow you to analyze individual values and their relationships to other values.
For example, a sum of sales revenue by region is an aggregated calculation because it groups all sales revenue by region and produces a single value for each region. A profit ratio calculation, which divides profit by sales revenue for each product or region, is a non-aggregated calculation because it produces multiple values for each product or region.

Custom Calculation Feature
With the custom calculation feature in the DrillDownTree extension, users can now create non-aggregated calculations to use as measures in the extension. This allows for an even deeper analysis of hierarchical data, as users can now analyze individual values and their relationships to other values at each level of the hierarchy.
For example, you could create a profit ratio calculation for each product category to see which categories are the most profitable. You could then drill down into each category to see which individual products are contributing the most to that category’s profit. This level of analysis would not be possible with an aggregated calculation.

Other Non-Aggregated Calculations
Here are some examples of non-aggregated calculations that can be used in the DrillDownTree extension:
- Percentage of Total: Shows the percentage that a particular value represents out of the total..
- Difference from Average: Shows how a particular value compares to the average value for the measure.
- Profit Ratio: Shows the profit as a percentage of the revenue.
Each of these non-aggregated calculations can provide valuable insights into your data at each level of the hierarchy, allowing for deeper analysis and understanding.
Why it’s Important
DrillDownTree extension helps in deeper analysis and understanding of hierarchical data. By creating non-aggregated calculations, users can analyze individual values and their relationships to other values at each level of the hierarchy, providing insights that would not be possible with aggregated calculations.
This level of analysis can help businesses make informed decisions about resource allocation, inventory management, sales forecasting, and more. By understanding the relationships between individual values at each level of the hierarchy, businesses can optimize their operations and drive growth and profitability.
In conclusion, the custom calculation feature in the DrillDownTree extension is a powerful tool for exploring and analyzing hierarchical data. By creating non-aggregated calculations, users can gain deeper insights into their data and make informed decisions about their business.