Step by Step Guide for Project Management in Tableau with WriteBackExtreme
In this blog, we are going to show you how you can use WriteBackExtreme to build a project management solution right in Tableau. Our goal was to make it easy for everyone using Tableau to create, edit, and discuss tasks with their team, just like you would with other project management tools, but all without leaving Tableau. Let’s dive in and see how it works!

There are 3 ways in which WBE is used in our example:
1. Add Data – Adding a task
2. Data Correction – Selecting a tile to edit a task
3. Data Collaboration – Adding or viewing a comment
There can be multiple other use cases from our example such as HR management, Invoicing, customer information and groceries.
So how did we do it?
Connecting WriteBackExtreme to the Dashboard
1. Setting up the Schemas
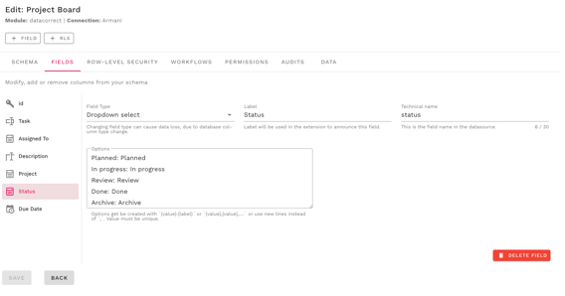
To set up the schemas we can use the task forms, here you can fill in the details of the data such as adding dropdown fields for assigning tasks, selecting the relevant project, and indicating task status, alongside a paragraph field for adding comments regarding the ticket.
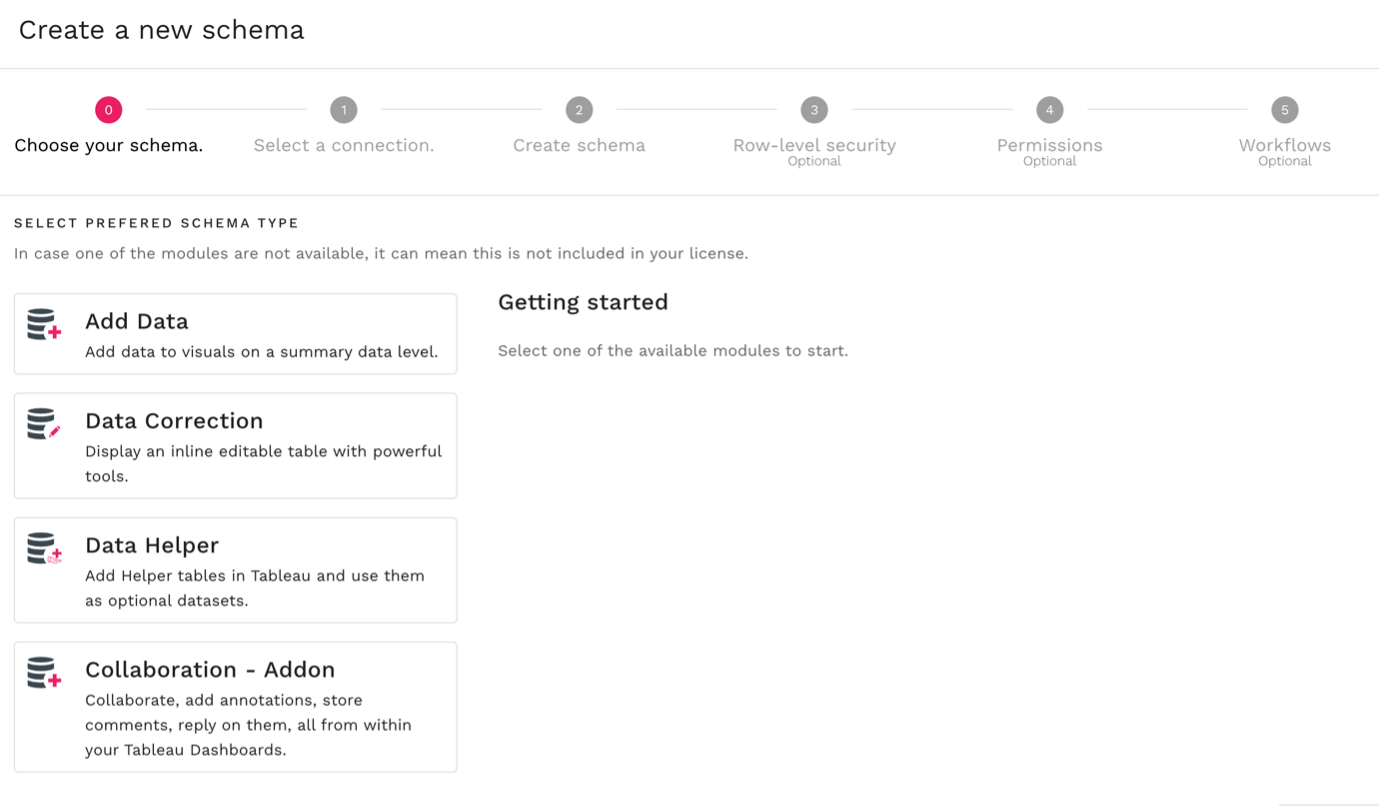
After setting up the schemas, we can connect the schema data to the project board dashboard by creating a relationship to the existing template data, so when users add a comment or task, there will be a connection from the input to the corresponding card.
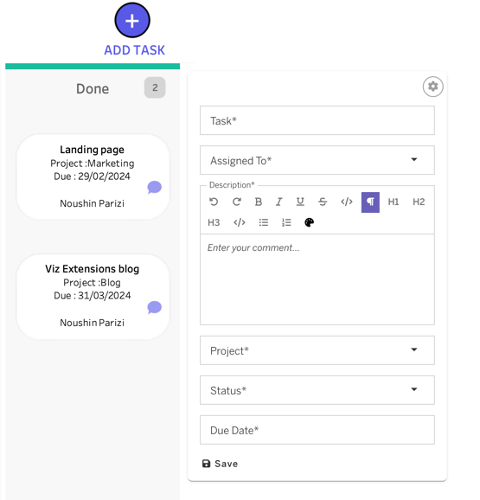
2. Add Data – Adding a task
We first need to set up the ability to create a task, a task that will have clear fields so users can input all the relevant information. Within the management console of WriteBackExtreme, you have the flexibility to configure a schema tailored to your specific requirements.
The Add task extension is triggered by a sheet in Tableau with parameter actions and associated calculations to show and hide the extension when selected.
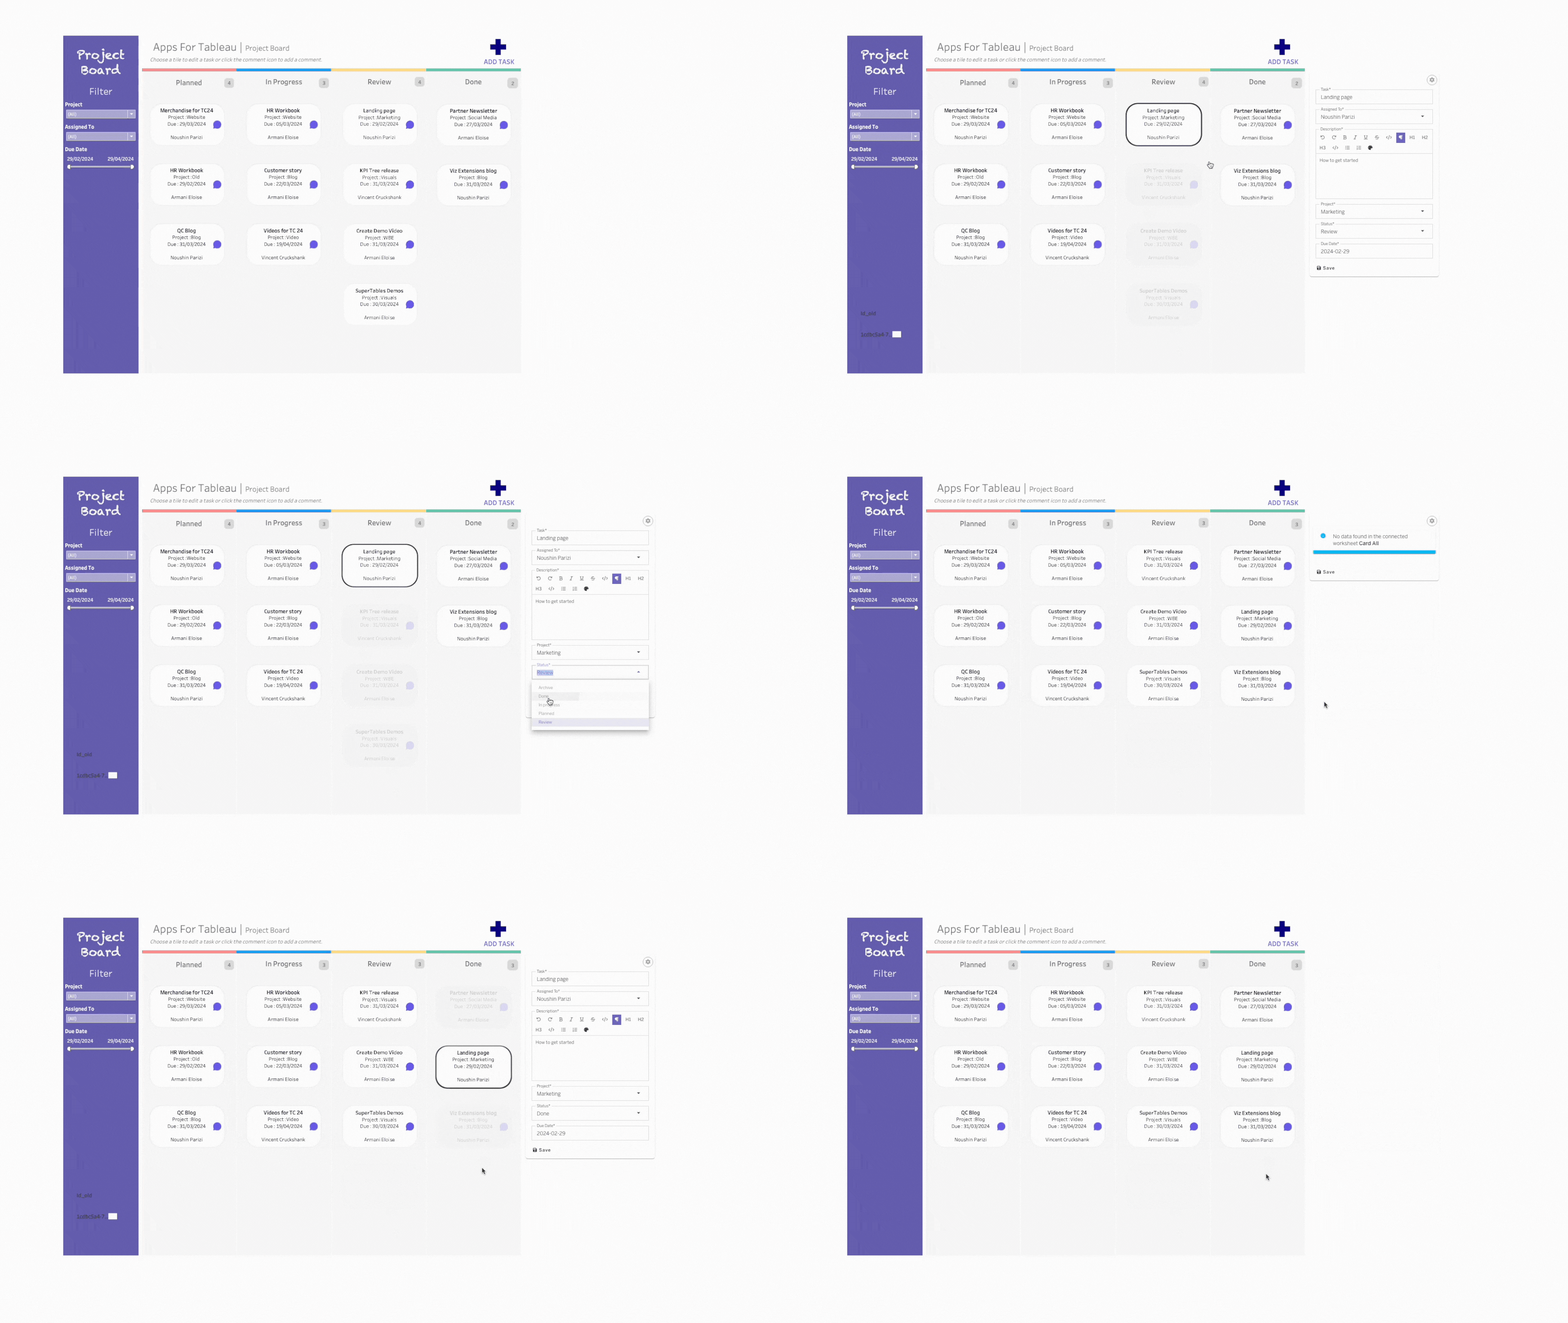
3. Data Correction – Selecting a tile to edit a task
To edit a task, we create a schema with data correction and relate the table to the existing dashboard data as with adding a task. We created a schema in the management console of the extension with the required fields.
The edit task extension pop up is triggered by parameter actions and associated calculations, like the add task method.
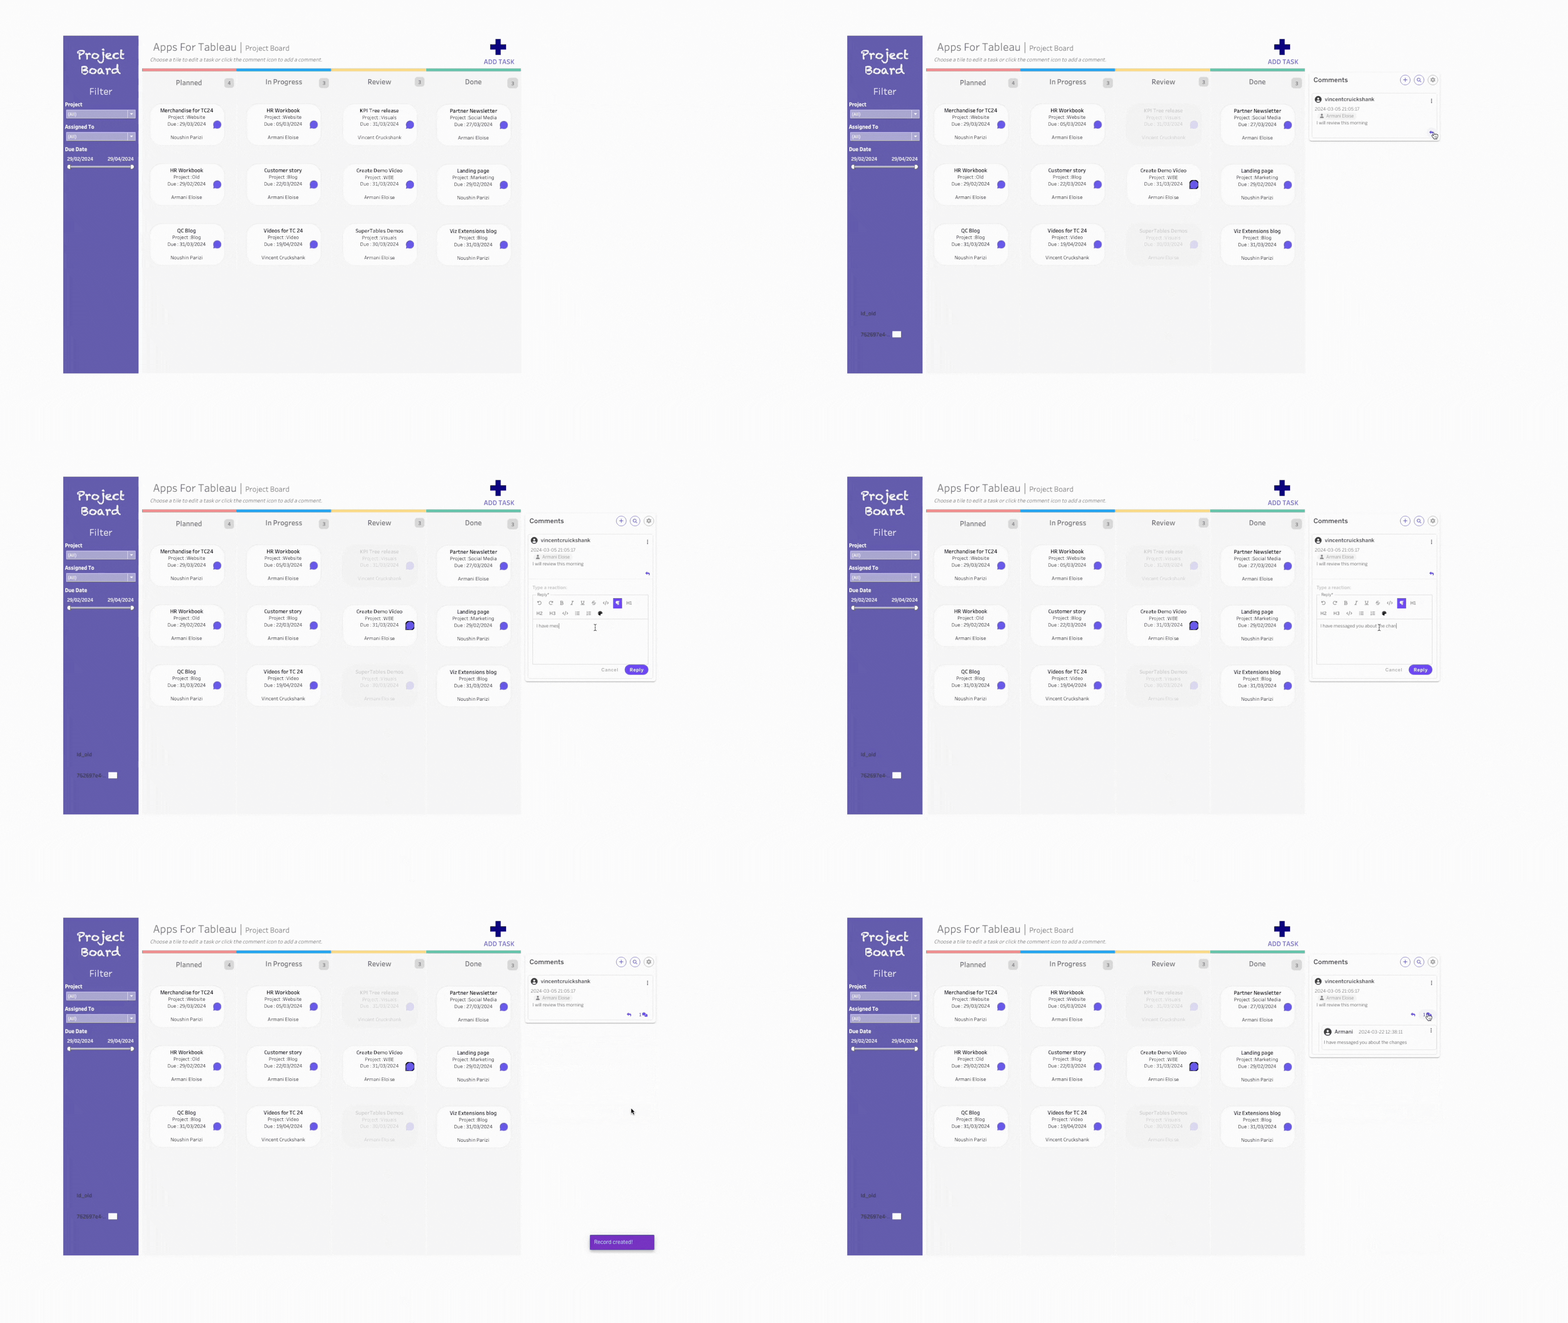
4. Data Collaboration – Adding or viewing a comment
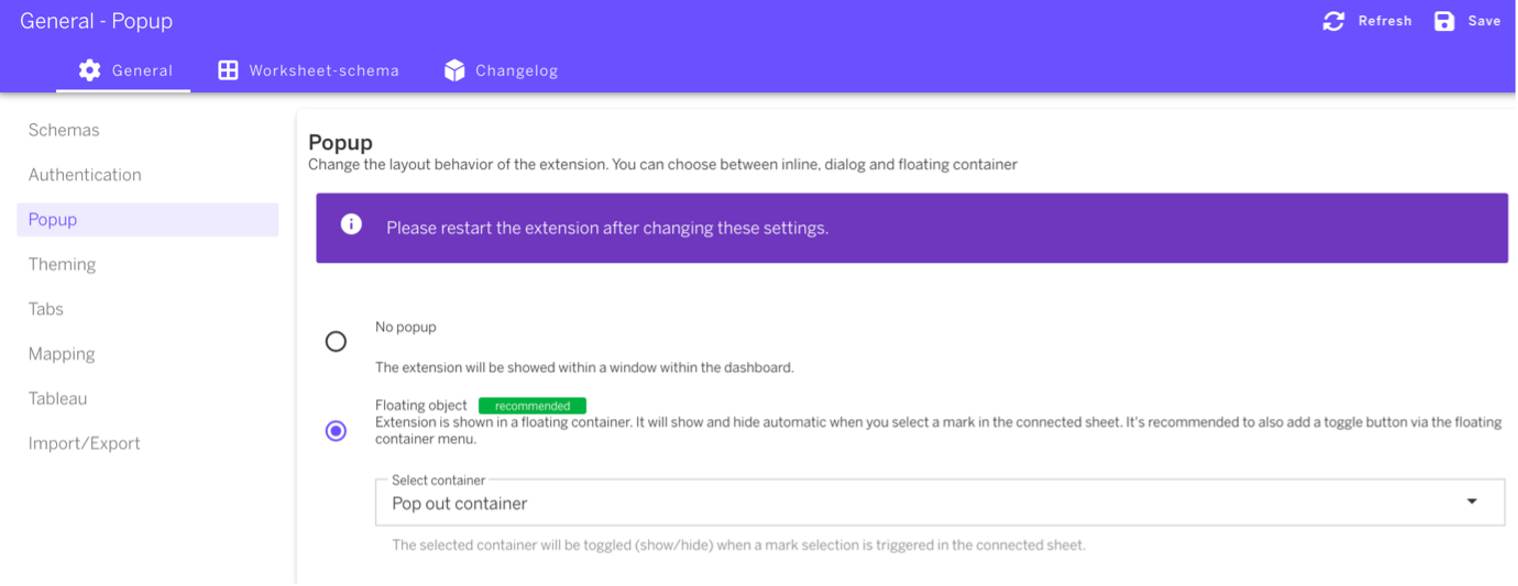
A separate schema has been created specifically for users to comment on the respective ticket. The comment uses the pop-up functionality within the WBE settings and a filter action set up in the dashboard:
Structure & Visual Design
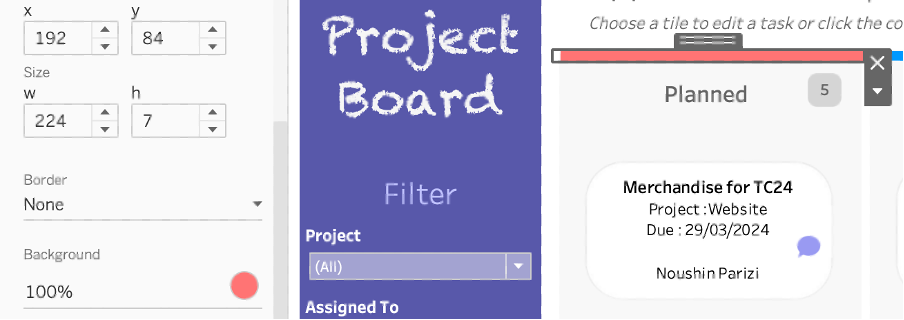
The column like structure of the dashboard is made with dashboard containers. The main body consists of vertical containers of equal width and height, with some padding in between. To differentiate each status of the tasks, a blank object has been added on top of each grey column with different background colors:
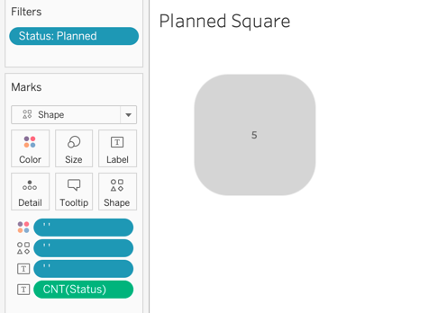
The Number of tiles per column is shown using a floating sheet in each column, a rounded square shape is used with the number of tasks linked to the WBE data source. The COUNT of the status can easily be used to show the number of comments:
Task Tile
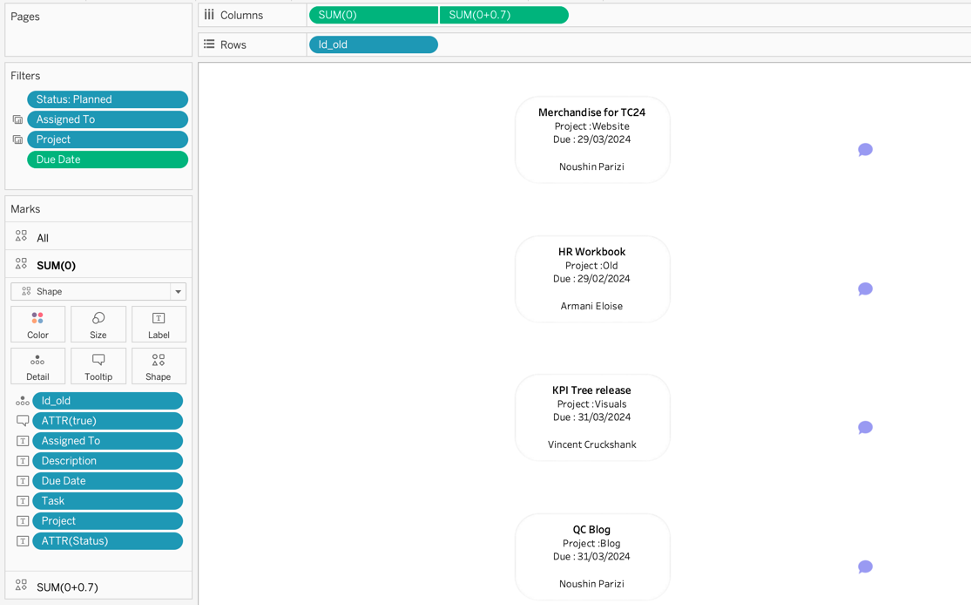
The tiles are positioned in a single sheet per column, this is added as a floating vertical container on top of the grey columns. To create the tiles, a rounded rectangle shape has been used with the relevant task information on the label tile. The ID related to each task is used on rows to split the number of tasks, ensuring that new data added via WBE will create a separate tile with its own text. The dual axis method has been used to add the comment shape, with the axis adjusted so it sits towards the left of the task tile.
Start your Journey
Ready to transform your data journey?
Get started with our Project Management dashboard and enjoy seamless task generation, modification, and collaboration all in native Tableau environment. Elevate your performance, empower your team, and make data-driven decisions with powerful Tableau extensions.