Hotel & Property Manager
Tableau Dashboard
The following blog shows the process and value of the latest dashboard created using WriteBackExtreme, PictureThis and ShowMeMore with Viz Extensions.
This project showcases how powerful and versatile Tableau can be combined with Viz Extensions.
Functionality
With the Hotel & Property Manager Dashboard you can:
- Filter hotels based on rating and availability
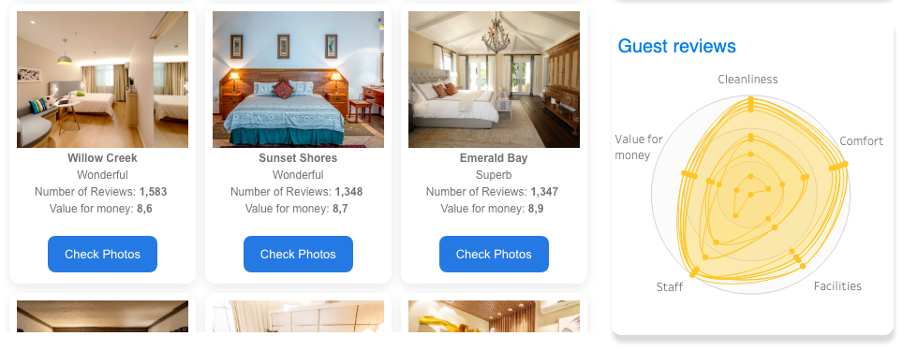
- Assess hotels based on guest reviews
- Make a real or dummy hotel booking
- View check in information and availability
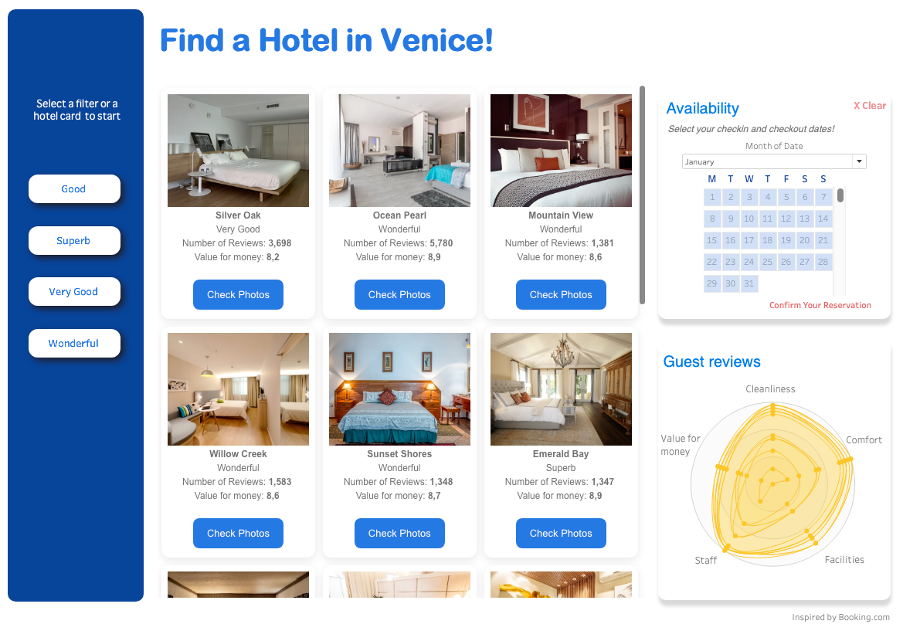
Check availability of selected hotels, make a real booking via the button or a dummy booking using WriteBackExtreme.

Access availability overtime using the Property Manager.
The Process
Using Viz Extensions to add PictureThis
Viz Extensions is a recent Tableau 2024.2 release which allows you to use Extensions within a sheet. This means we no longer need to add the sheet to a dashboard.
The Extension has been used to add the restaurant images and the menu.
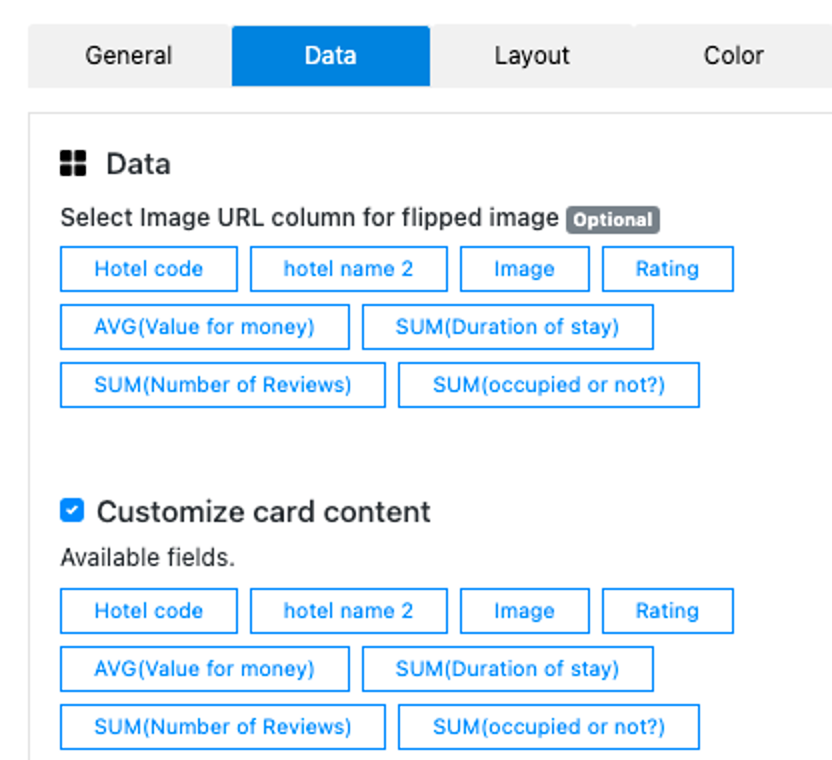
From the marks card, you can select the PictureThis Extension and configure the Extension within the sheet, the following fields have been used for the Extension:


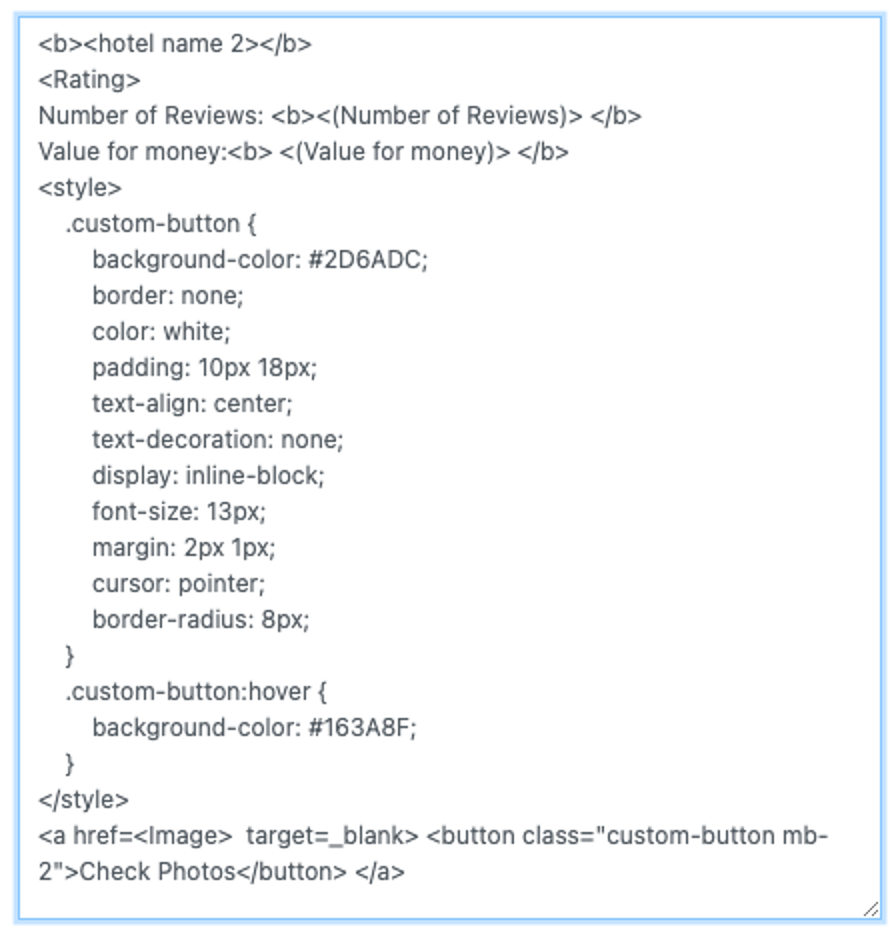
The blue booking option pills have been added using HTML within the formatting options under Customize card content.
Using WriteBackExtreme to add booking availability
This Extension has been configured within the dashboard and uses the same sheet as the PictureThis Extension as it has all the fields needed for configuration.
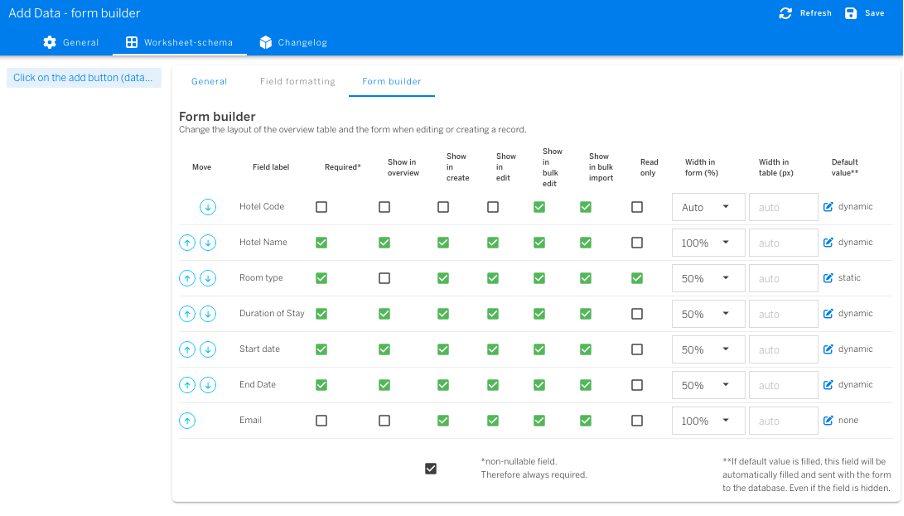
1. Create the schema using the Add Data module in the management console, the fields needed are: id, Hotel code, Start date, End date, Room type, Hotel name, Email and Duration of stay.
2. Bring in the schema data into Tableau and relate the tables based on your data structure.
3. The WriteBackExtreme set up looks like the following:

4. For the Authentication section you can select the Username sheet and field.
5. In order for the parameter actions to work with the Extension, go to the Tabs option and enable Show tabs.
6. Go to the Mapping configuration option and enable the option to include the worksheet in mapping when selecting a data point.
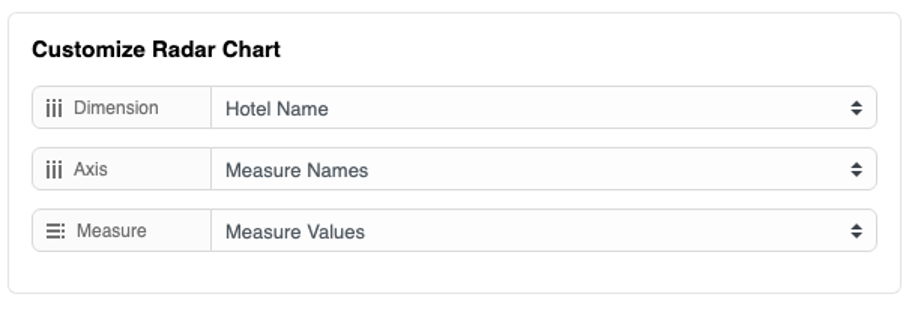
Using the Radar Chart from ShowMeMore to show Hotel ratings
In the Hotel Finder, the updated version of the Radar Chart can be added easily via Viz Extensions or dashboard Extensions, it shows the ratings for hotels and filters on selection:
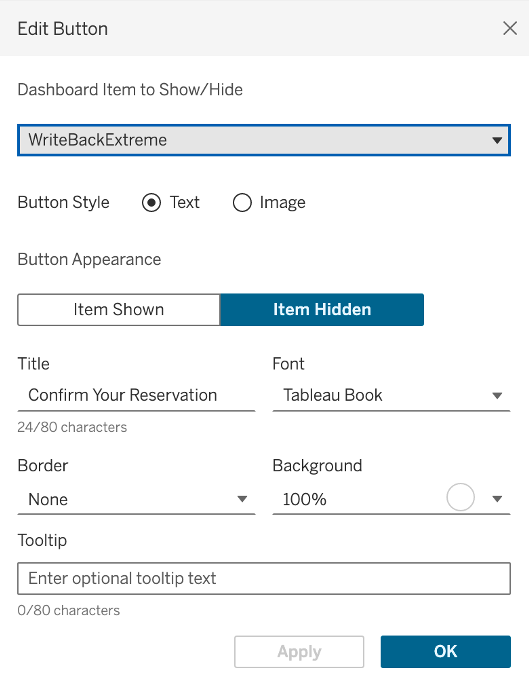
Button Functionality
The show/hide functionality enabled when selecting ‘Confirm your reservation’ has been enabled using a button within the dashboard objects.
When the item is shown the ‘Go Back!’ text is enabled which allows the Extension to be hidden again:
Filter
The rating filters are created using separate sheets with a dashboard filter action enabled per sheet:
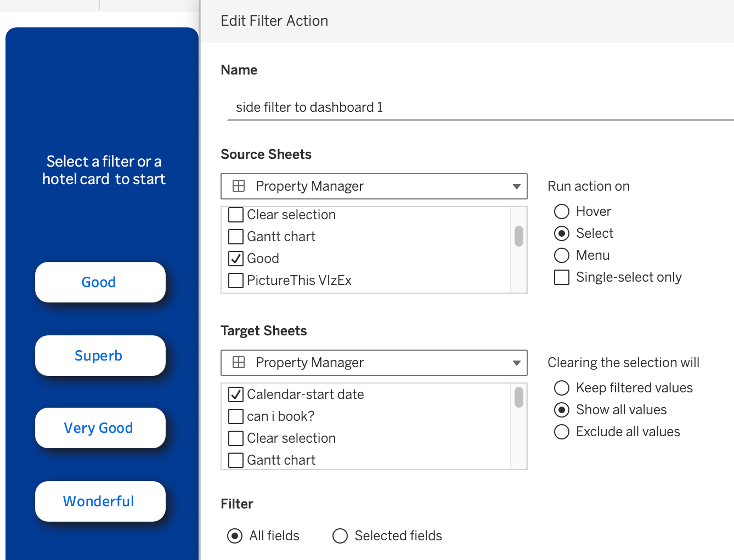
The PictureThis Viz Extension sheet has been used as a filter which allows the availability and radar chart to be filtered. This can be easily enabled using the funnel icon once the sheet is selected.
You can select the sheets that you want to be filtered with PictureThis in the dashboard actions.
Parameters
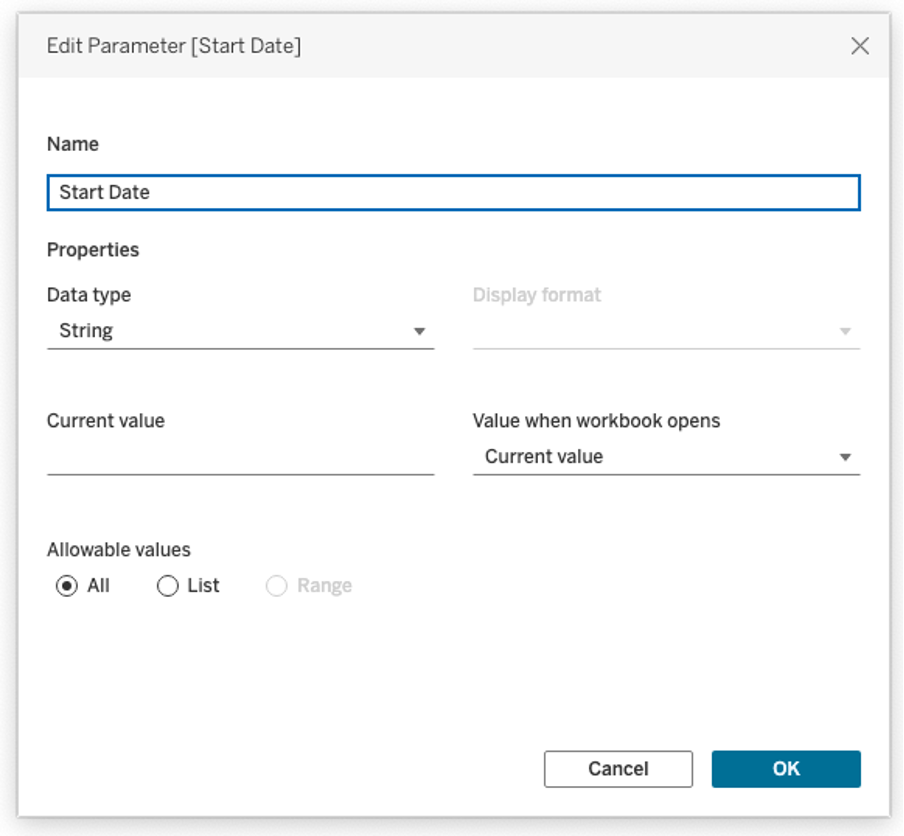
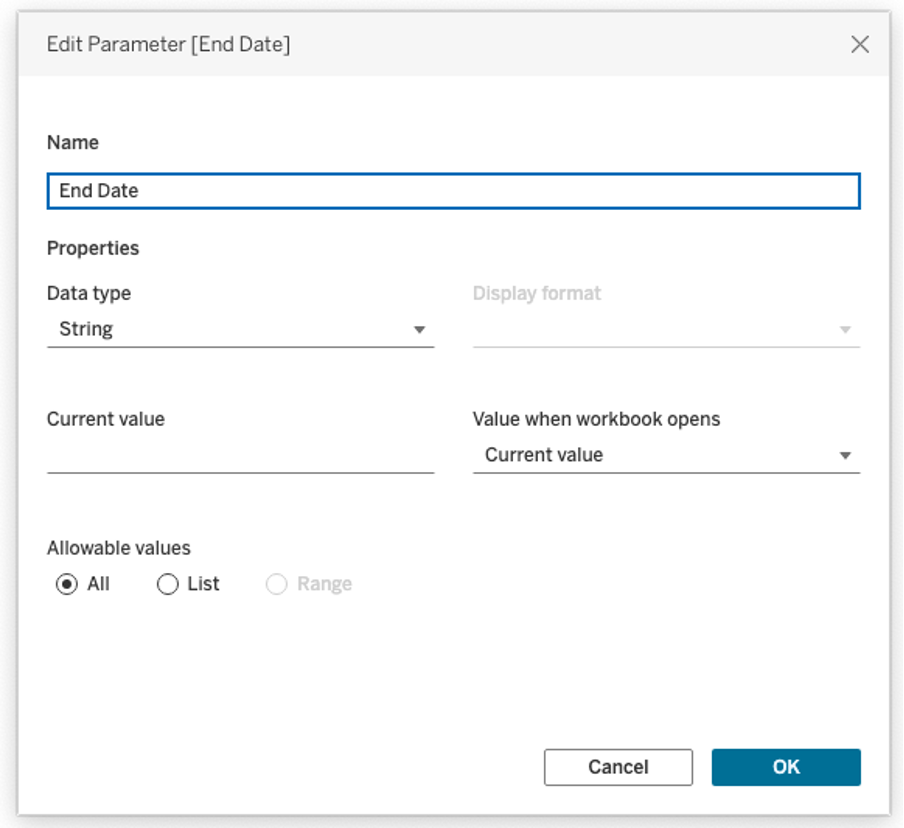
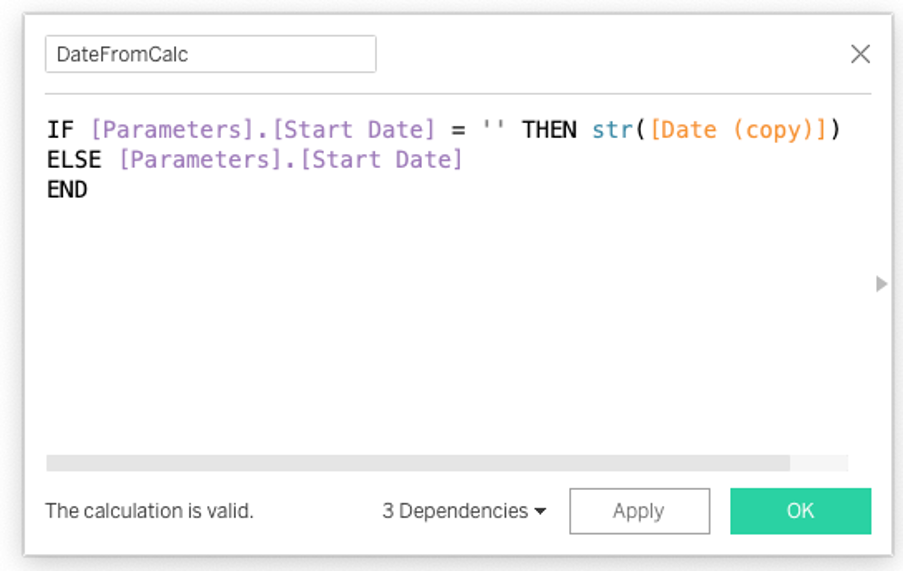
The user will be able to select a start date and an end date in the calendar and make a reservation. Therefore, two parameters are needed for the start and end date of a stay, as shown in the image:
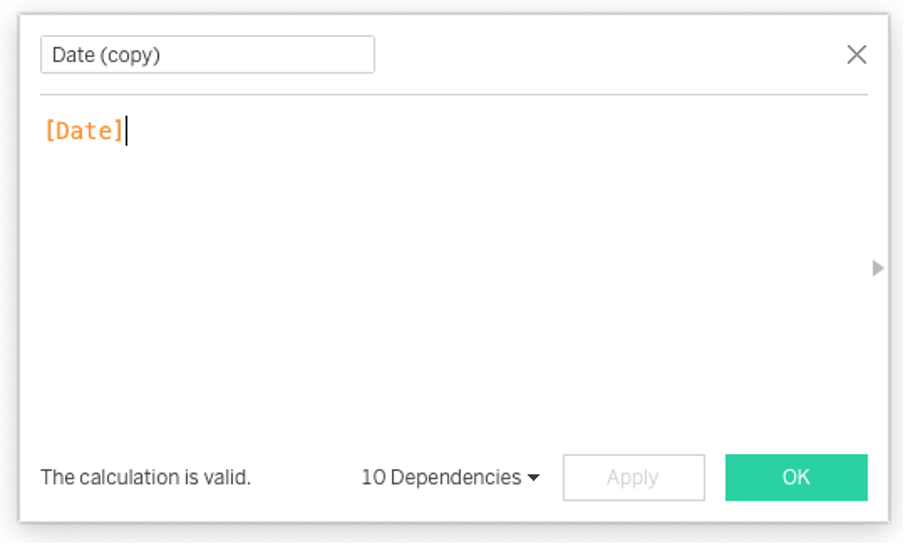
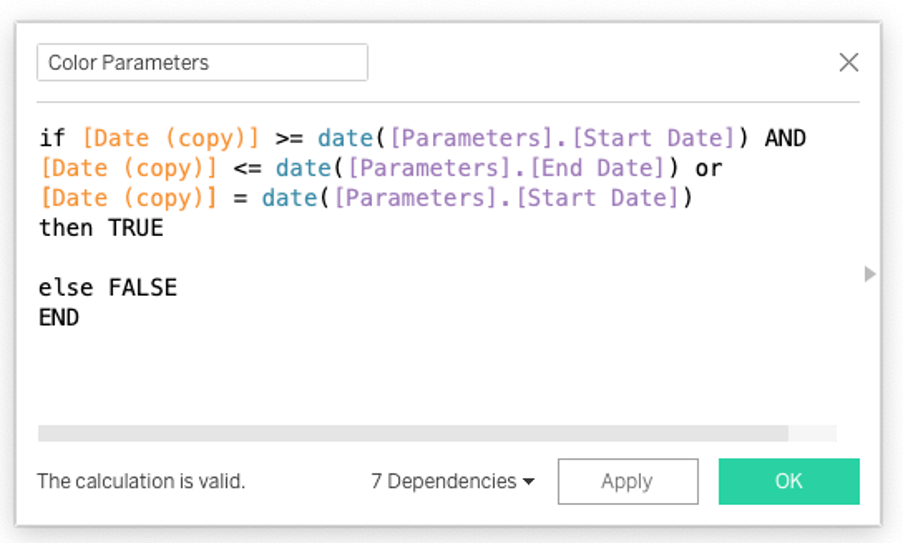
Two calculations will use these two parameters to define the period of stay:
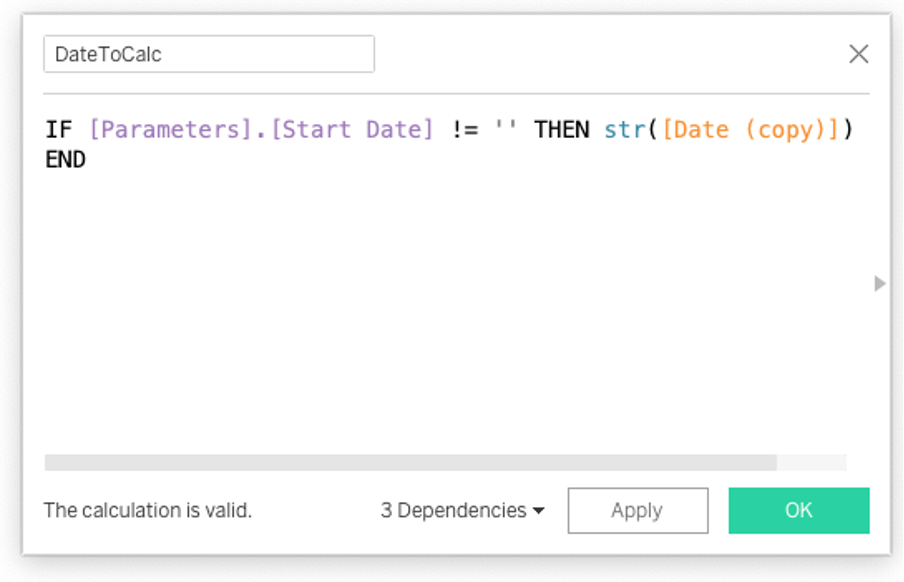
This period will be used to assign a color to the period that the user has selected. If the date is within that range, it will return true; otherwise, false.
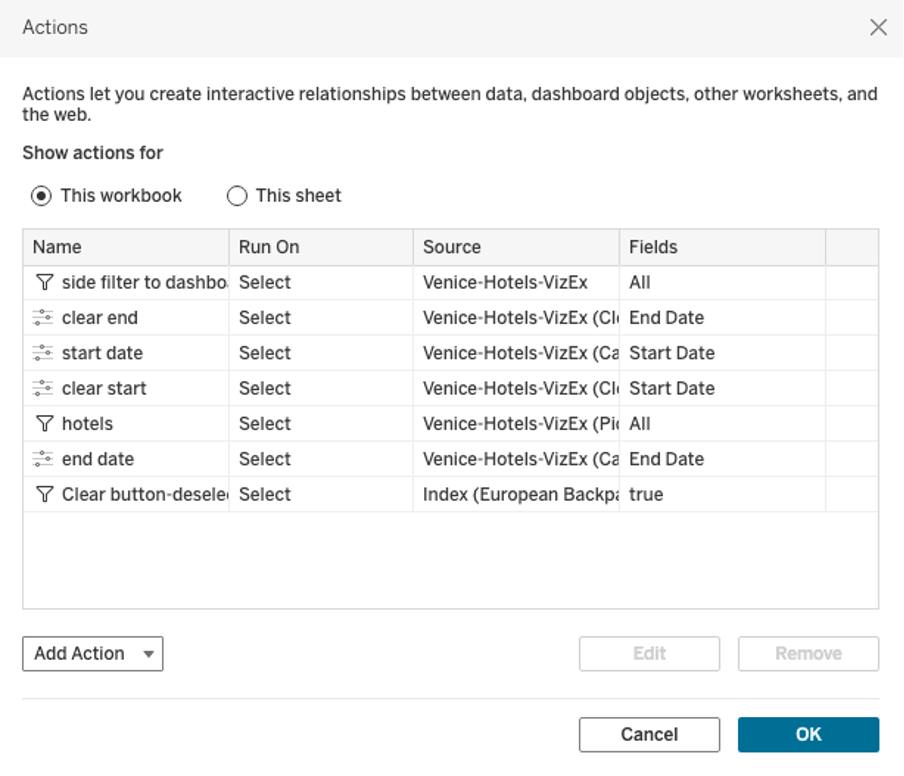
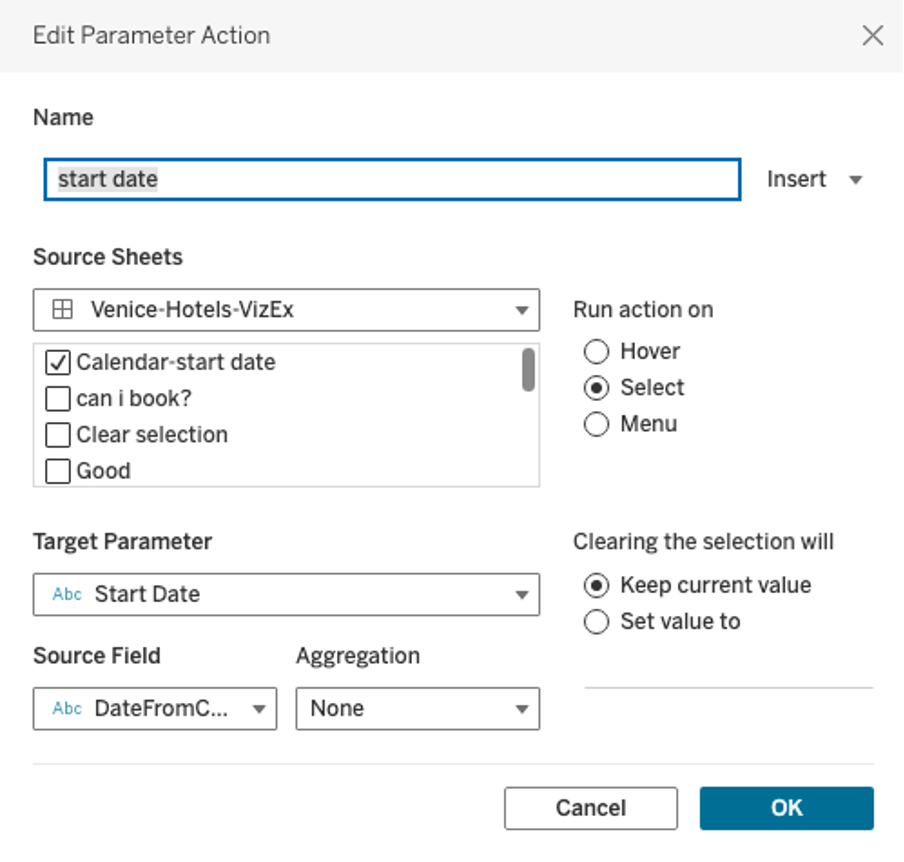
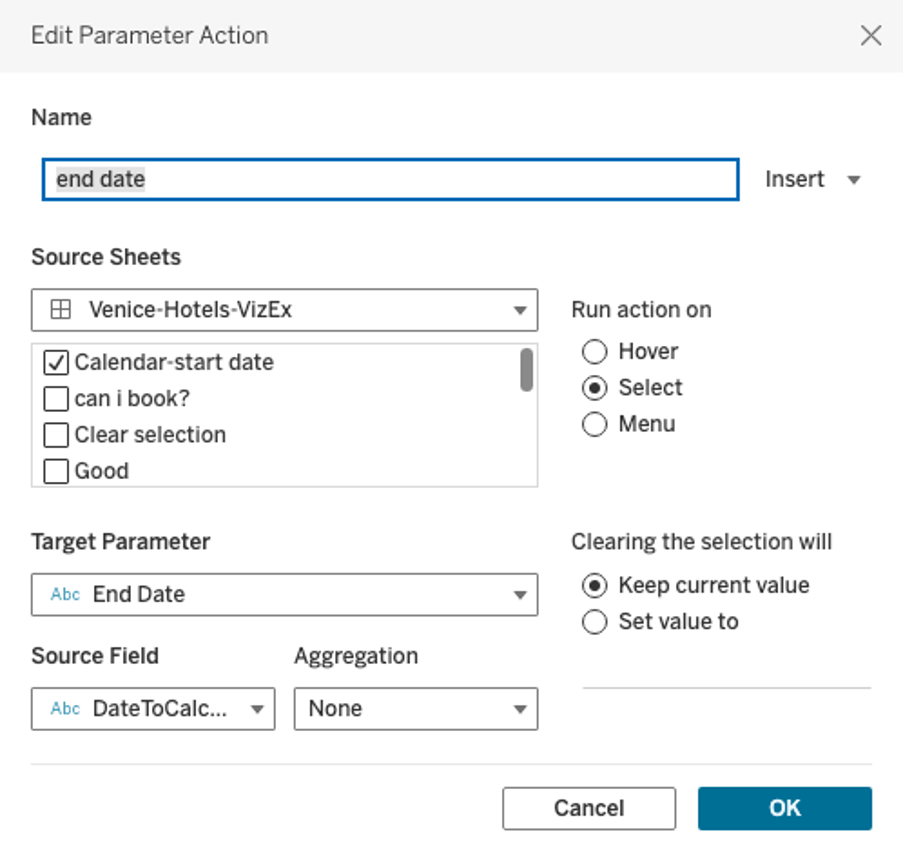
Parameter actions
The final step with parameters is the parameter actions. We need four parameter actions to define/clear the start and end dates.

Clear Button
The dashboard needs a clear button so that in case the user wants a different period, they will be able to clear the selection. For this reason, we create a sheet like the following:
Using the dashboard actions, we stop marks in this worksheet from being highlighted when ‘clicked’ in Tableau.
We hope you enjoyed learning more about this use case and dashboard development. Check out our website and download this workbook for free! Enjoy!


