Building an Advanced Insurance Portfolio Dashboard using SuperTables and PowerKPIs Viz Extensions
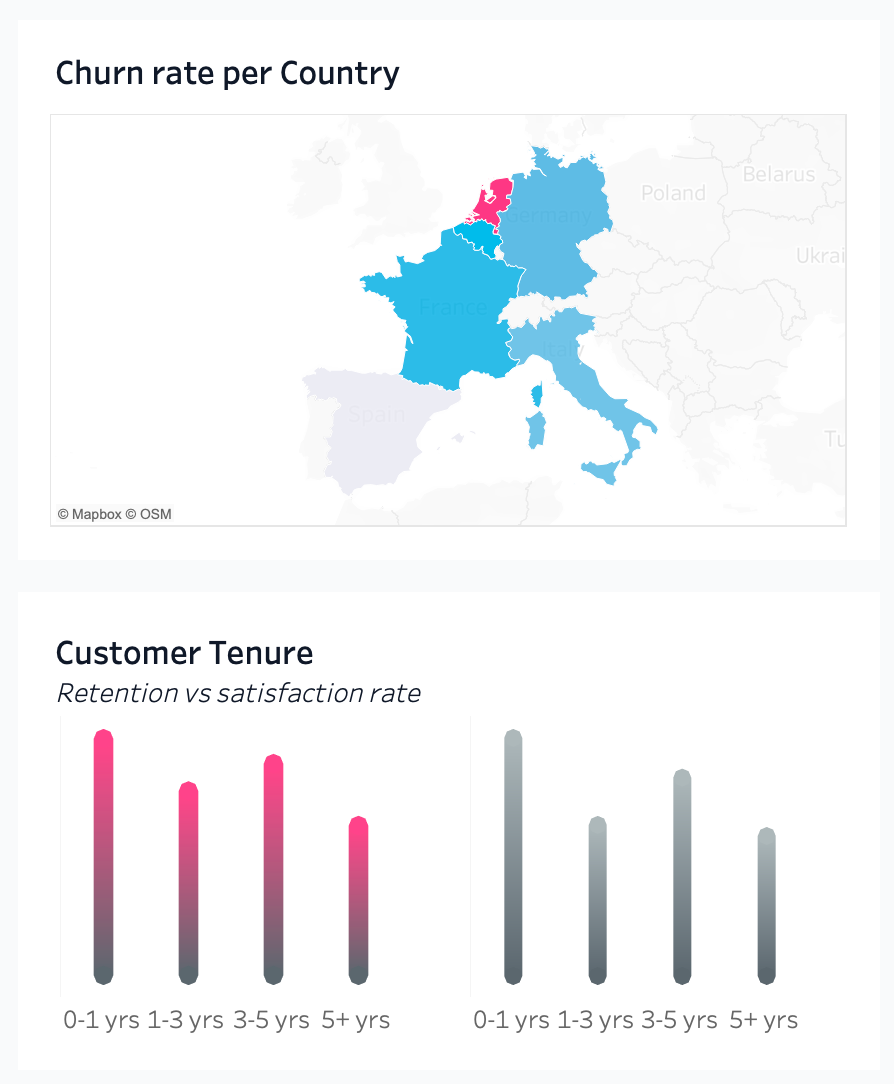
In today’s insurance industry, making data-driven decisions quickly is crucial for success. This powerful Tableau visualization helps insurance companies track customer retention, profitability, renewal rates, and lifetime value metrics.
I’ll walk you through how to build this dashboard that combines Tableau’s native capabilities with advanced Extensions like SuperTables and PowerKPIs Viz Extensions to create a comprehensive analytics solution.
The Business Challenge
Insurance companies face several key challenges:
• Monitoring customer retention and churn across different regions
• Tracking policy performance metrics in real-time
• Managing broker relationships and performance
• Analyzing profitability across different insurance products
• Understanding customer lifetime value and satisfaction
Dashboard Components Breakdown
Why PowerKPIs?
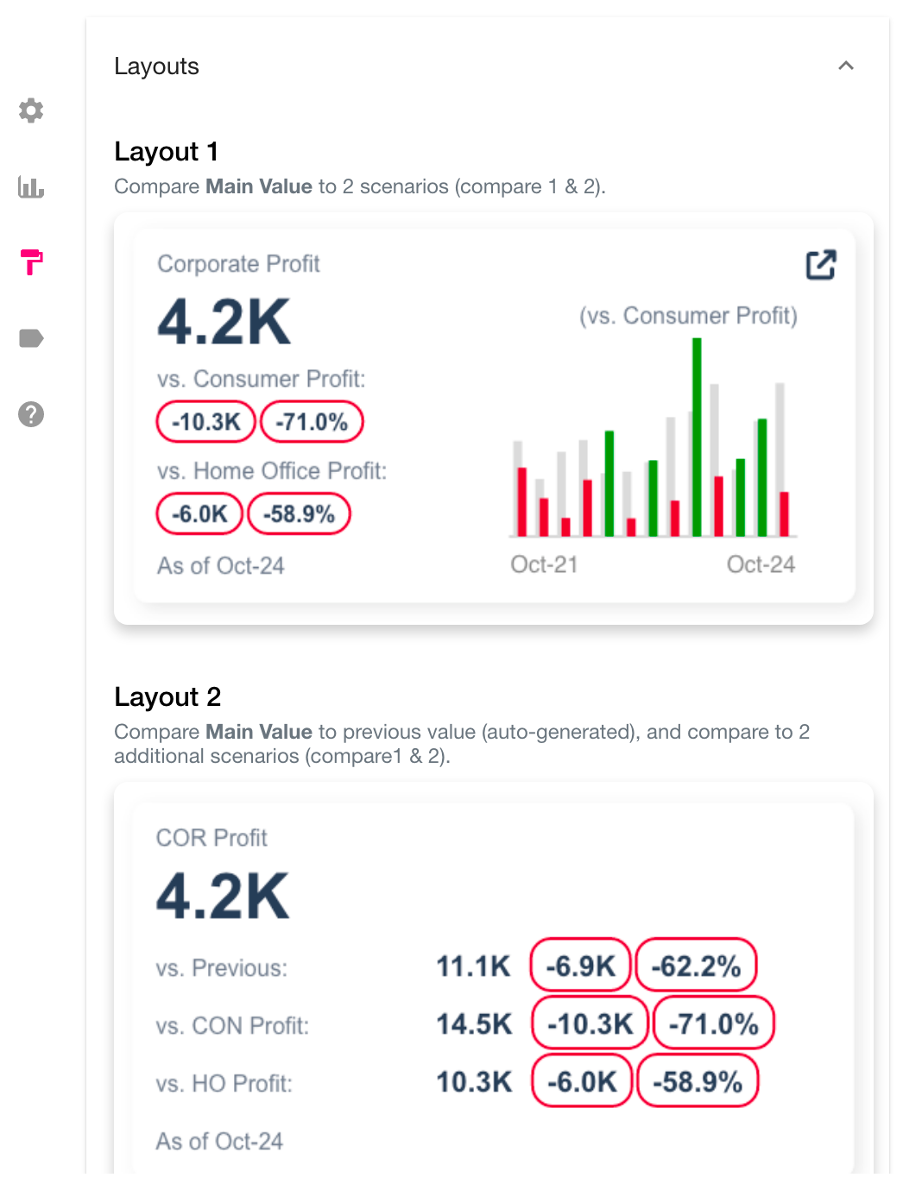
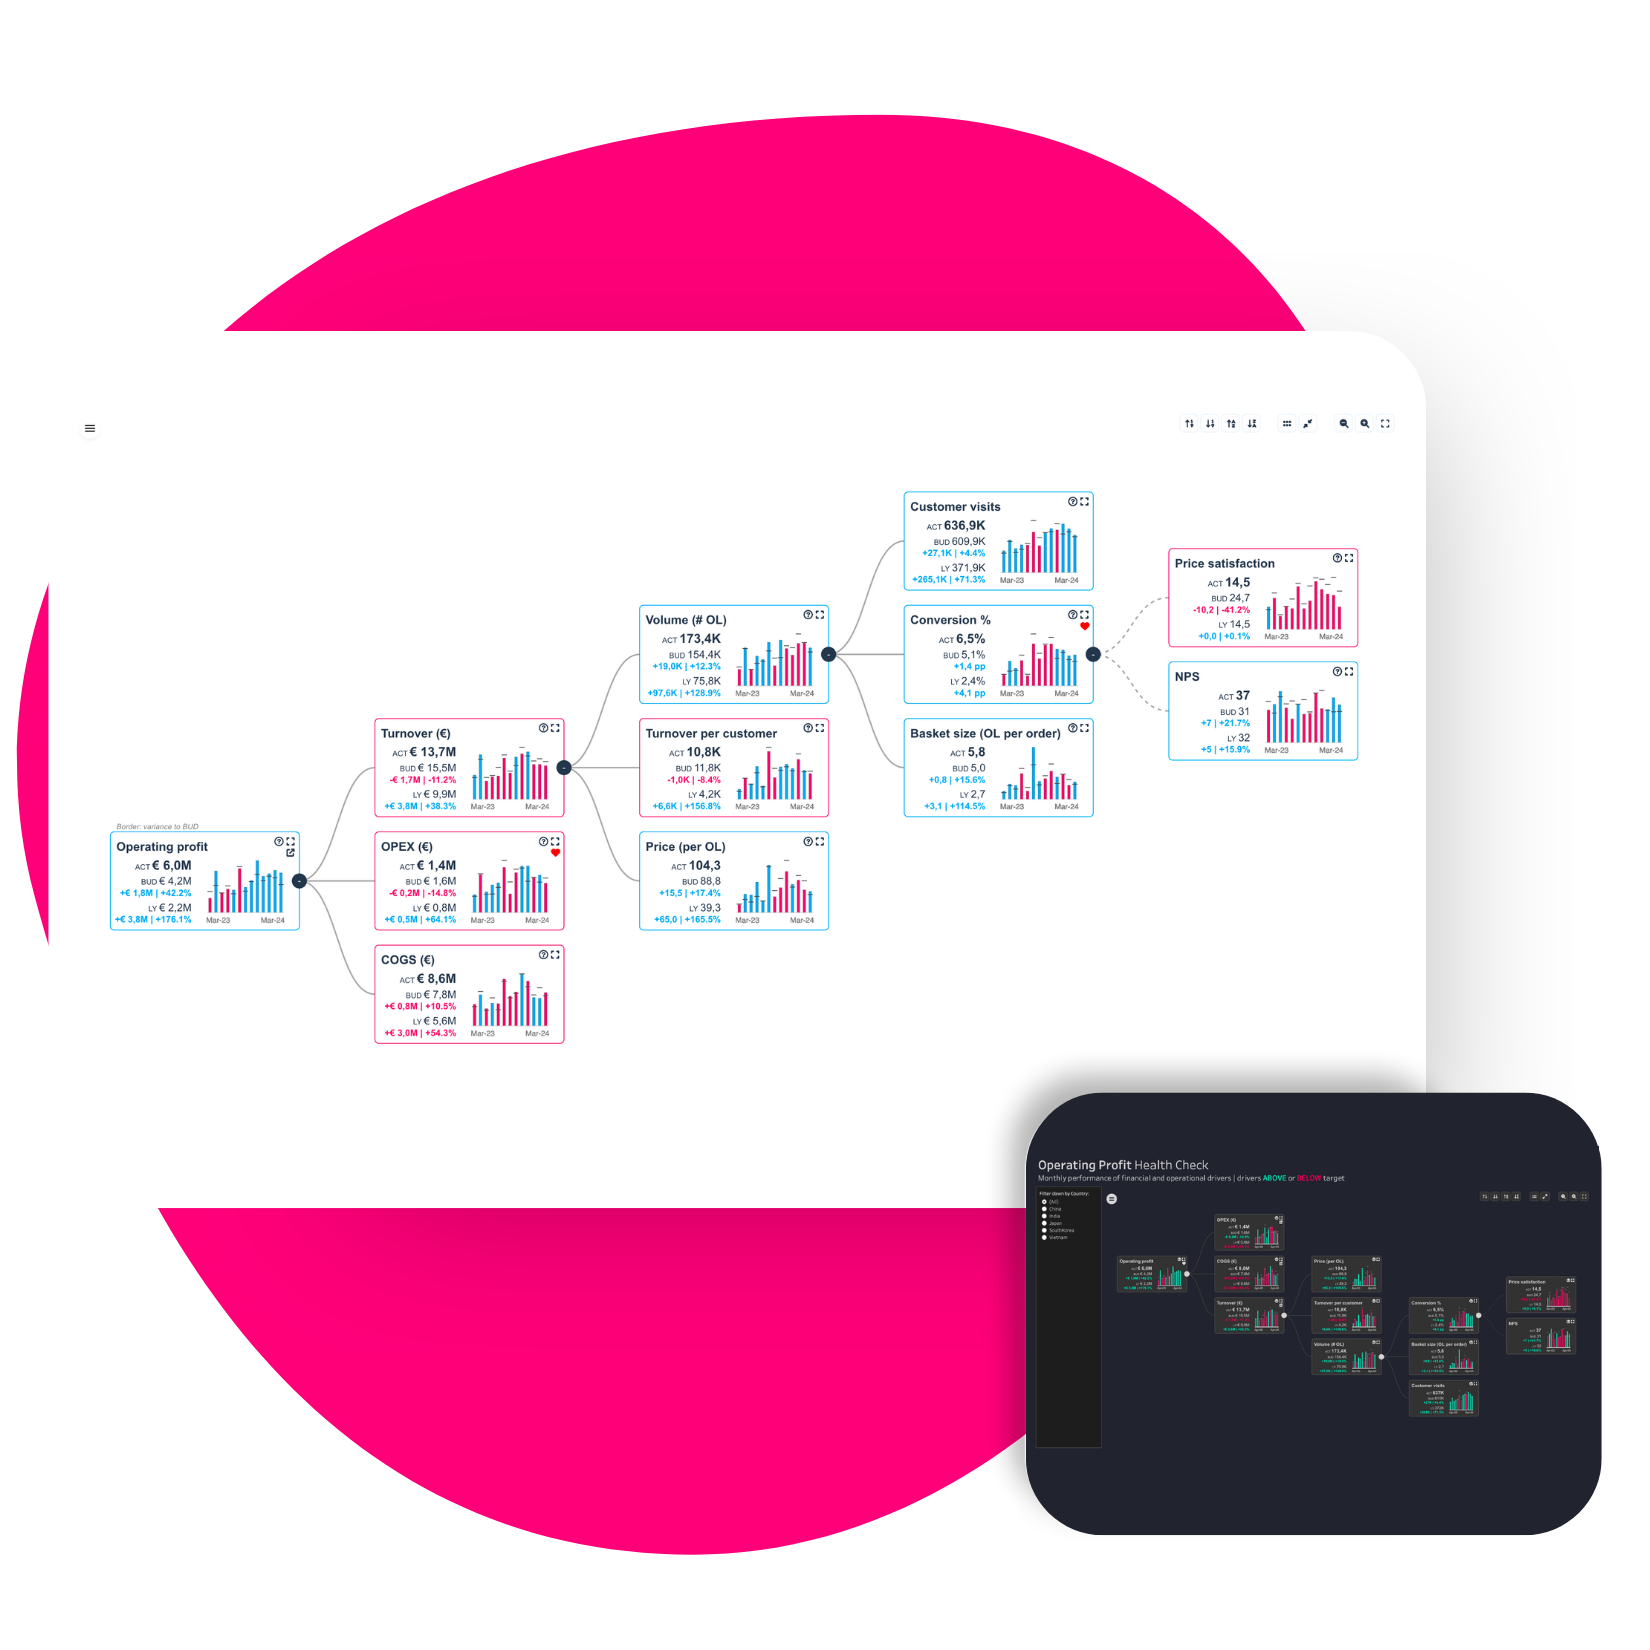
The top section features five critical metrics displayed as trend cards, each showing historical performance and comparison to previous periods. A big advantage of PowerKPIs is that there is no need to create individual charts and calculations since it can all be configured within a few clicks. As for formatting, there are many ways you can customise the cards to match the theme of your dashboard or even complement it, such as changing icon colours, borders, chart types and layouts.
1. How to add PowerKPIs?
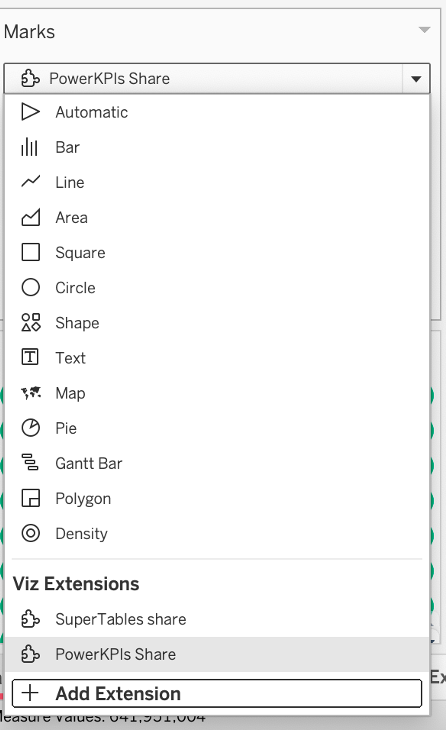
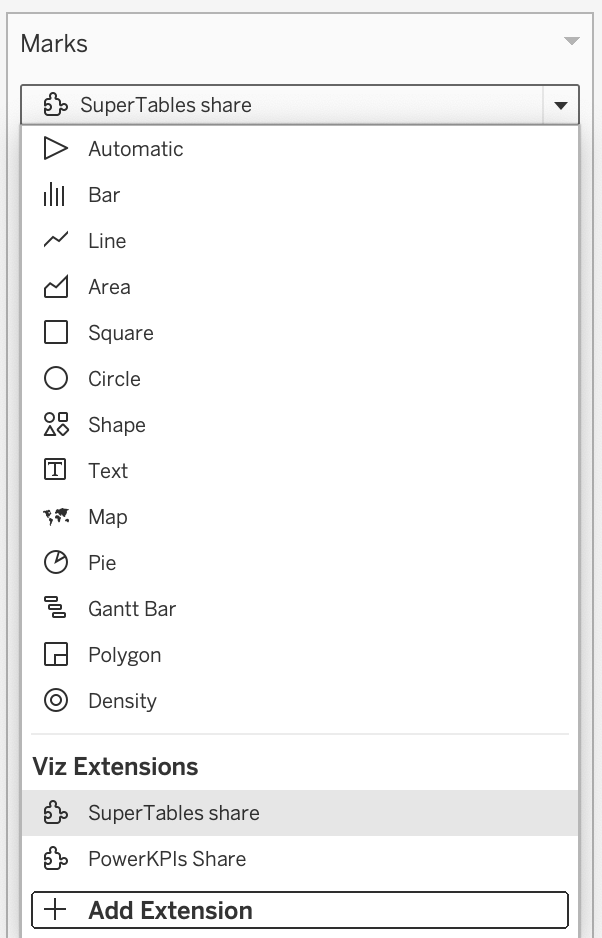
The Extension can be selected from the marks card after downloading the Trex file from a trial (Download here) or the free version from the Tableau Exchange.
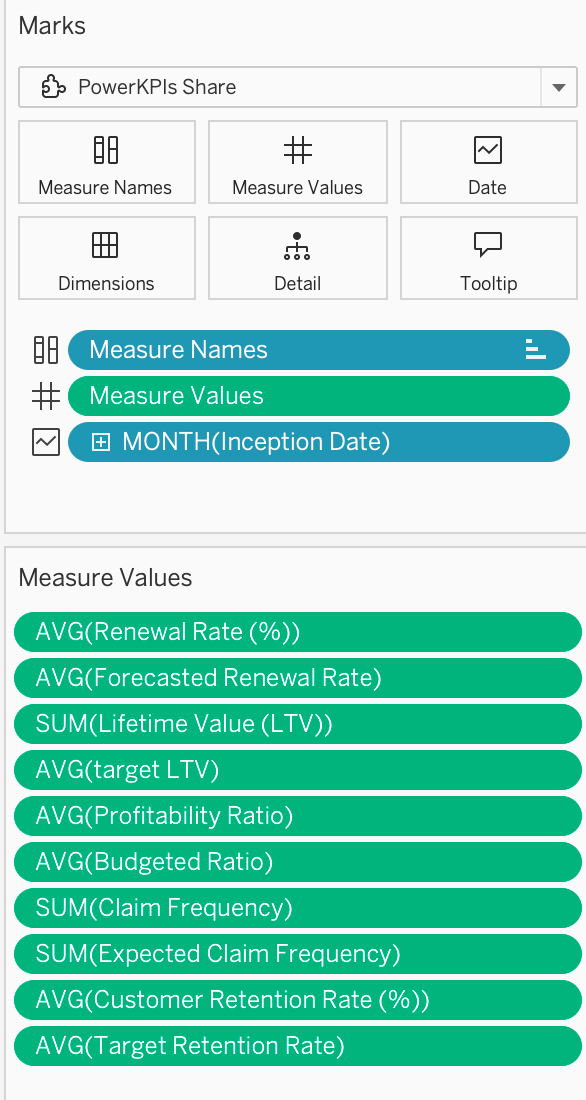
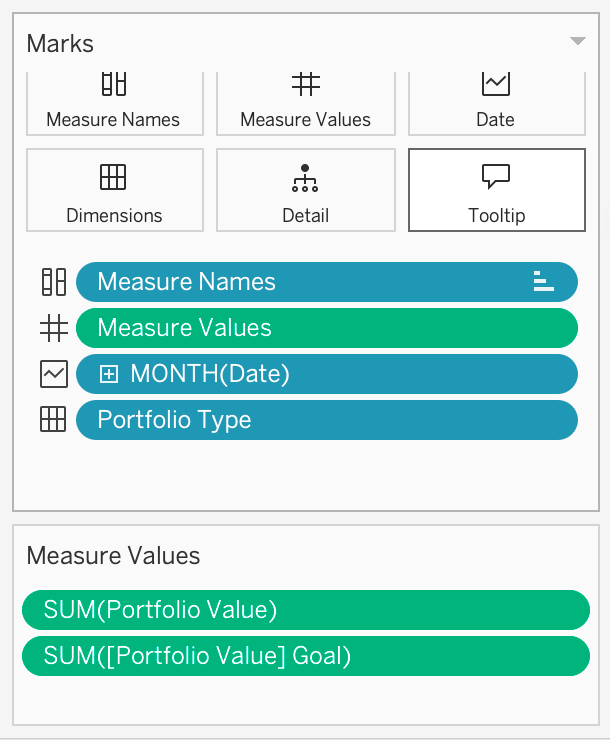
Next, add the required measures and dimensions to the Marks card.
1. PowerKPIs
We’ll begin with the overview dashboard
• Create a new worksheet in Tableau
• Add the PowerKPIs Extension from the marks card to your new sheet.
Next, add the required measures and dimensions to the Marks card.
And that’s it! PowerKPIs is ready.
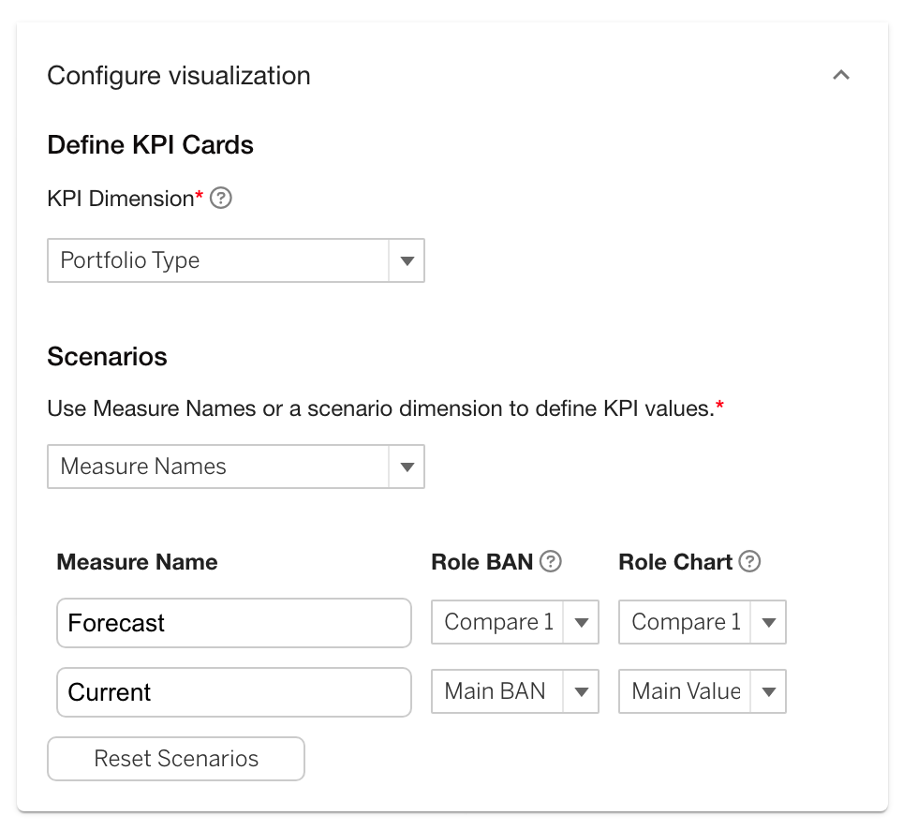
We have a measure for main value and another one for the comparison values. Once done click on the gear icon to start configuring.
Assigning the fields for main and comparison values
In this case, a KPI card per measure member has been selected, and we need to group scenarios into one card. Each measure has a predicted/budget value which has been entered under the Scenario label, as this will not be the main value the compare 1 option has been selected for both roles of the chart.
The calculations against the predicted values will be automatically computed
• Optional step – Customize the design
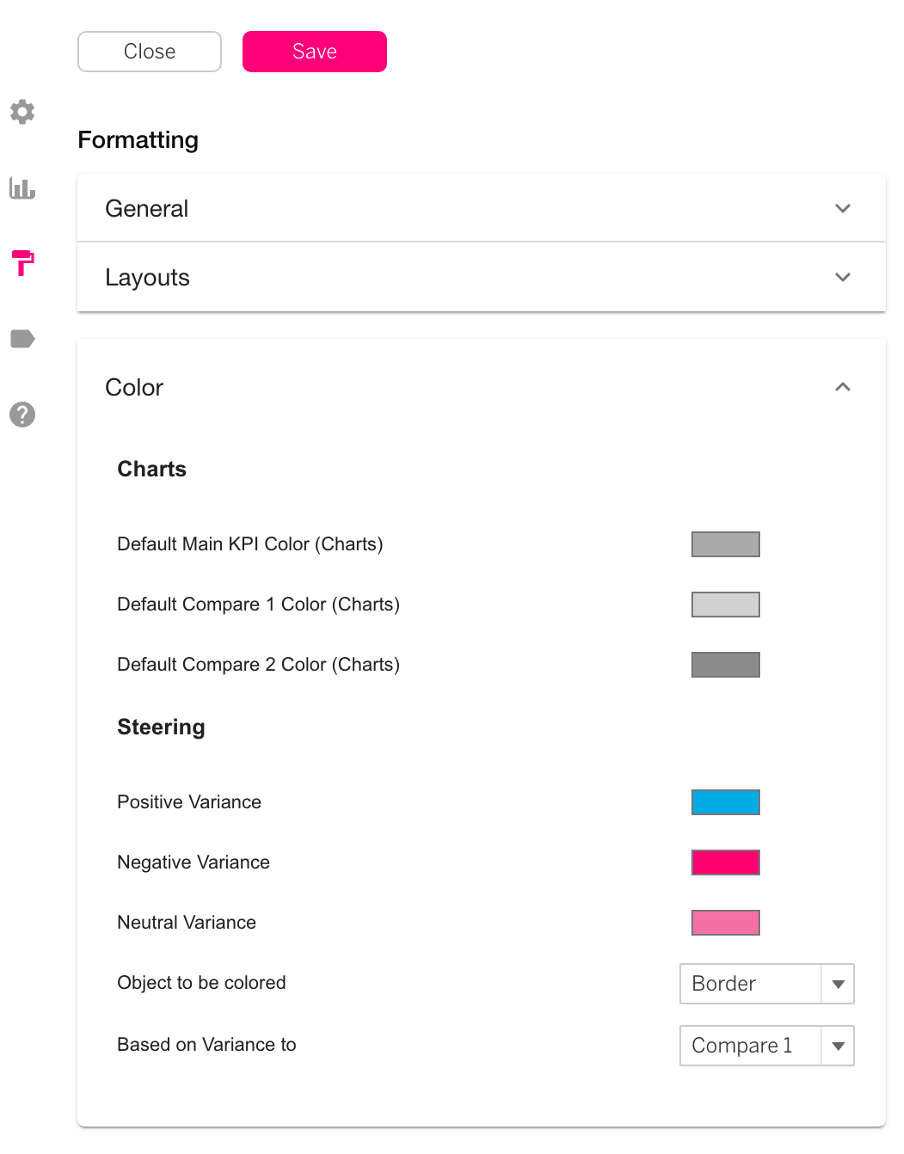
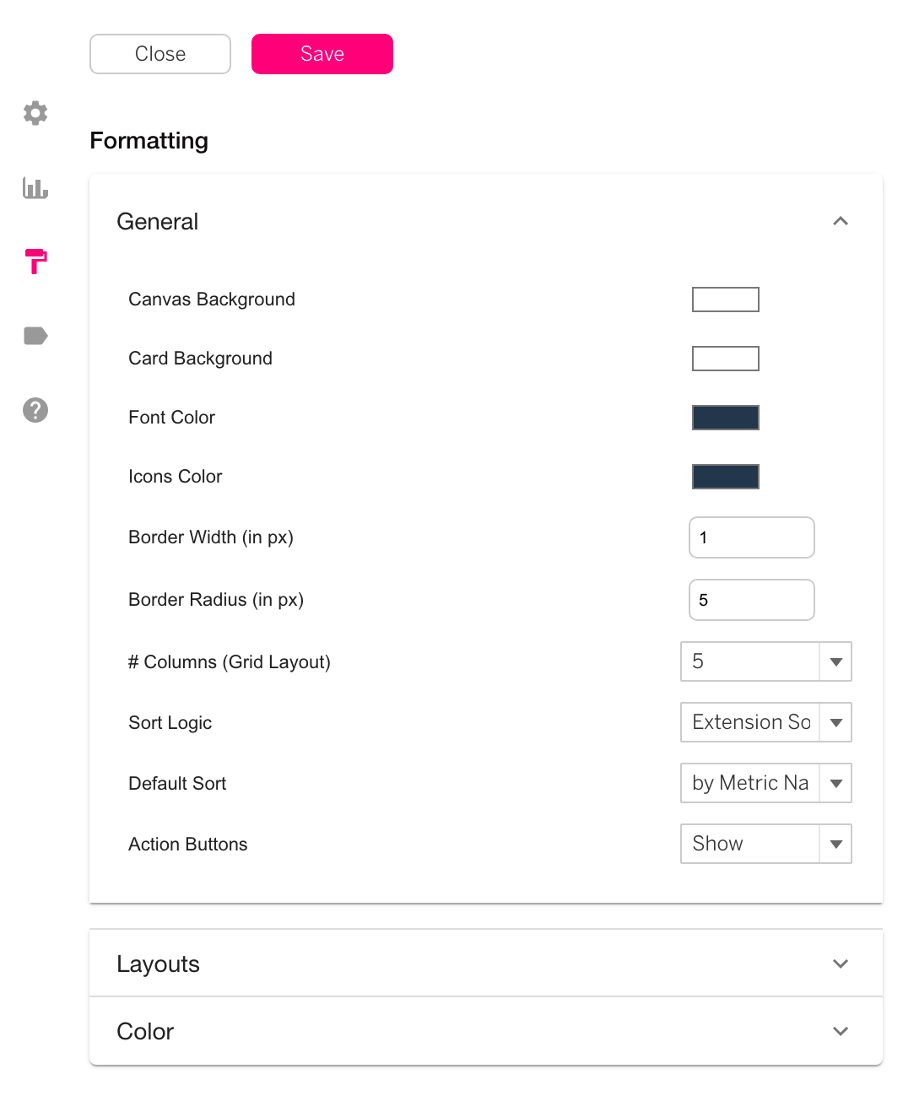
You can go into the formatting tabs to change the colors and layout of your cards:
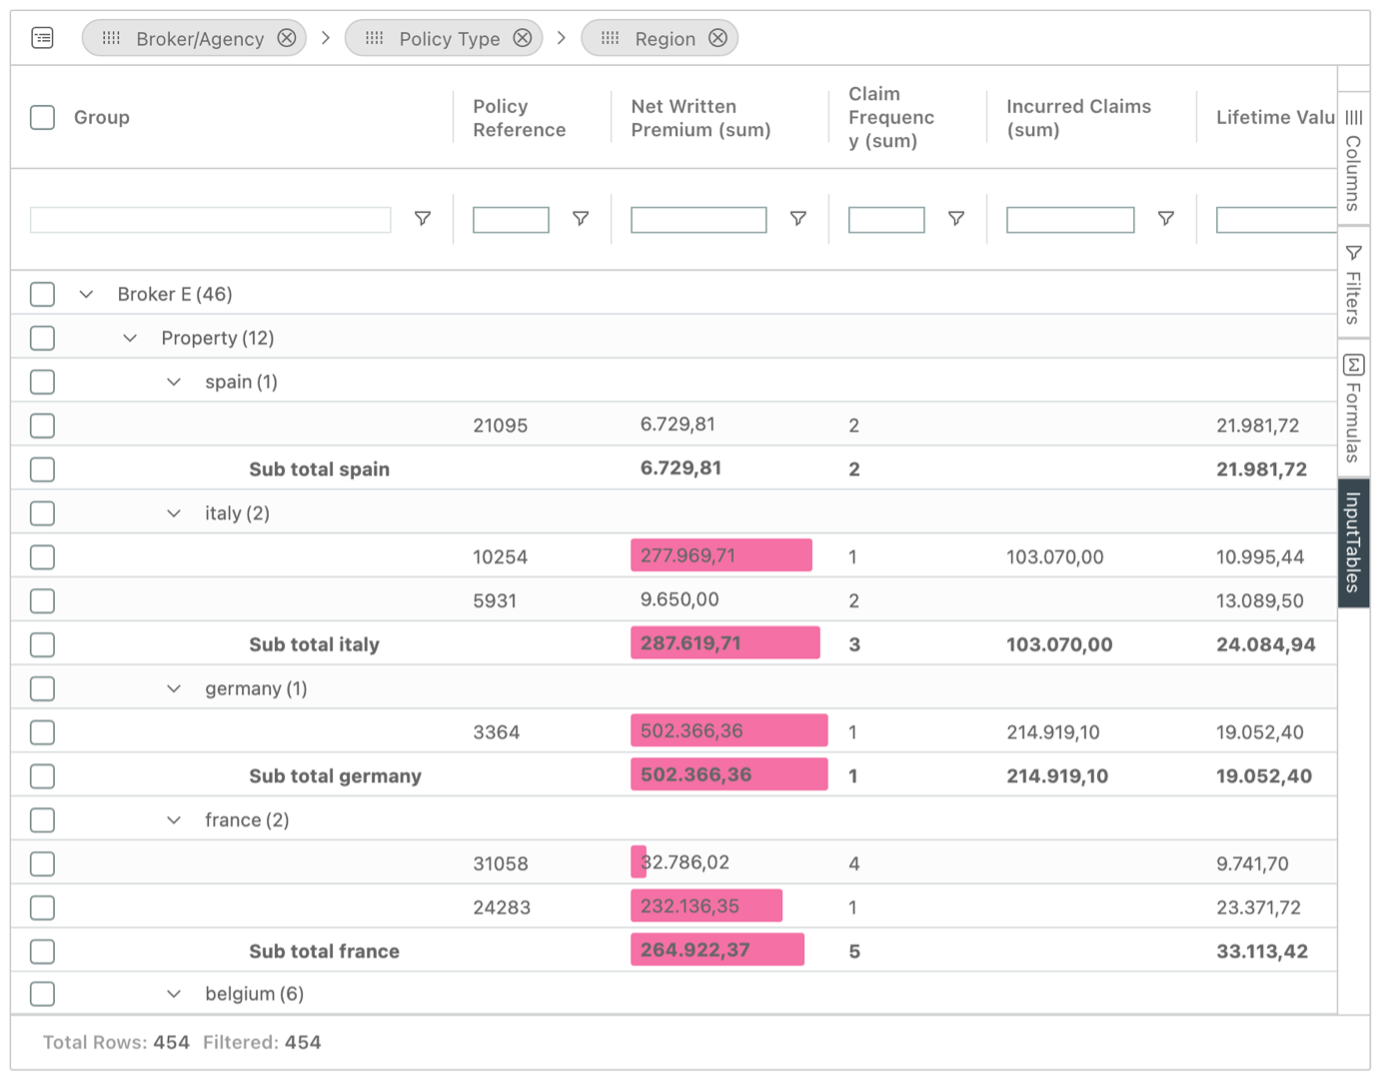
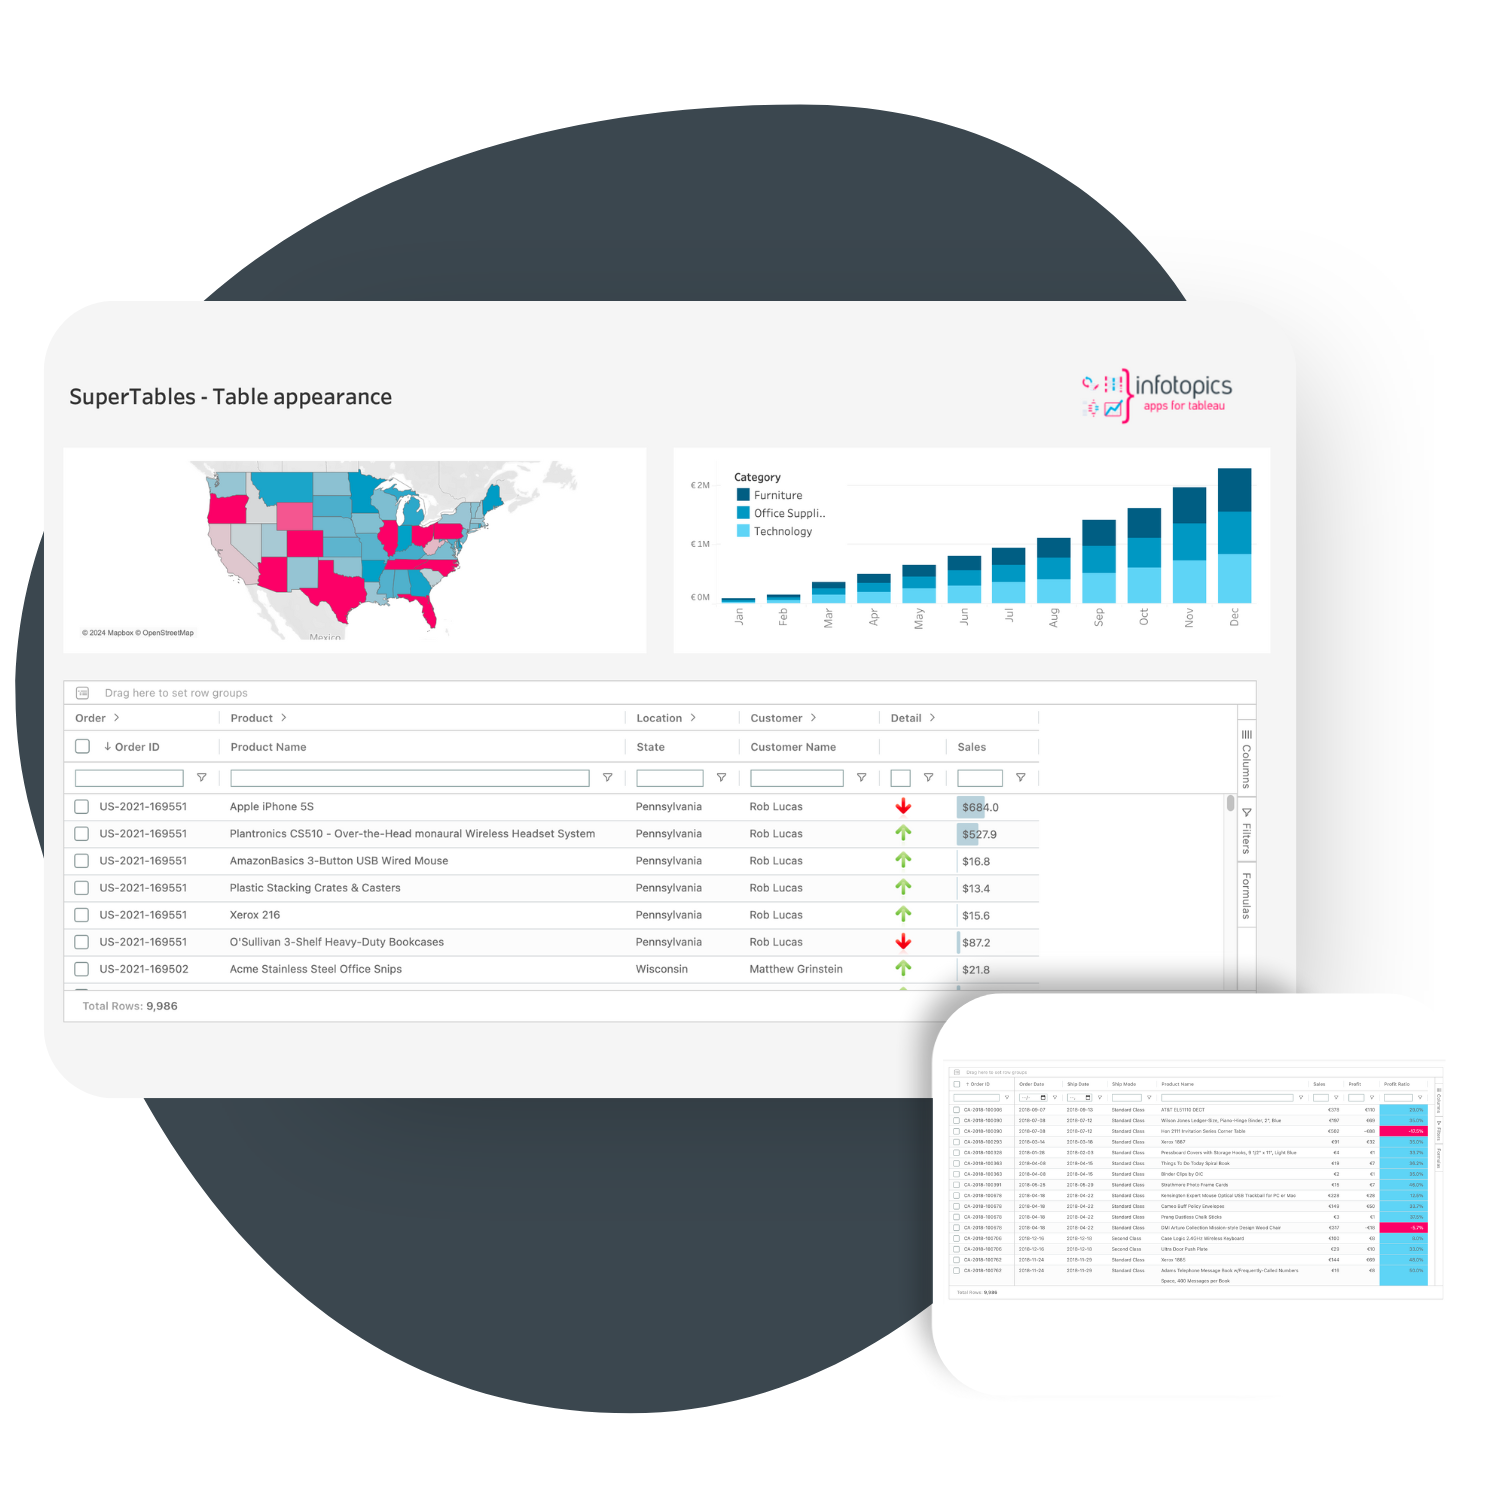
2. How to Build the SuperTables View
The process of implementing SuperTables involves several key steps:
1. Just like previous part, download the SuperTables Trex file and select your file (download your trial) from the Marks card or use the free version from the Tableau Exchange.
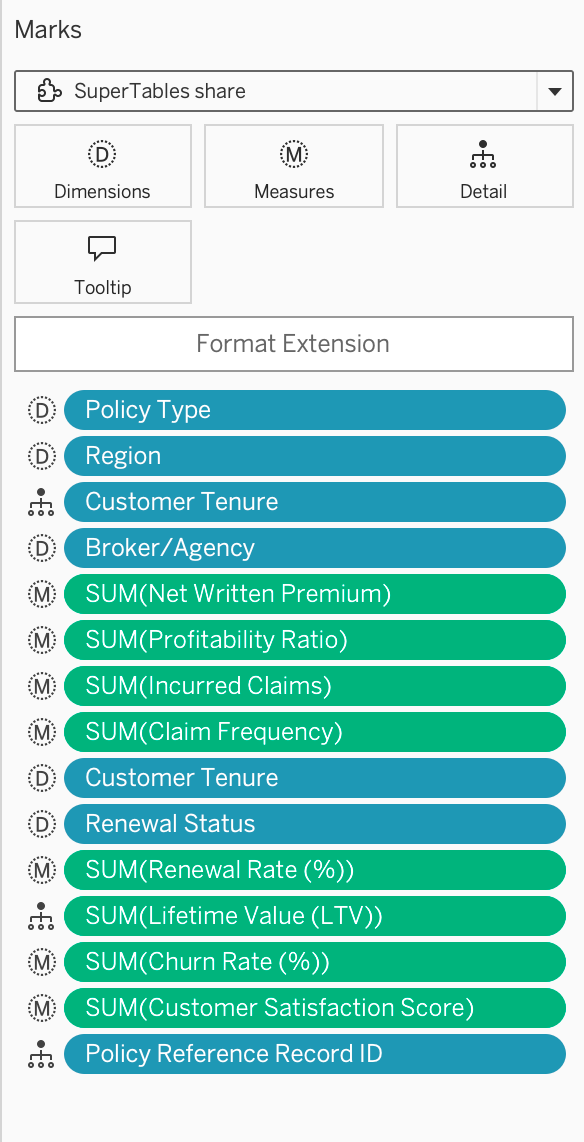
2. Add all the fields that you need to the Marks card
3. Formatting (optional)
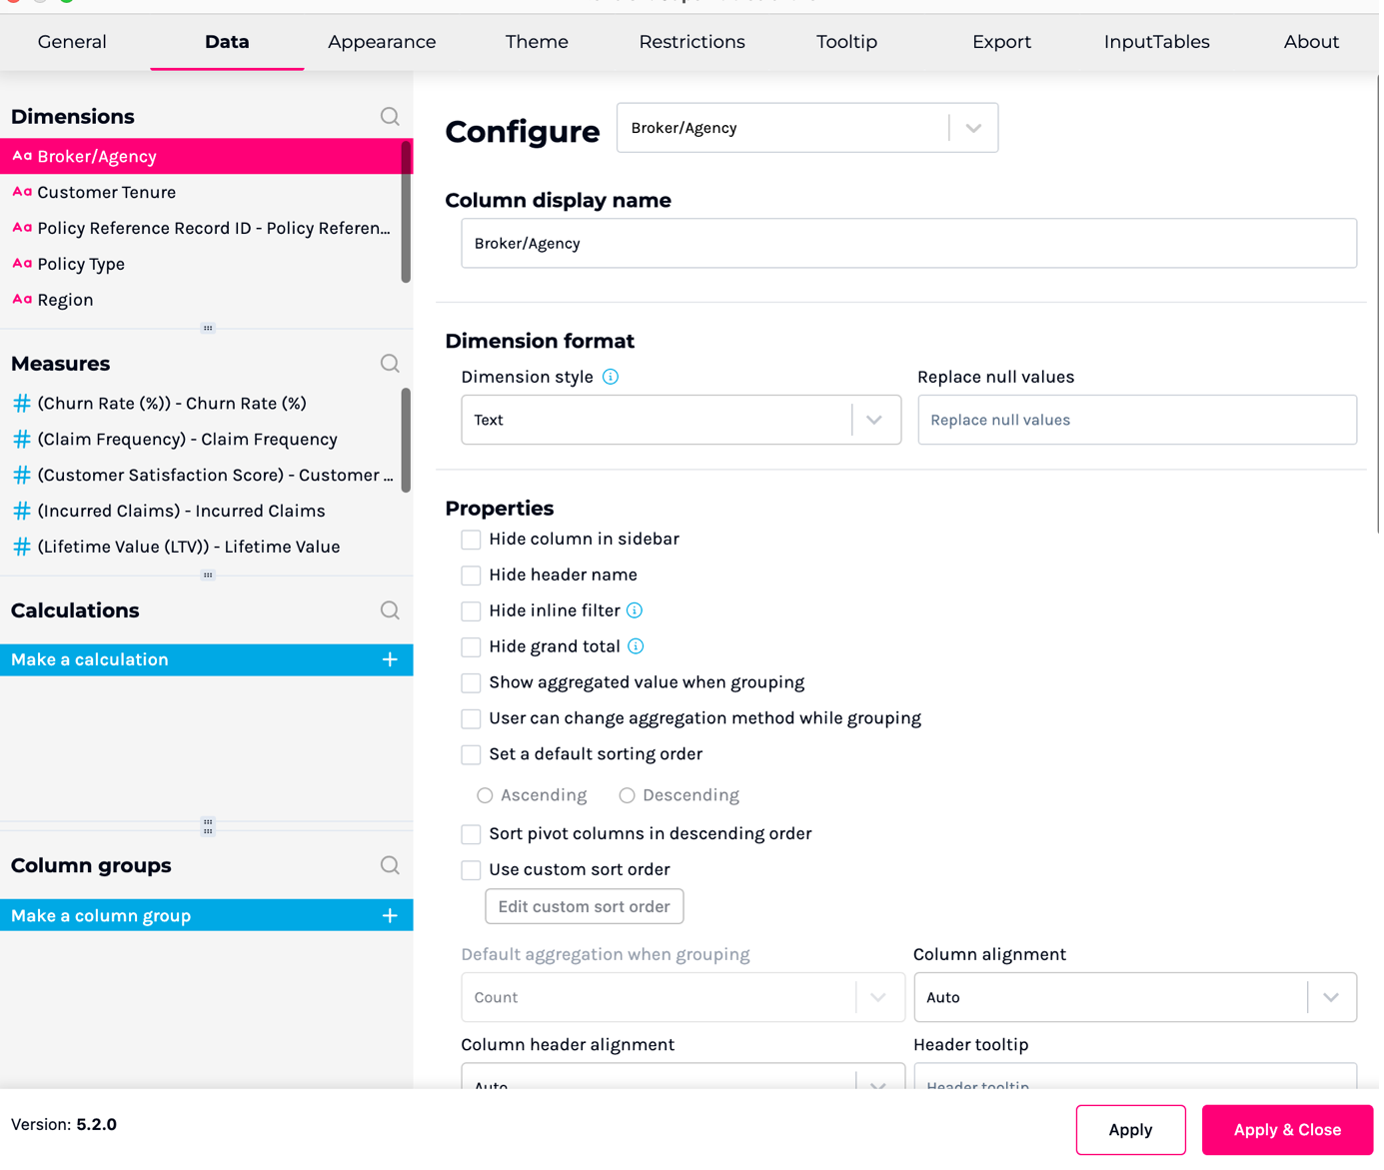
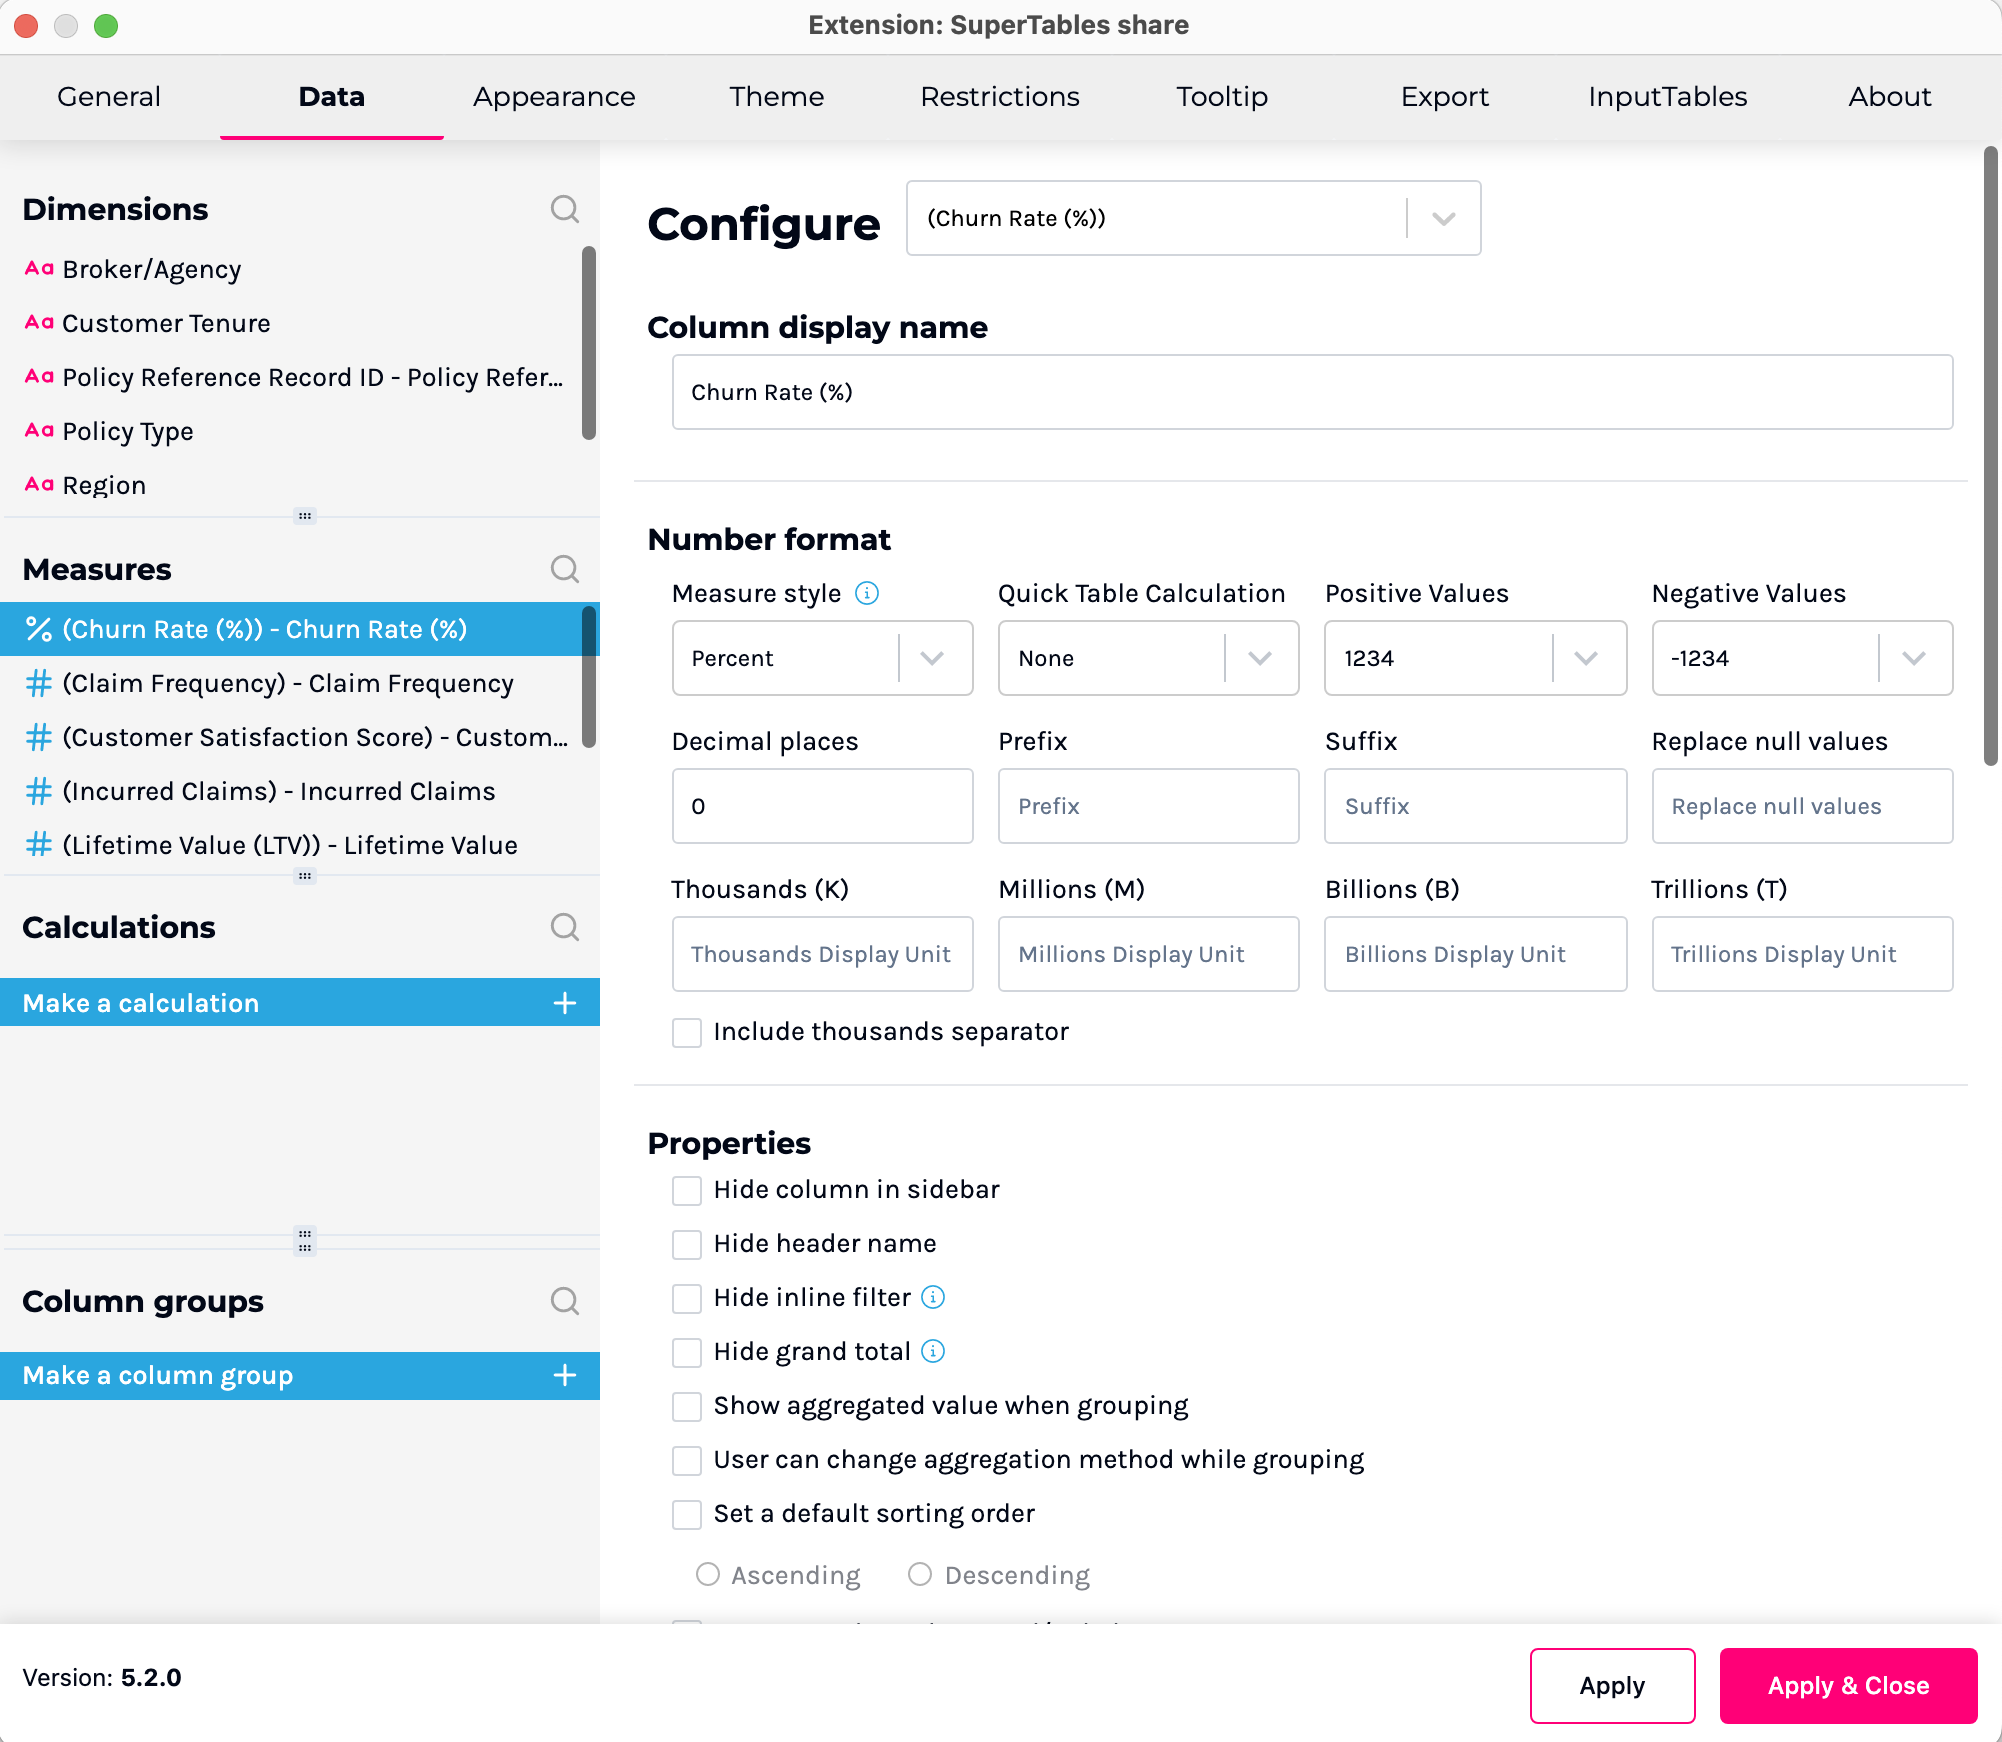
In SuperTables, you can customise how data is displayed to better suit your analysis and presentation needs.
You can adjust the formatting through the configuration section. Here, you’ll find options to modify both measures (numerical values like sales, profits, or rates) and dimensions (categories like regions, products, or time periods). You can specify how these elements should appear—for example, you might format a measure to display as currency with a “$” symbol or set a percentage to show with two decimal points (e.g., 23.45%). This level of customisation ensures your data is clear, and easy to interpret.
How to have multiple layouts within one table?
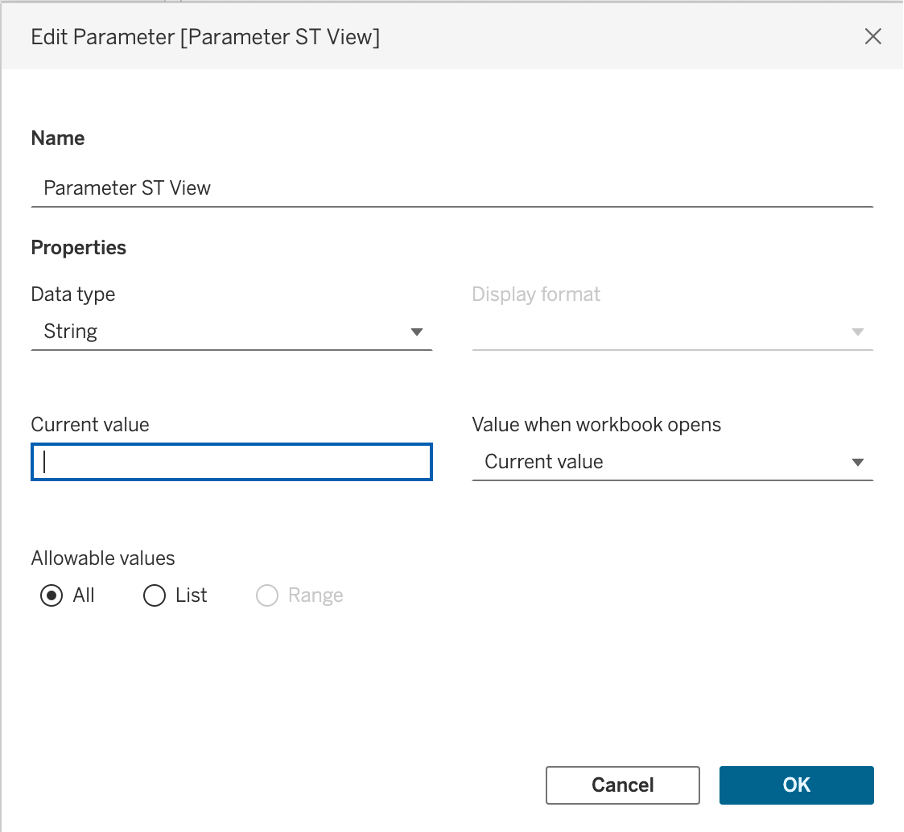
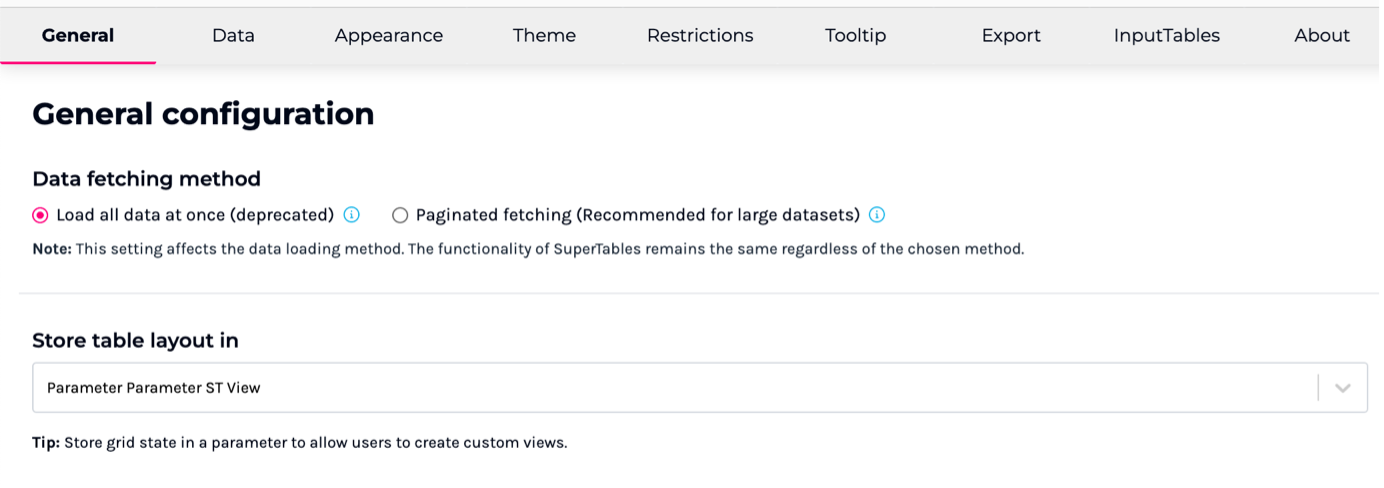
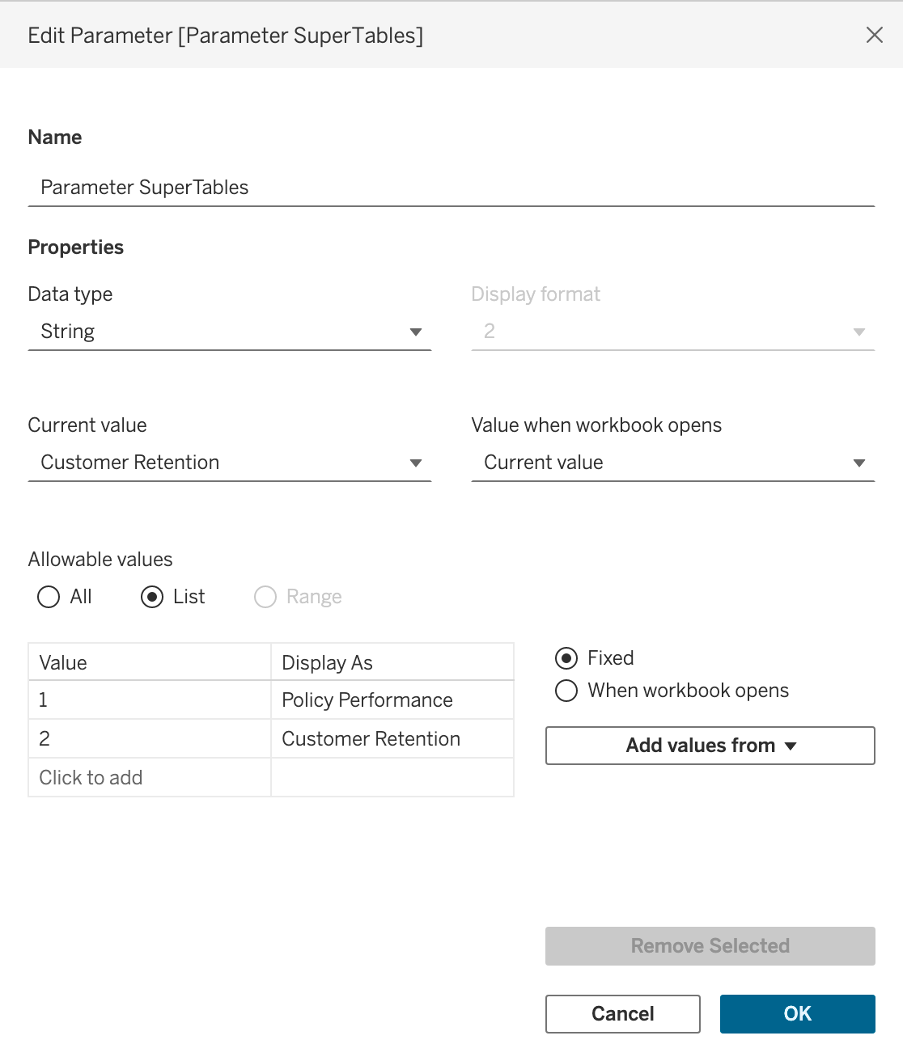
Once you’re happy with your design and layout, we need a parameter to store this table and build a second layout in the same table.
1. Create a string parameter
2. And add this parameter to your SuperTable:
3. Now we need a second parameter as below:
4. Now finish your second layout as before
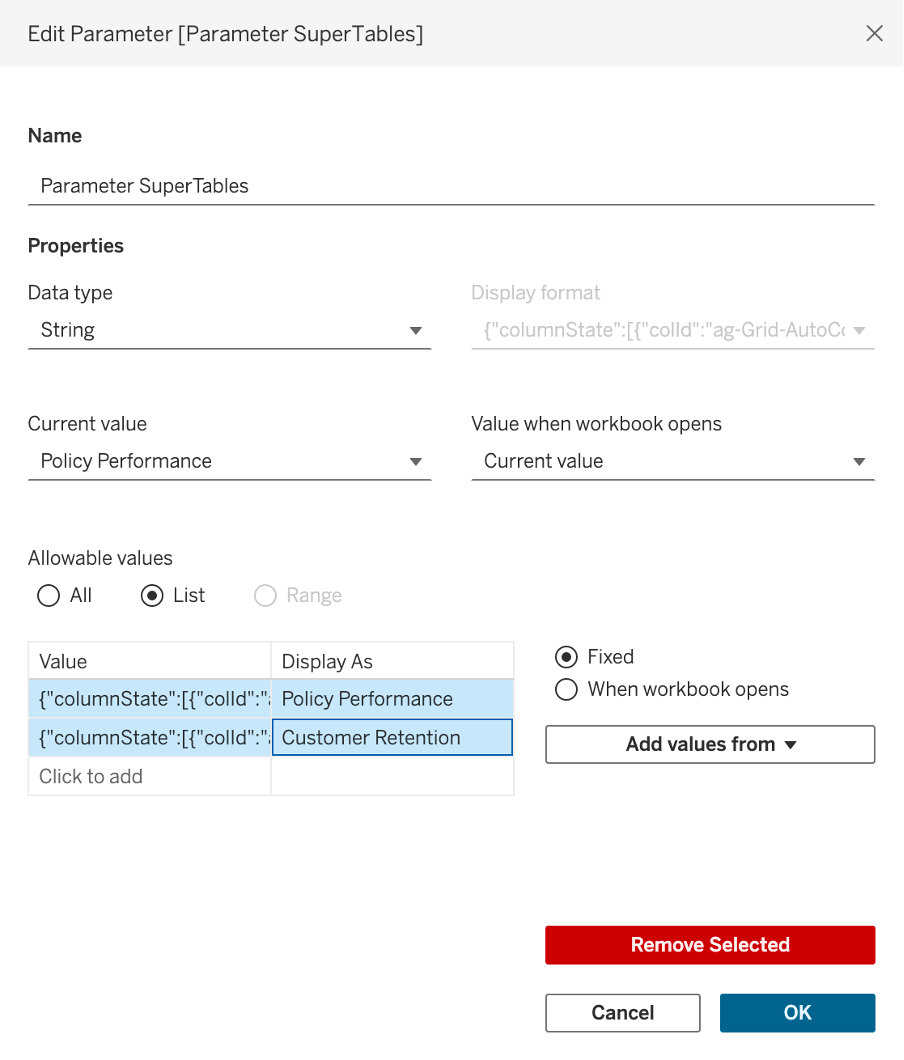
5. Once again copy the value of the first parameter in a note
Now you have both values for the layouts you created, we need to paste them in the second parameter as below:
6. The final step
Right click on the parameter “parameter SuperTables” and select show parameter, now when you select a different value in this parameter the table will change accordingly.
Additional Details
I have added a final section for more details and insights using native Tableau charts. You can use any sheet as a filter, and Viz Extensions will be filtered like any other sheet in Tableau.
This solution provides a powerful way to visualize and analyze insurance portfolio data, making it easier for teams to make informed decisions quickly. The combination of PowerKPIs and SuperTables Viz Extensions creates a flexible, user-friendly interface that can adapt to various business needs.
Ready to transform your Insurance Analytics? Download our template and start building your custom insurance portfolio dashboard today.
