Using “datasheets” to supply data to extensions
A lot of extensions need access to data in order to function. However, it is often undesirable for performance and usability to have the extension share data with an existing worksheet. For this reason we recommend using a datasheet to get the most out of your dashboard and extension in terms of performance and user experience.
If you have a extensions related question, please contact us through support!
Creating your datasheet
For the purpose of this Tableau Tip, we will assume that you have Tableau 2019.1. Since all Tableau users have access to the Superstore data set, this tutorial will use this set. These basic steps are applicable to your own data sets as well, so feel free to use that instead.
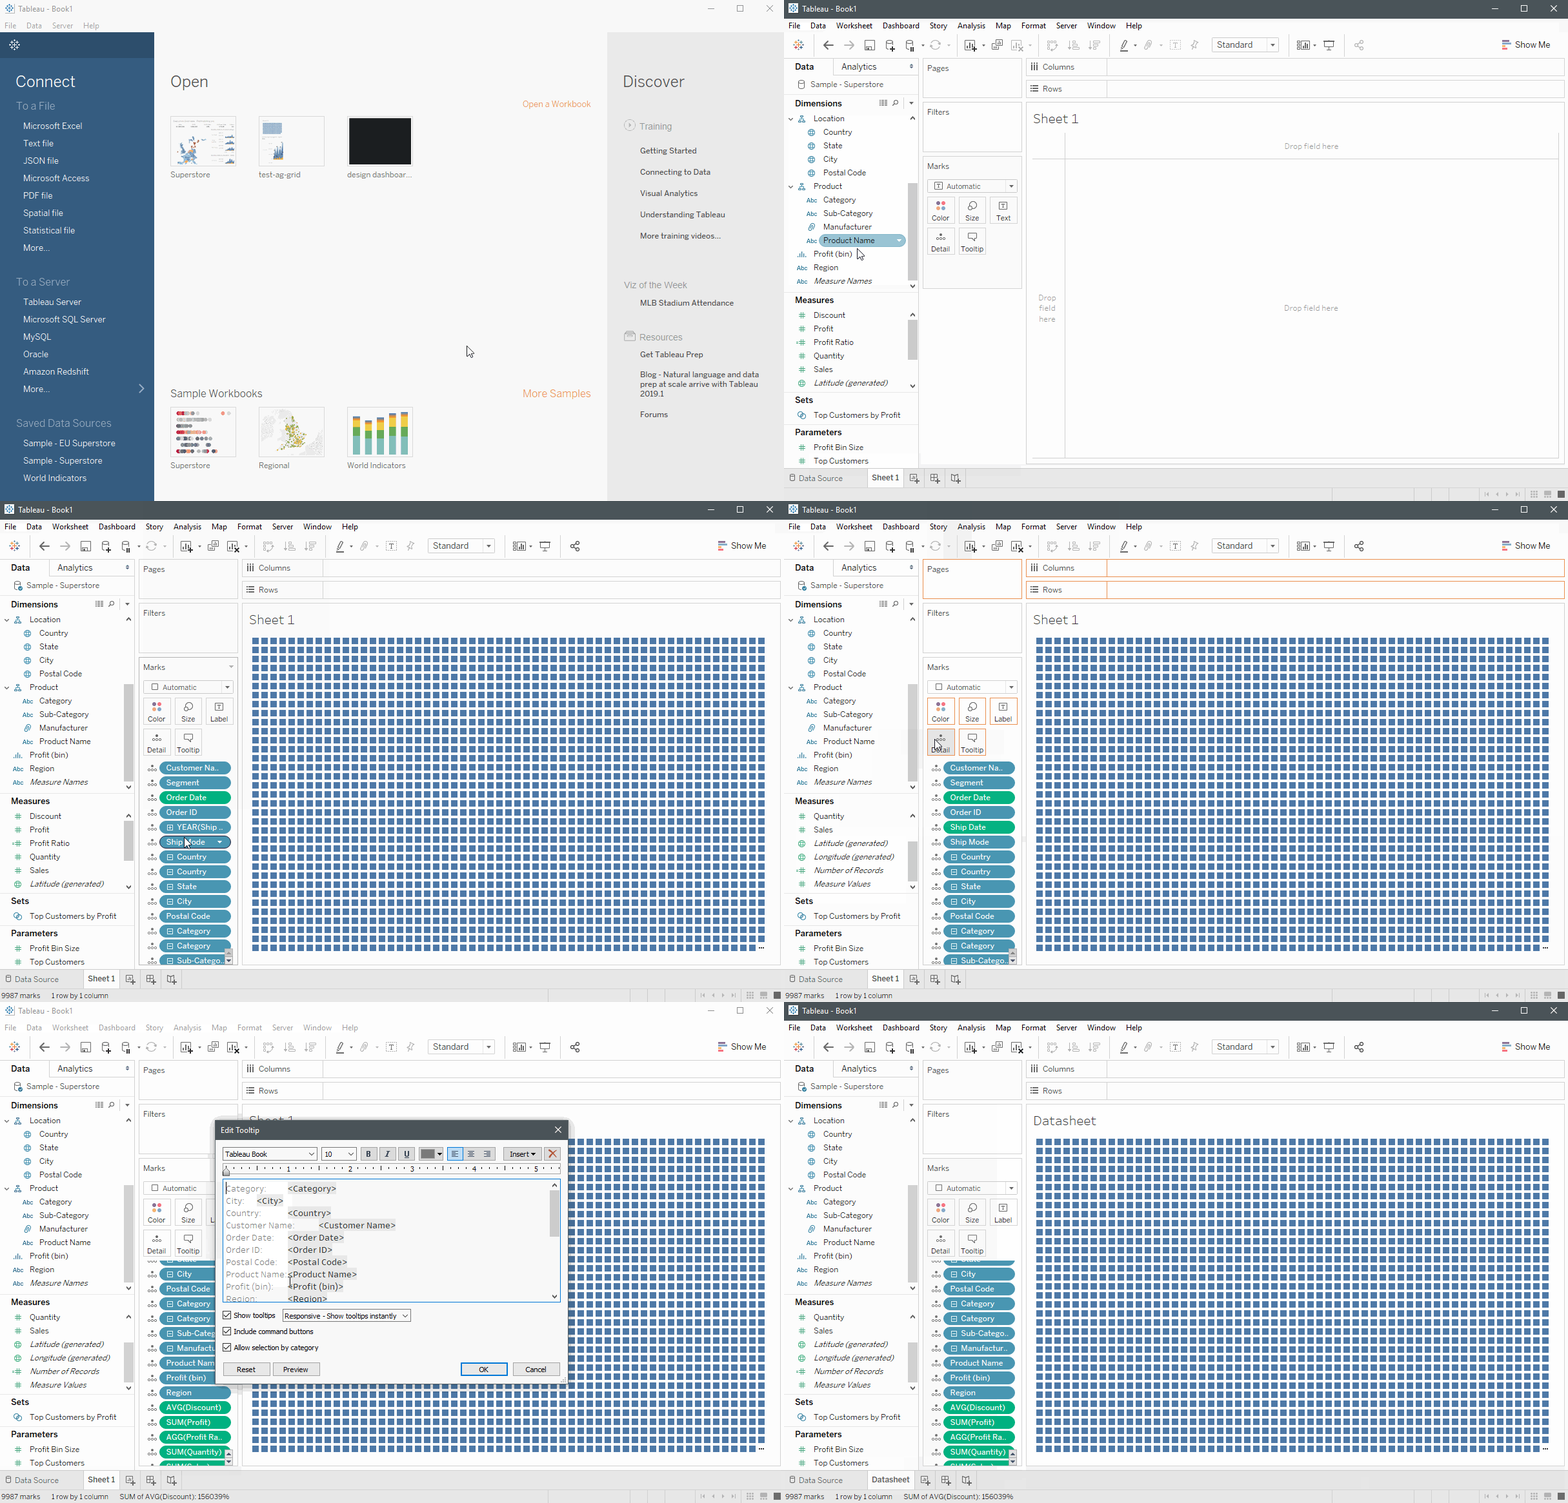
We will start by opening (or creating) an empty worksheet. Next, we add all dimensions and measures from their respective panes to detail in the marks card. In most cases you should not include generated fields such as Measure Names and Measure Values since the extension will not be able to use those properly. Adding fields to details like this is the most performant way to get them into your summary data which extensions can access. By adding or removing fields from details, you can decide which fields the extension will show.
3 Quick Tips
- Select the first dimension/measure in the pane by clicking on it, scroll down and hold shift when selecting the last dimension/measure to quickly select them all.
- When your Dimensions contain dates or date-times and you want to use these as dates in an extension, be sure to set the aggregation method to ‘Exact Date’.
- Disable tooltips for the datasheet. Since the datasheet tooltips will never be used telling Tableau to not bother generating them will give you an extra performance boost.
Adding a datasheet to a dashboard
Create a new, empty, dashboard and add the sheet created in the first step by dragging it from the Sheets pane into the dashboard. Since this is not the prettiest sheet we can hide it by going to the Layout tab, setting the sheet to “floating” and changing its width and height to 1 (be sure to press enter after changing the either dimension 1 or you might get an error).
Now drag an extension zone onto the dashboard from the Dashboard Objects pane. When configuring the extension, make sure to select the datasheet you created as the source of the extensions data. Now you can configure the extension and build out the rest of your dashboard!
We love to make solutions and help Tableau users to do things more efficiently. If you have feedback, ideas, questions or need support, please make sure to share it with us! Also, don’t forget to follow us on social media for our latest news and updates.


