Extensions for Industries
Healthcare services solutions.
Step into the future of healthcare analytics.
Empower your healthcare organization with cutting-edge data analytics using our solutions. Visualize your real-time medical data and gain actionable insights for patient care, treatment effectiveness, resource allocation, and operational efficiency. Discover the potential of your data for better collaboration and make informed decisions that create lasting impact.

Industry leaders who already experienced the power of our solutions.
Transforming KPI Reports in Tableau
Inova, a healthcare organization with over 20,000 employees and five hospitals, needed to provide a dashboard that the organization could use t o track their KPI’s across a complex, matrixed organization that includes the overall health system, 11 Service Lines and 5 hospitals. Each group had their own distinct KPIs and targets, making it a complex task to create a KPI report in Tableau.
Supercharging data insights and boosting efficiency
With WriteBackExtreme and ScrollyTelling, Pfizer can create dashboards with key data, which are presented during top-tier meetings. Furthermore, viewers can easily add comments to important marks directly in the dashboard. These dashboards have over 5000 viewers from all over the world and save extensive amounts of time for the creators. Users gained valuable insights by leaving important comments directly in the governed environment of Tableau.

“When we present information related to particular diseases or processes and stakeholders observe the patterns revealed by our advanced technologies, they gain a deeper understanding and trust in the results generated by our AI models. Even if they are not fully familiar with AI, Apps for Tableau solutions assists them in comprehending and relying on the outcomes effectively.”
– Kelly D. Myers – CEO & Founder Atomo
Learn from real life use cases.

Revolutionize healthcare data with trusted partners.
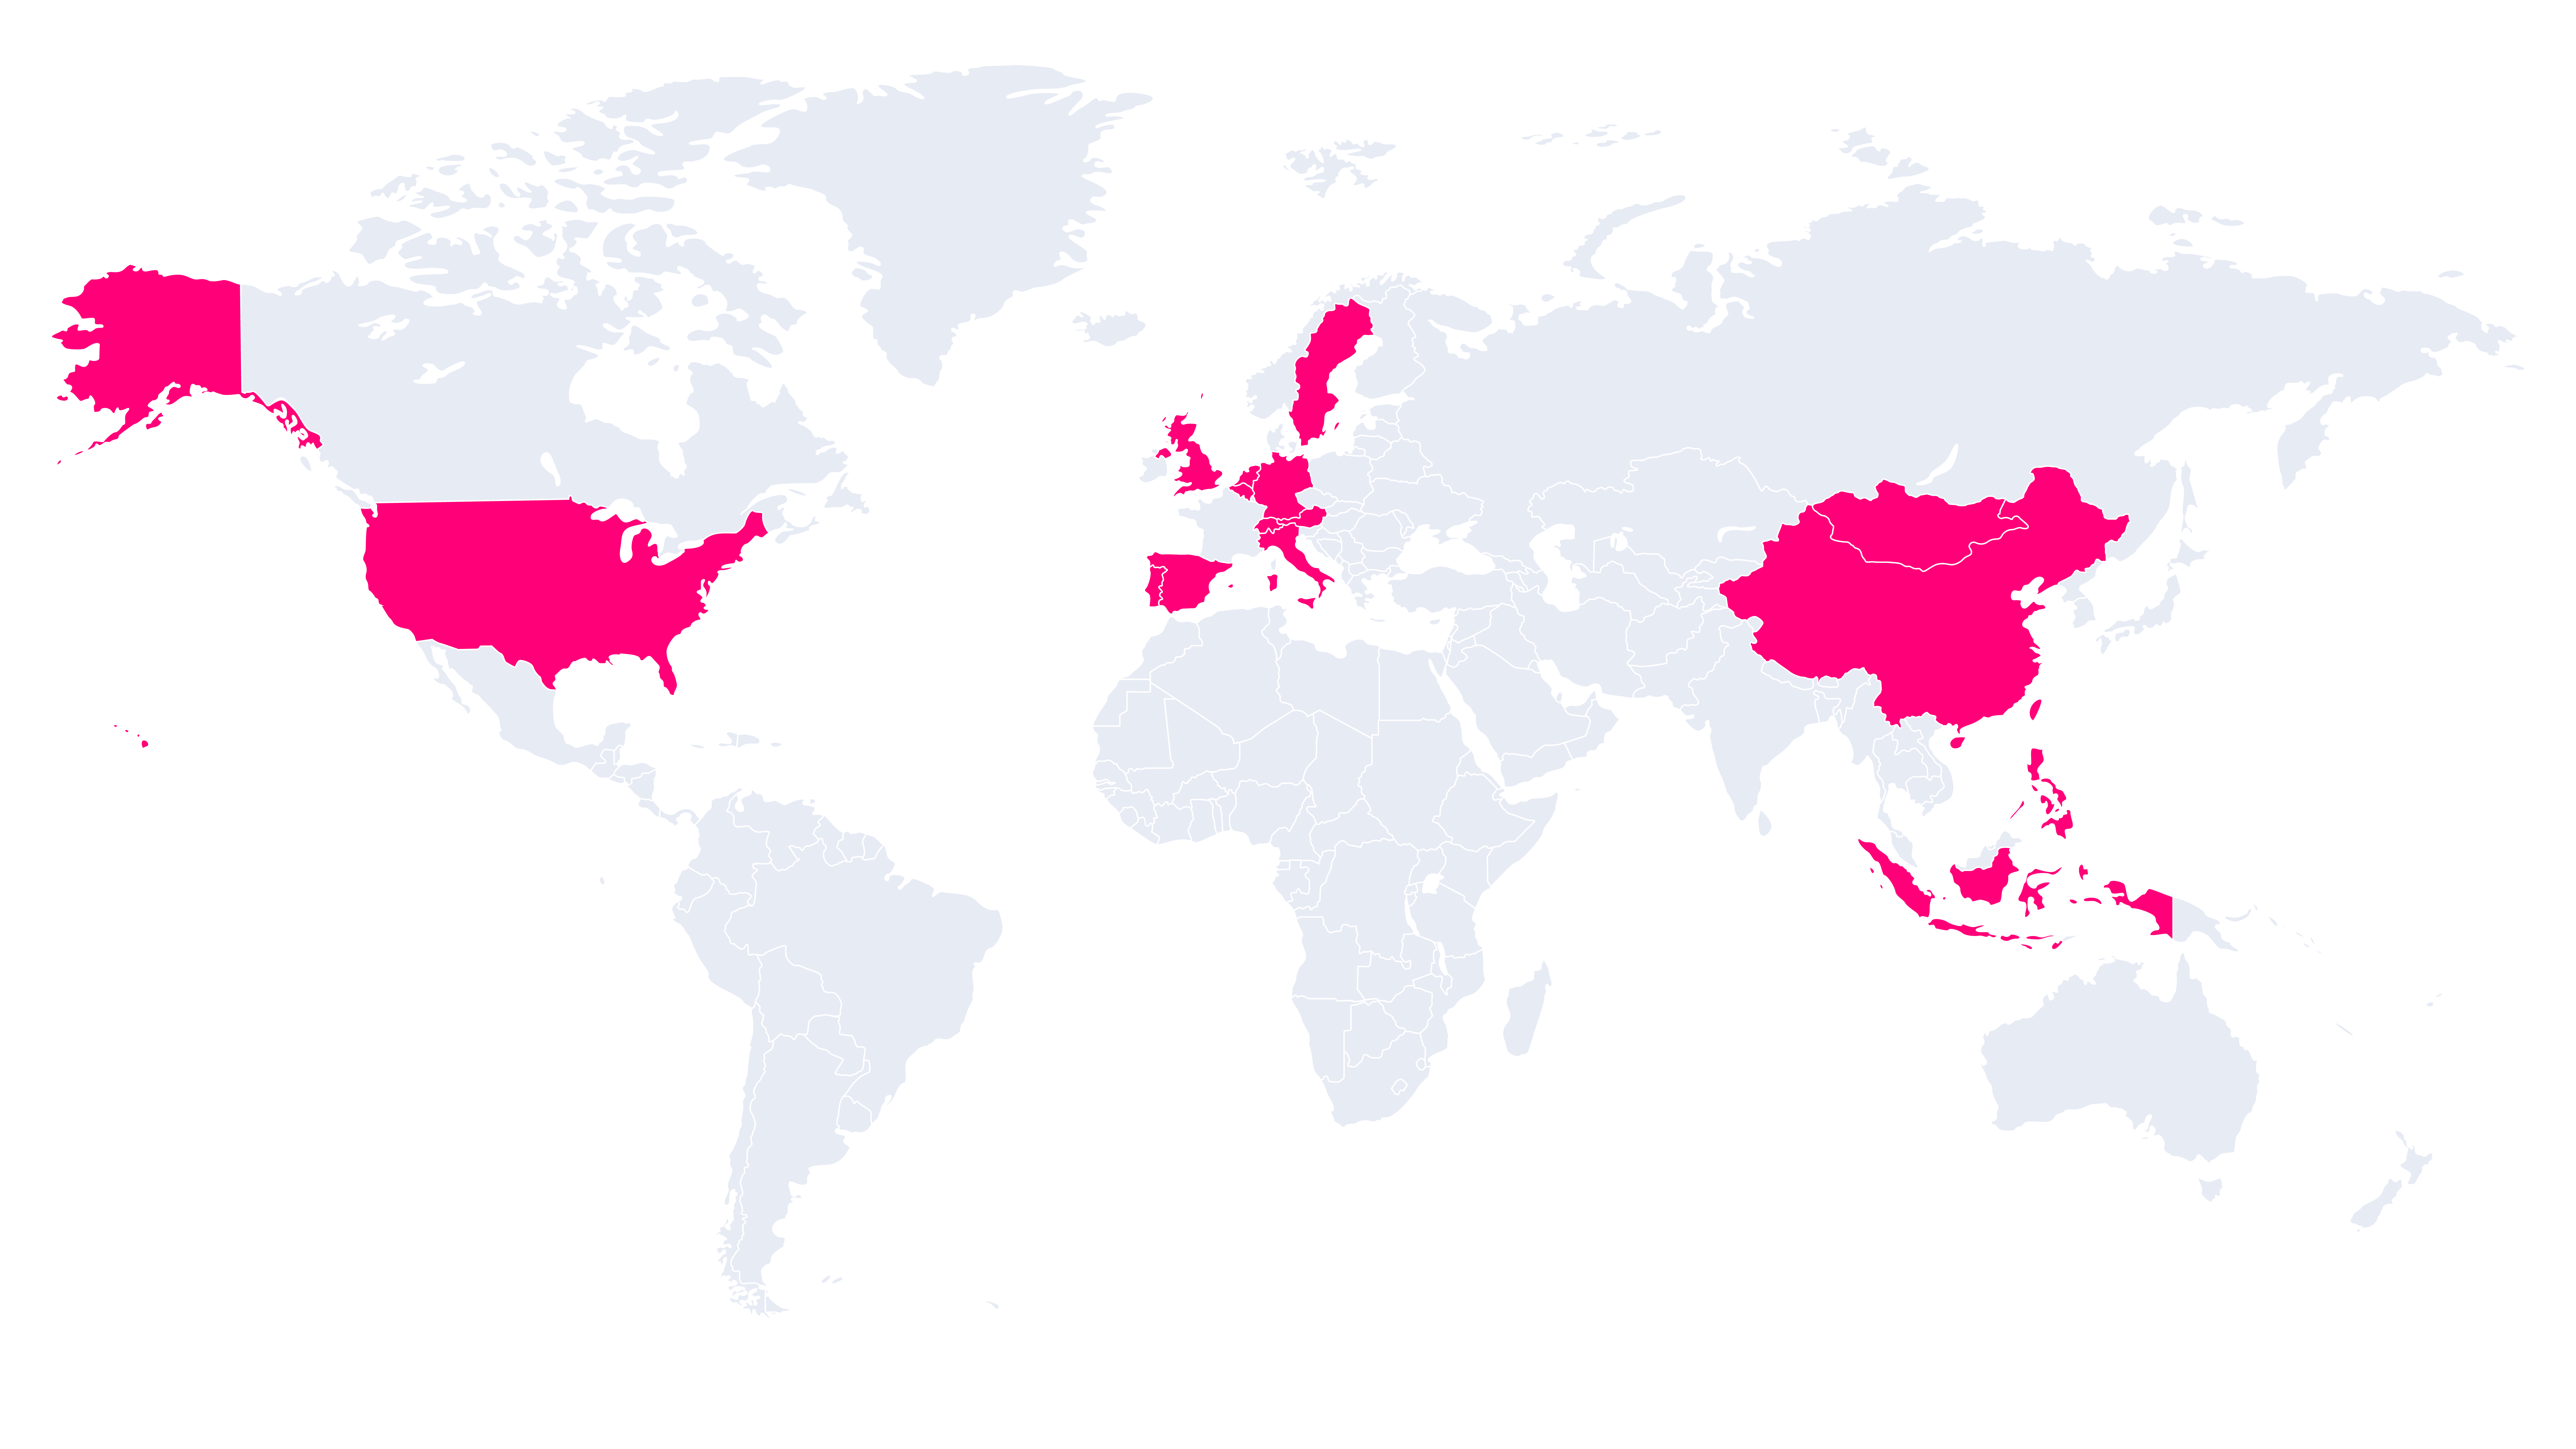
The Apps for Tableau partner network is a trusted and experienced team of consulting and reseller partners, dedicated to serving healthcare professionals worldwide in their native language.
Discover how healthcare-focused solutions can revolutionize the way you handle data, enabling you to make better-informed decisions and achieve remarkable outcomes in the healthcare industry. Locate a trustworthy partner and start optimizing your data-driven journey.
FAQ
Absolutely, our primary deployment method for extensions is on-premises. We prioritize your data security and privacy.
Rest assured, your data is completely secure because we never have access to your data or environment. Our solutions run locally on the computer of the client and will not send any data to Apps for Tableau. We also offer on-premises solutions which do not require any internet connection. For more info visit the Data Security page and download the whitepaper.
Yes, if you need more time to explore more value, feel free to contact us and we will extend your trial period.
If you have a unique use-case, our support team is here to assist you. Simply request a demo via the form on this page, and we will work with you to find a solution tailored to your needs.
Yes, you can access a free trial of an alternative extension via our extension manager.
