An Innovative Approach to Agriculture Data with Intuitive Tableau Extensions
Navigating the intricate landscape of Agricultural World Production data demands a solution that simplifies the way professionals extract insights. Our Agriculture Data Analysis workbook, an innovation in the industry, seamlessly integrates cutting-edge Tableau extensions to empower users in the agricultural sector. Are you ready to explore the future of the agriculture data analysis?
Please refer to the bottom of this page for the data source.

Global Agriculture Production Analysis in Tableau
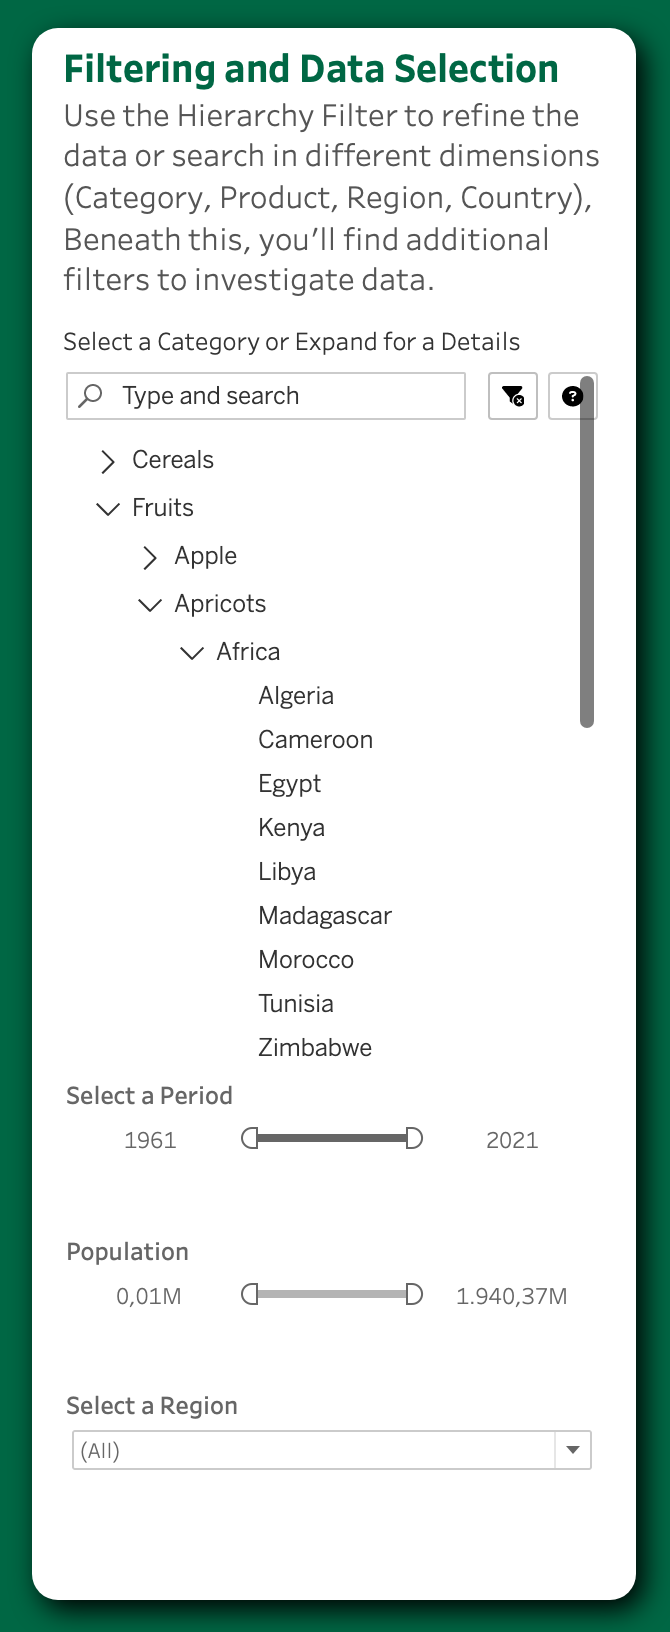
The Power of Hierarchy Filters
The HierarchyFilter Tableau extension is a catalyst for intuitive exploration, consolidating product categories, Products, regions, and countries into a single, dynamic hierarchy. The HierarchyFilter allows users to effortlessly refine data, conduct targeted searches, and gain insights across various dimensions in agriculture data analysis.
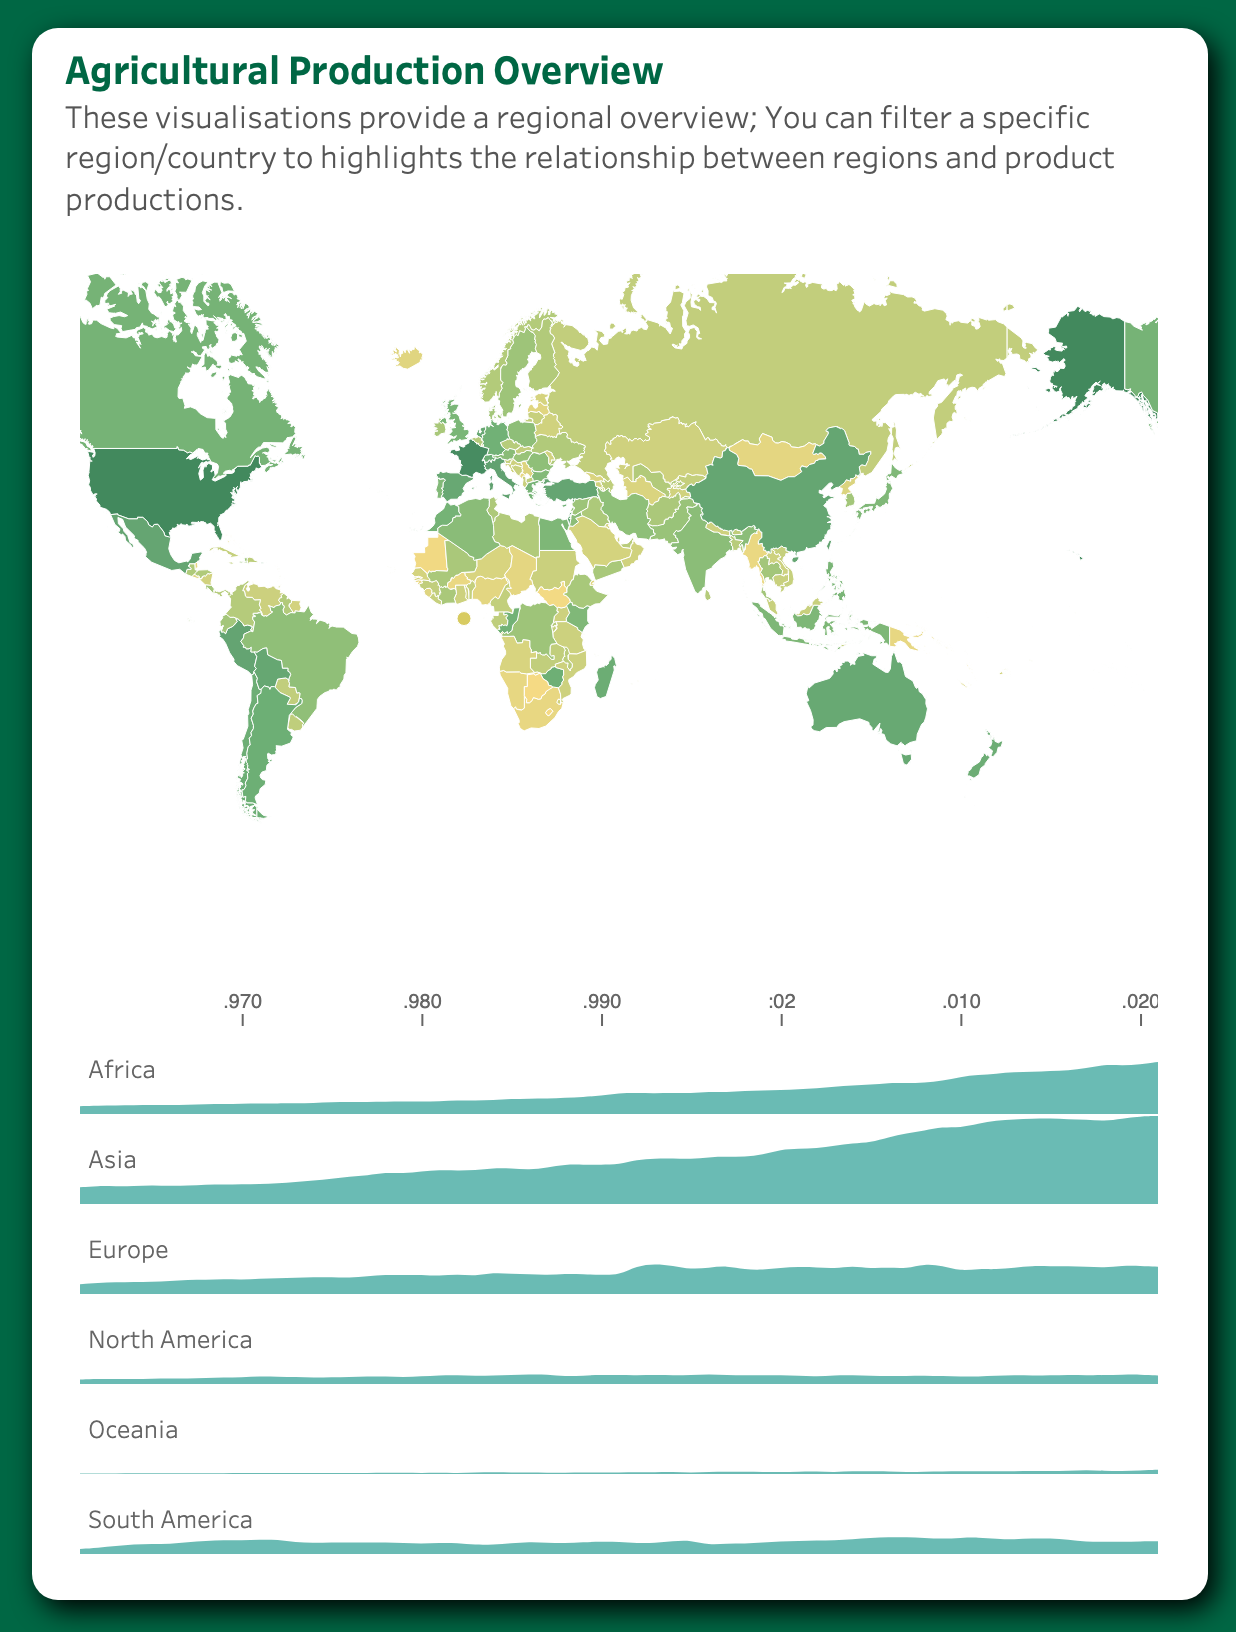
Visualizing Agriculture’s Landscape with ShowMeMore:
Our workbook employs ShowMeMore Tableau extension to present a compelling visual overview. The Horizon chart from ShowMeMore, next to the map offer users more than a snapshot; it provides a deep understanding of regional perspective on agricultural production. This dynamic duo ensures that users can effortlessly select specific regions or countries, analysing the production relationships and market supply across the agricultural landscape.
Real-World Insights and Agriculture’s To-Do List
on the third section you see SuperTables, This dynamic, Excel-like table goes beyond the traditional, allowing users to sort, search, filter, and apply conditional formatting within a flexible grid. Supertables offer multiple views/layouts for in-depth and self-service analysis in agriculture data analysis.

An In-Depth Use-Case Exploration
Optimising Crop Allocation and Yield Analysis
users can utilise the workbook to optimise crop allocation based on historical production data and regional performance. With the power of HierarchyFilter, users are able to filter and refine data by product category, product, region, and countries, providing a comprehensive view of past yields and aiding in informed decision-making.
Market Demand Forecasting
Agribusinesses can leverage the workbook to analyse historical production trends and predict market demand for specific agricultural products. ShowMeMore’s visualizations, such as Horizon charts, enable users to understand production trends at a glance, facilitating strategic planning based on past performance.
Resource Allocation for Sustainable Farming
Agricultural enterprises aiming for sustainability can utilize the workbook to analyze resource usage and land productivity per capita. SuperTables’ dynamic Excel-like capabilities empower users to explore data in detail, allowing for efficient resource allocation decisions by incorporating factors like land usage per capita.
Collaborative Decision-Making
Whether you’re deeply involved in agriculture industry, working with production data, or just curious about the cutting edge data analysis solutions, our workbook is a groundbreaking resource. It’s more than just a collection of charts and tables; it’s a dynamic, user-centric solution that empowers professionals to navigate the complexities of global production data with ease.
Comparative Analysis for Research and Development
Research institutions can conduct comparative analyses of production data to identify trends and areas for innovation and development. The flexibility of Supertables enables users to conduct detailed analyses, fostering research and development by providing insights into the performance of different products and regions.
Data Source Credit
Hannah Ritchie, Pablo Rosado and Max Roser (2023) – “Agricultural Production” Published online at OurWorldinData.org.
Retrieved from: ‘https://ourworldindata.org/agricultural-production‘ [Online Resource]
Start your Journey
Ready to transform your data journey? Dive into our Agriculture Production Analysis Dashboard today and unlock the potential for data-driven decision-making. Optimise your crop allocation, Forecast the market demand, and make data-driven decisions with powerful extensions in Tableau.