Navigating Workforce Dynamics with Our Innovative Tableau Solution
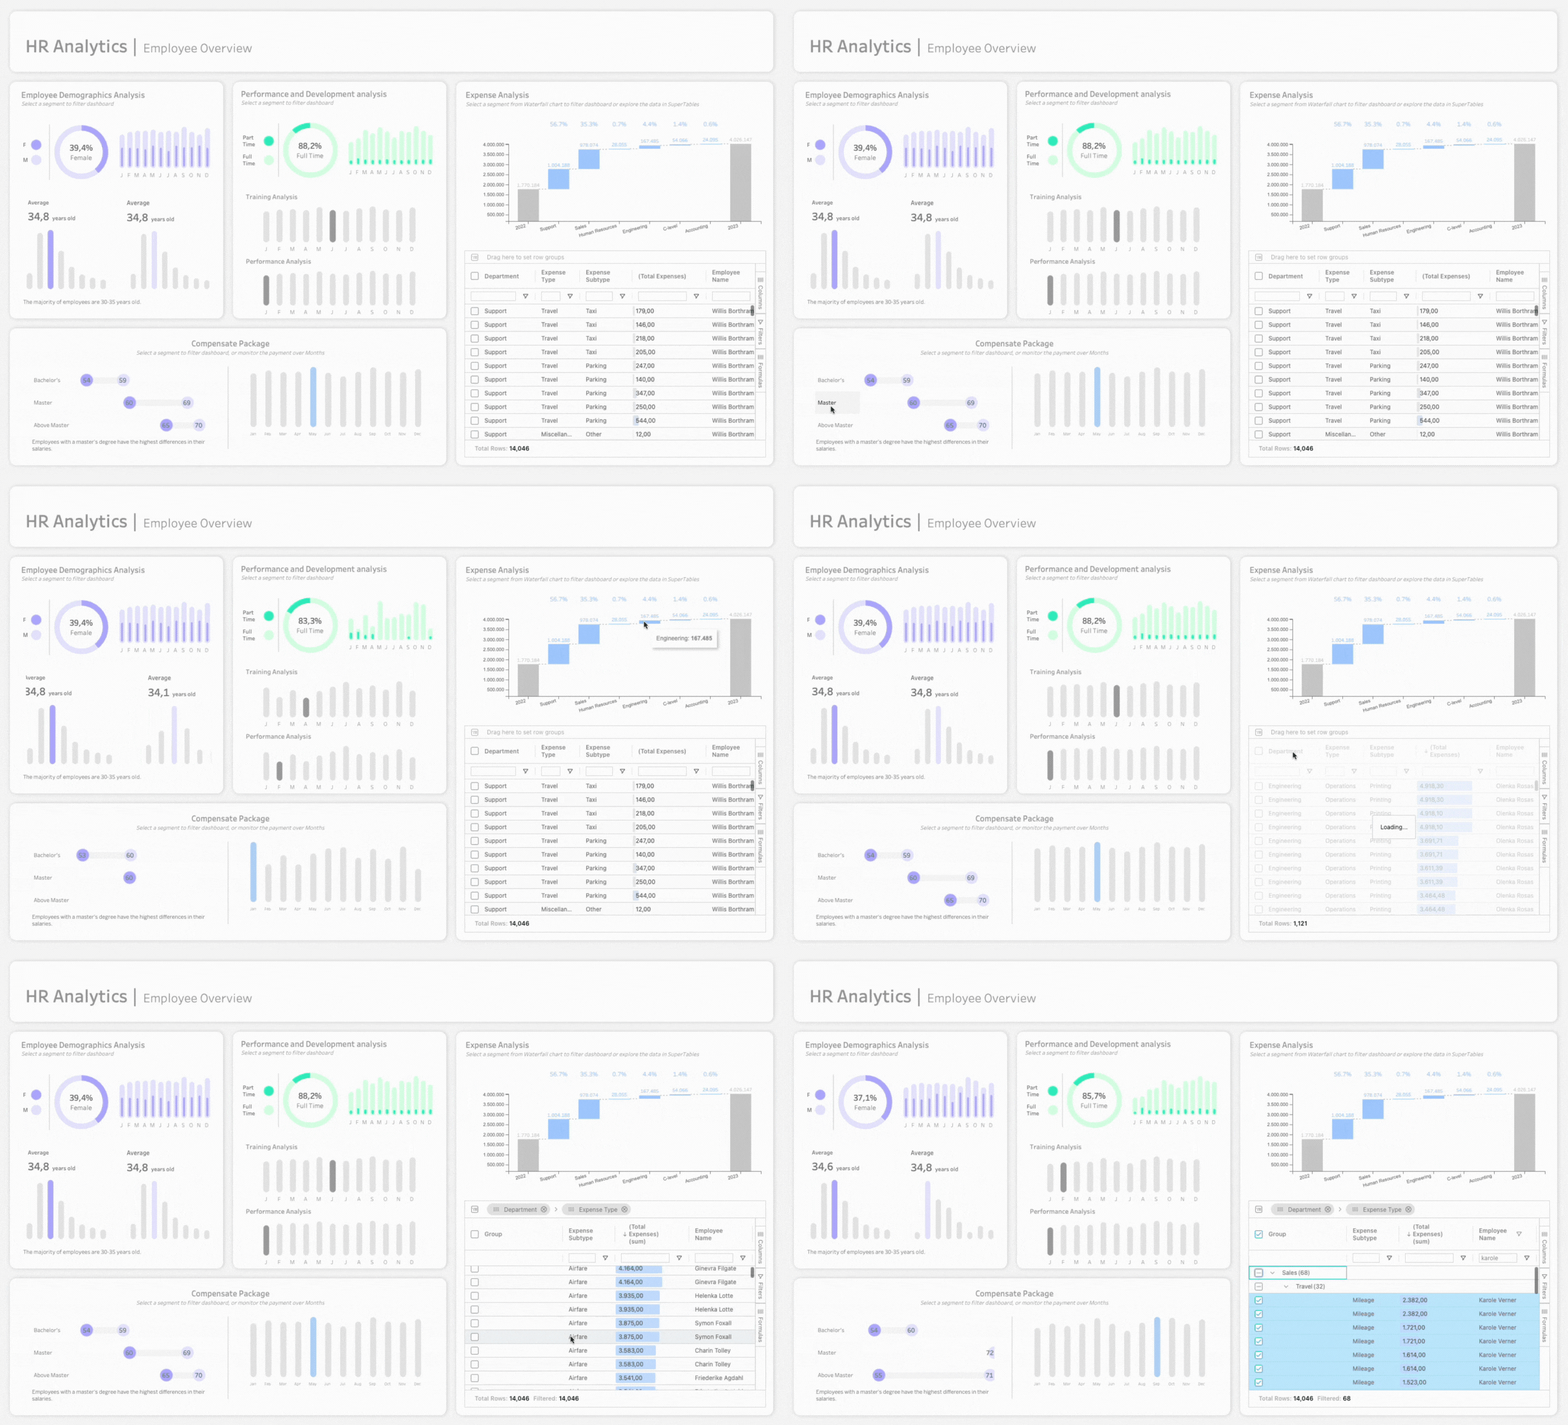
We are excited to introduce our latest Tableau workbook, a comprehensive solution designed to transform your HR analytics experience. This workbook seamlessly integrates powerful extensions that empower you with game-changing functionalities, flexibility and insights.

HR Analytics – Employee Overview
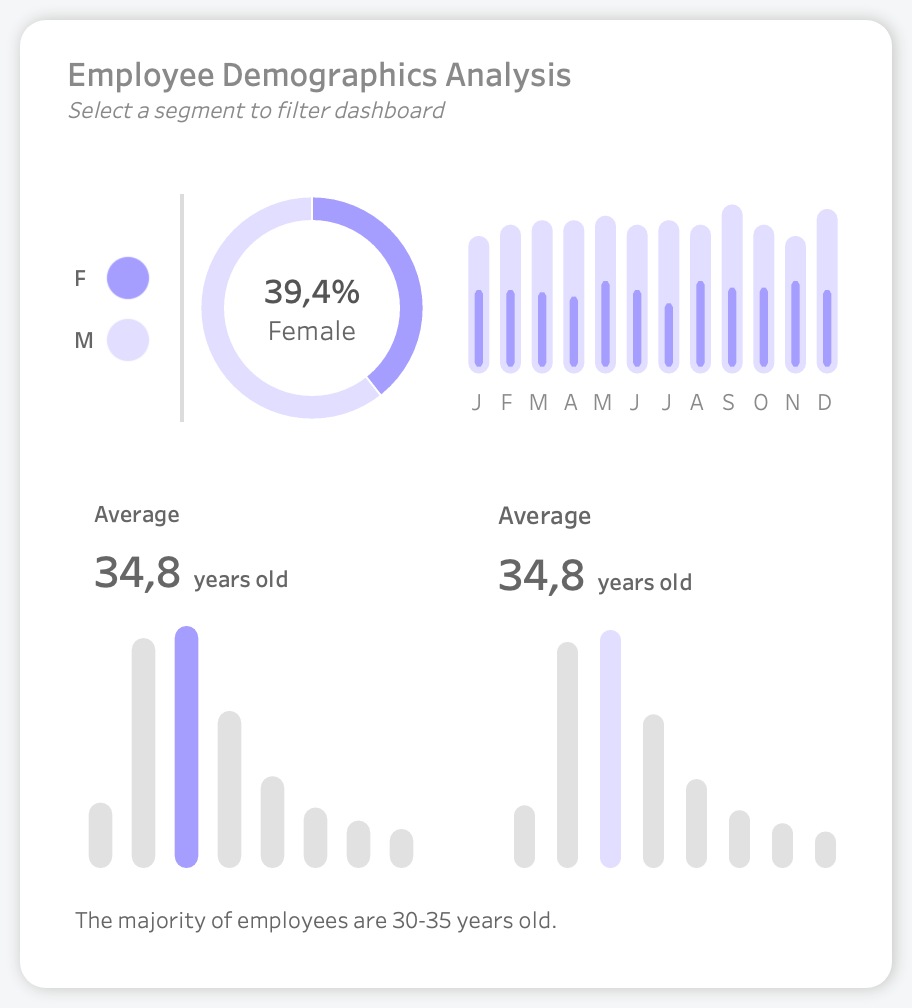
Employee Demographics Analysis
Discover the trends shaping your workforce with our Employee Demographics Analysis section.
A visually stunning monthly bar chart displays the gender distribution over time, complemented by two additional charts that considers age groups for each gender. Gain a deeper understanding of your workforce composition and identify potential areas for diversity and inclusion initiatives.


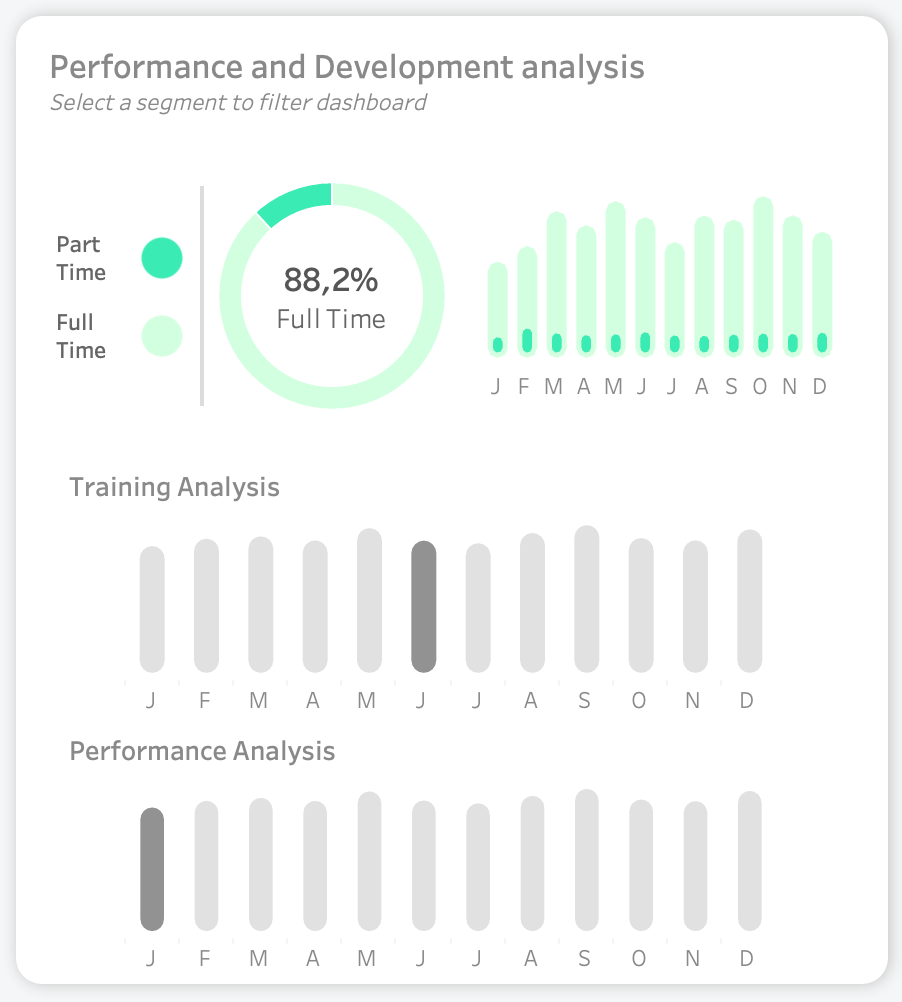
Visualising Employee Performance and Development
Navigate through the intricacies of employee performance and development with three bar charts highlighting contract status, training initiatives, and performance metrics.
Key indicators are intelligently presented, with minimum benchmarks highlighted for quick reference. Empower your HR team to make informed decisions on talent development and retention strategies.
Compensation Package Insights
Analyse the heart of your organization’s financial health with our Compensation Package Insights. A monthly bar chart that showcases total pay checks, emphasizing peak values, while a dynamic Gantt chart breaks down the gender pay gap based on educational degrees. Gain a comprehensive view of your compensation strategy and identify opportunities for optimization.

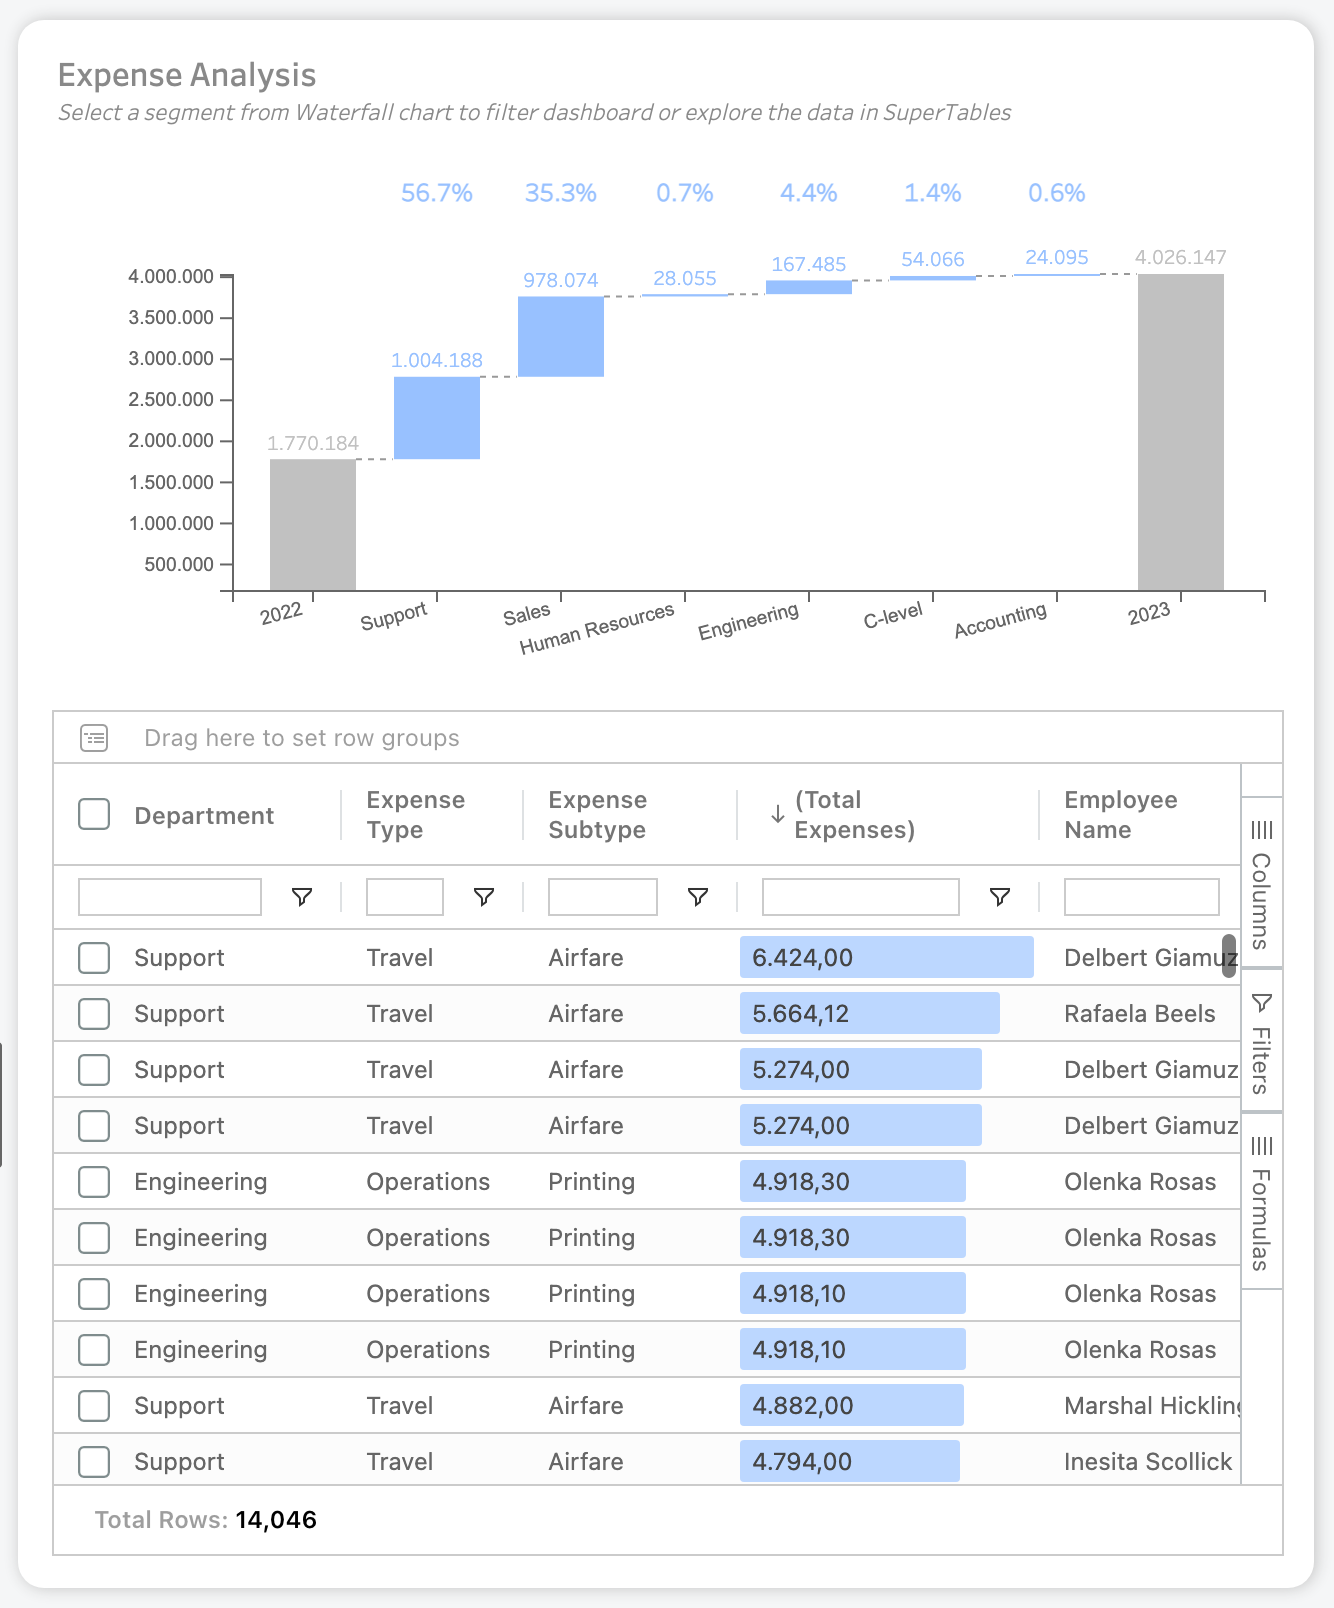
Expense Analysis with SuperTables
Elevate your expense analysis game with our revolutionary SuperTables extension. At the forefront is a waterfall chart from the ShowMeMore extension, offering a bird’s-eye view of departmental contributions to overall expenses in the past year. Below this, the SuperTables extension takes centre stage, providing dynamic, Excel-like tables for in-depth analysis.
In the active field of HR analytics, our latest Tableau Power Workbook is your key to unlocking actionable insights and streamlining decision-making. This integrated solution, packed with extensions, offers flexibility and depth, transforming the way you approach human resource management.

An In-Depth Use-Case Exploration
Enhancing Diversity Visibility
Identify gender distribution trends and analyse age demographics, empowering HR professionals to foster diversity and inclusion initiatives with strategic insights.
Streamlining Talent Management
Navigate contract statuses, training, and performance metrics effortlessly with intuitive bar charts. Empower HR teams to make informed decisions on talent development and retention strategies.
Cultivating Financial Clarity
Gain financial insights with a focus on total paychecks and dynamic Gantt charts highlighting the gender pay gap based on educational degrees. Optimise your compensation strategy for maximum impact.
Expanding Expense Visibility
Address this challenge with the ShowMeMore extension’s waterfall chart. Understand departmental contributions to expenses for strategic decision-making.
Streamlining Data Analysis Efforts
SuperTables—a game-changer in self-service analytics. Allow users to personalize views, create customized tables, and significantly reduce the time spent on data analysis, leading to more efficient HR processes.
Start your Journey
Ready to transform your data journey?
Get started with our HR Analysis Dashboard today and unlock the potential for data-driven decision-making. Elevate your strategies, empower your workforce, and chart the course for a data-driven future with powerful extensions in Tableau.