Monitoring Business Activity in Europe
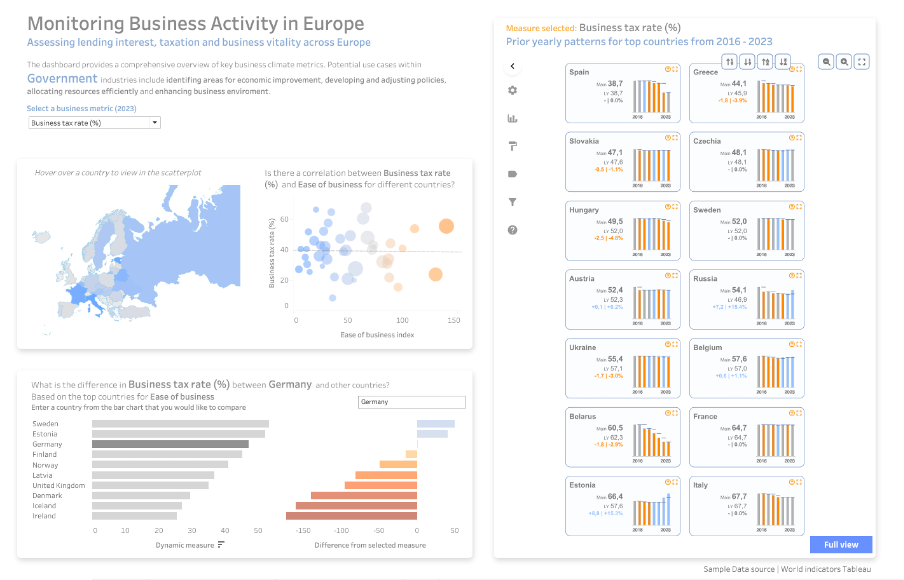
The Business activity dashboard provides a comprehensive overview of key business climate metrics such as business tax rate, ease of business, and lending interest per country.


Get even more insights
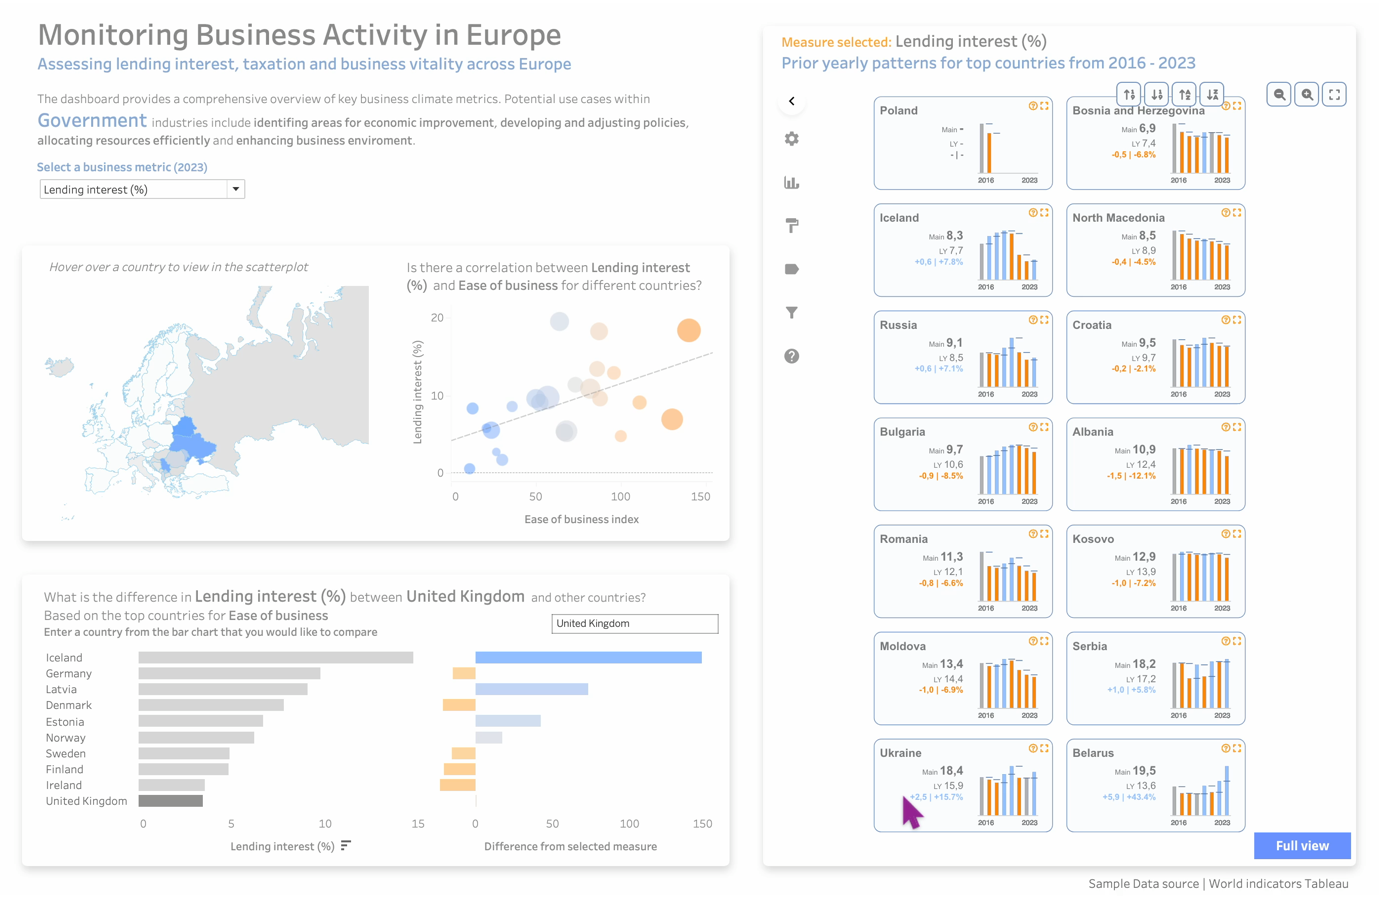
• Select a business metric to adjust the measure across the whole dashboard, including the KPI’s.
• View the distribution of the measure in the map, you can hover to view the correlation between the selected business metric and the ease of business across countries in Europe.
• Select a country to zoom into the corresponding PowerKPIs tile.

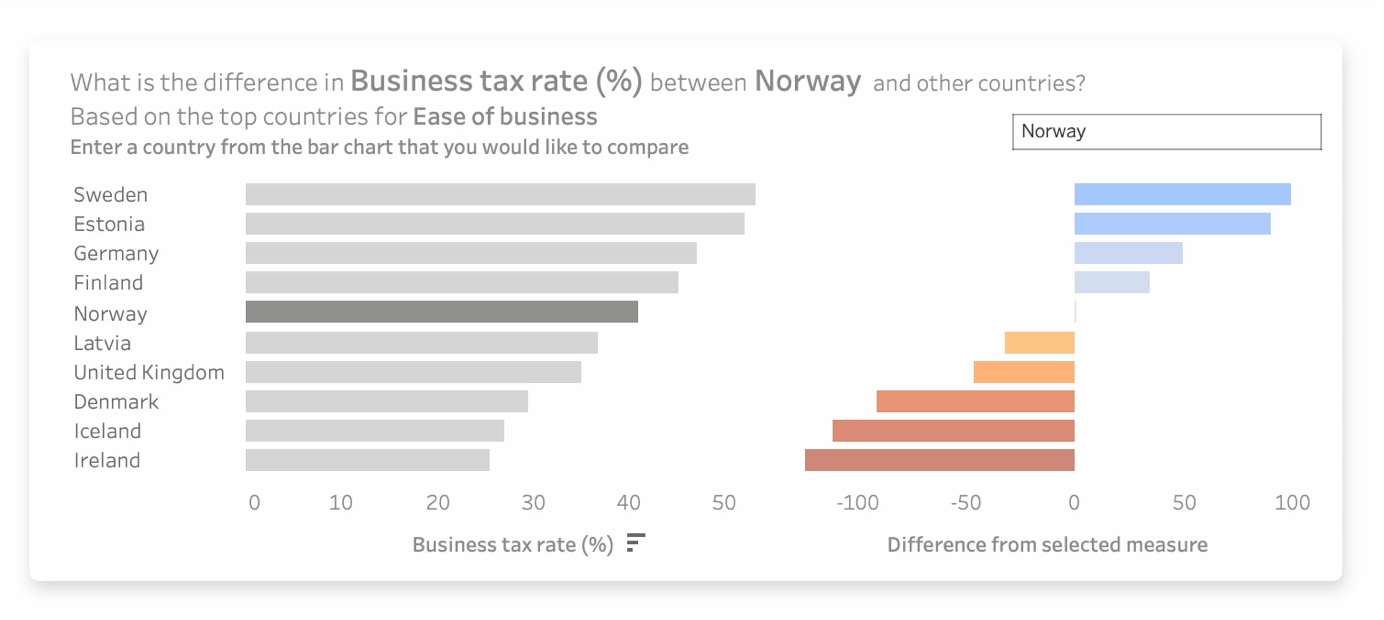
• Based on the top 10 countries for ease of business, measure the difference for a selected country by using the parameter.
Extensions Used in Dashboard:

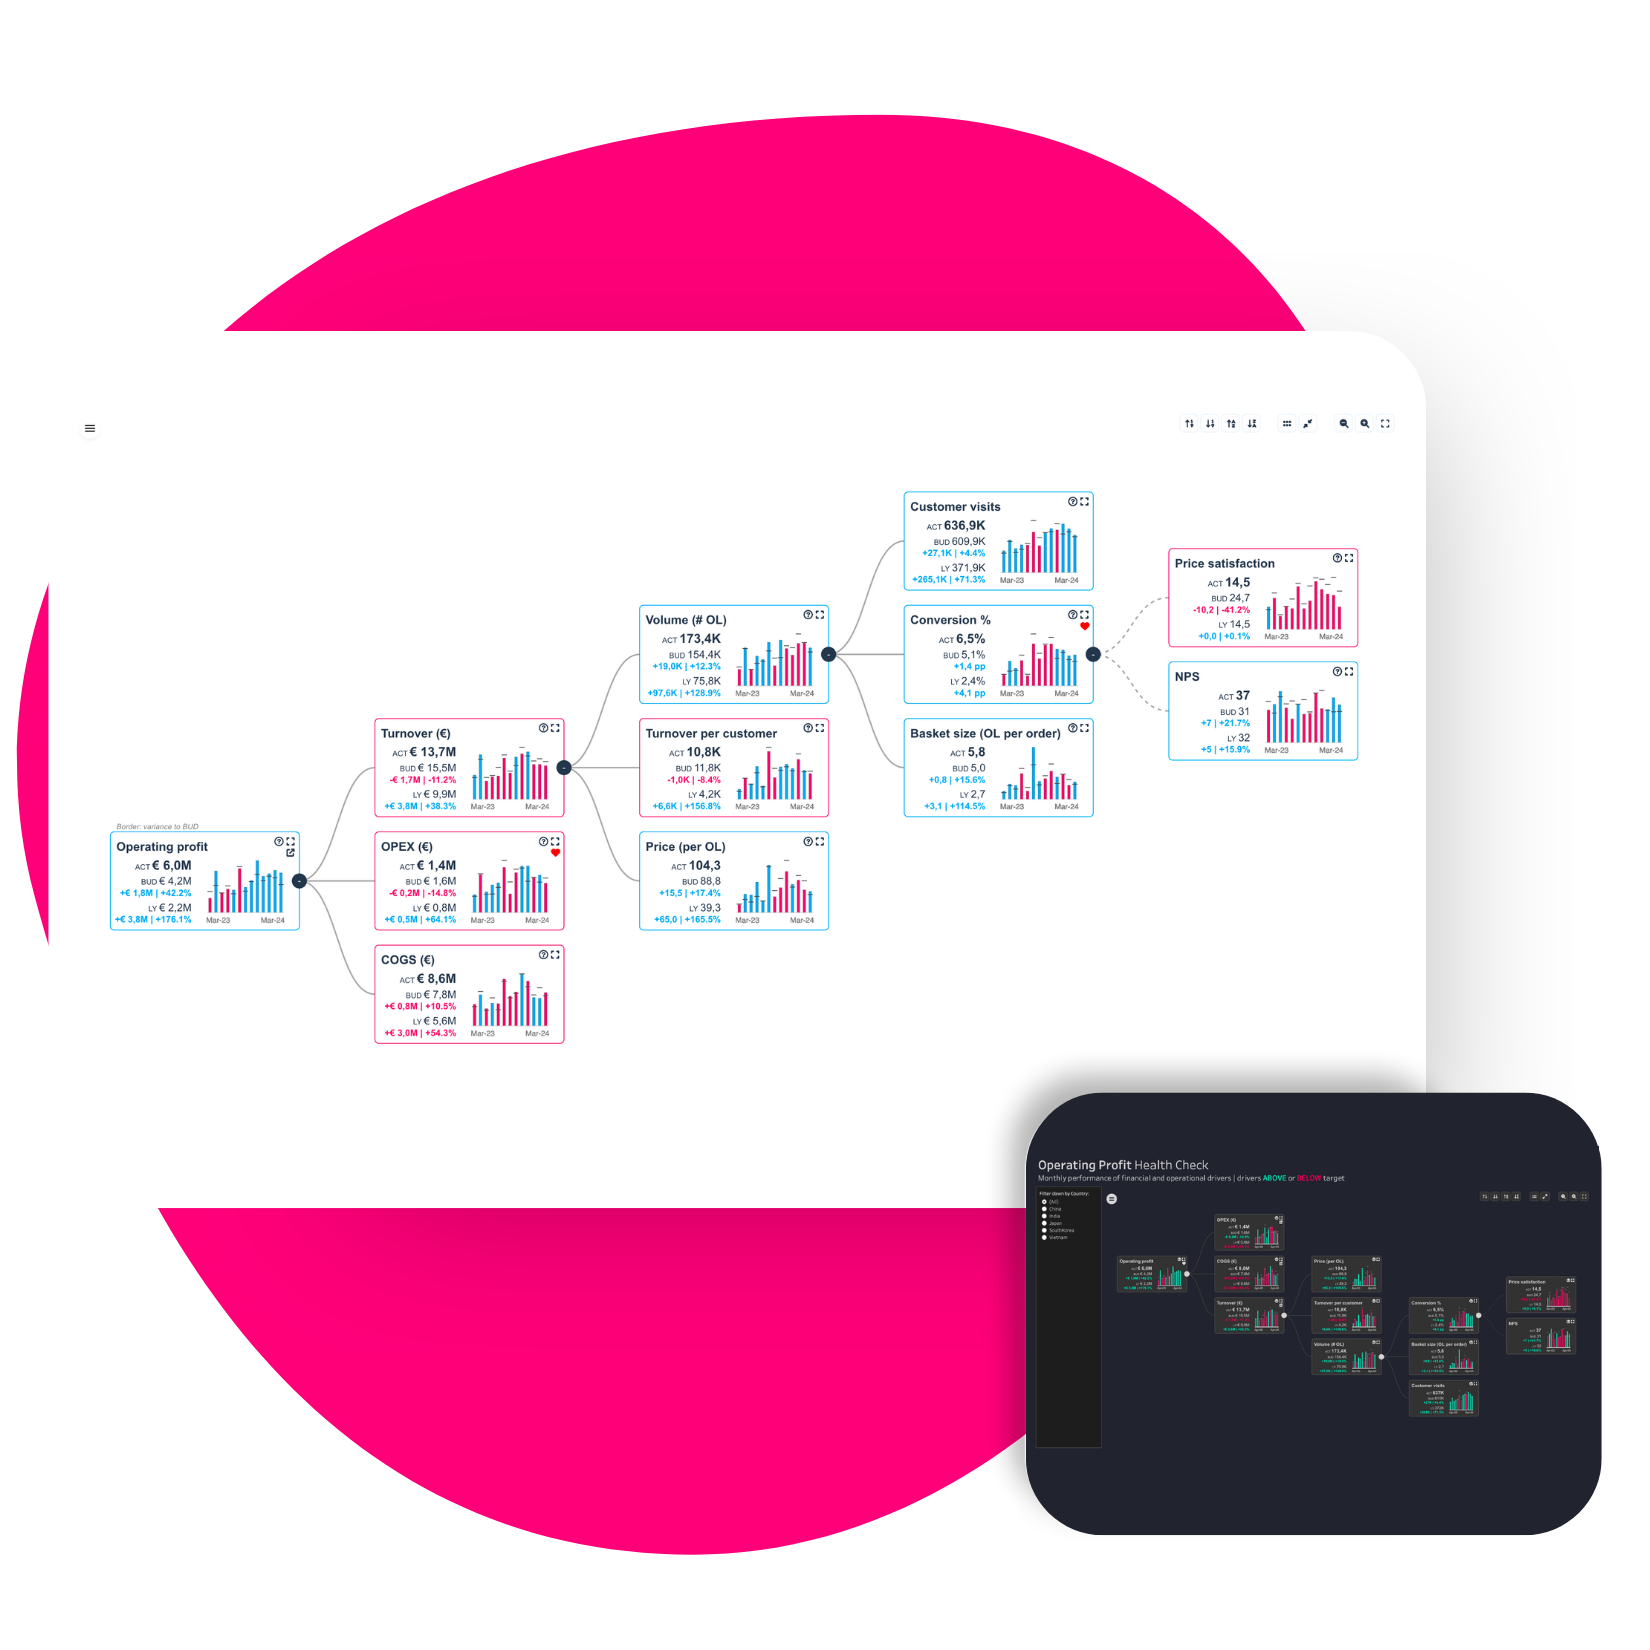
PowerKPIs – Analyze and track measures
By using PowerKPIs you can focus on showing your KPI’s and let the formatting be done with the click of a few buttons:
This powerful Extension gives yearly patterns and comparison metrics for top countries from 2016 – 2023. It allows you to observe patterns and changes over time in one view and enables you to have a clear and concise summary of key performance indicators. This PowerKPIs setup was configured to change depending on the measure selected from the business metric parameter. You can also select the full view option to zoom into the tiles.
