
Save Time and Get Easy Insights in Flexible, Self-service Tableau Dashboards
As part of our initiative, Extensions for Good, we gifted our range of premium Tableau Extensions to Feeding America to support their internal organizational activities. Feeding America is a US charity organization that supports a network of food bank partners across the United States. The organization offers Tableau resources and support to its network of food bank partners. The Data Analytics team needed to provide self-service access to a dashboard with a wealth of data, which users explore in unique ways. The team needed a flexible product that allowed self-service and customization and was still implemented in a controlled environment. SuperTables was the best solution for that!

Feeding America
Feeding America is the largest hunger-relief organization in the United States. They are a nationwide network of food banks, food pantries, and community-based organizations in the United States. They work to end hunger by providing food and support to millions of people.
In a country that wastes billions of pounds of food each year, it’s almost shocking that anyone in America goes hungry. Yet every day, millions of our neighbors don’t get the food they need to live healthy lives. We work to get nourishing food – from farmers, manufacturers, and retailers – to our neighbors while addressing the root causes of hunger.
Use Case
Feeding America needed a flexible Tableau dashboard that offers self-service to the users to explore the data of their interest and answer their specific questions. However, there was no way to define the particular dashboard requirements so explicitly that they could set up several dashboards with the correct data and structure it for all potential end-users. The team required something much more flexible but still in a controlled environment for people who were not very savvy with other technologies. They were looking for a solution, and that’s when they discovered the SuperTables extension.
Benefits of SuperTables
SuperTables offered the flexibility end-users needed while still providing a controlled environment for the data under Tableau’s governance. SuperTables allowed the dashboard designers to create only one dashboard with all the rich data and let the end-users customize their personal views. In this way, they ensured that people get to see only the data relevant to them and can pivot it and customize it in the way that best serves their needs. Furthermore, the dashboard designers still had control over who sees what and what calculations can be made, which ensured the numbers are always correct and the data was securely used.
SuperTables allowed Feeding America to provide self-service access to data in a way that catered to the unique needs of each end-user without having to create 30 different dashboards. SuperTables has become a fundamental part of Feeding America’s data solutions.

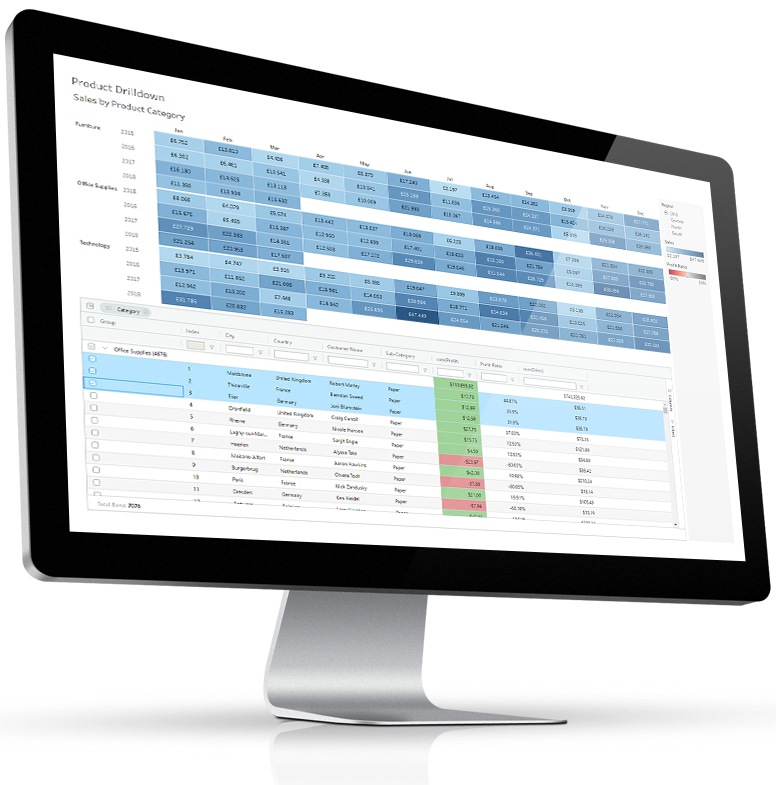
*Example dashboard of SuperTables
“SuperTables really helps us to do something unique. It gives our end-users the self-service capability through flexibility in the dashboard. And it allows us to still control the environment and protect the data.”
– Stephanie Zidek, Director of Data & Analytics at Feeding America

Results Achieved
Regarding dashboard design, SuperTables saves much time in development. Designers no longer have to respond to countless emails asking for a specifically-looking dashboard. Instead, they can point the users to the big dashboard with SuperTables, where they can view the data in the way they need it.
Next to saving time, the most significant value Feeding America discovered in SuperTables is its flexibility. The flexibility of creating one dashboard that satisfies all end-users needs, customizing the views for the specific food bank partners and collaborating better with the network. Making the data self-service has been a huge game-changer for Feeding America, and they are excited to implement the extension in more dashboards.
Curious to experience it yourself? Request your free trial now!