Inspiring the Next Generation of Data Talent at The Information Lab’s Data School.
Last week at The Information Lab’s Data School London, students had the unique opportunity to learn from Vincent Cruickshank, UK Country Manager for Apps for Tableau, who was there in person, and Klaus Schulte, Tableau Visionary Hall of Famer, who joined online. During project week, they explored Tableau Extensions like SuperTables, WriteBackExtreme, and PowerKPIs. These powerful data visualization tools turn static dashboards into interactive, hands-on experiences, giving students real-world skills they can apply immediately.
Day One: Exploring Tableau Extensions
The week kicked off with an introduction to each Extension and real-world examples. Students learned how:
- SuperTables enables Excel-style interactivity inside Tableau.
- WriteBackExtreme allows direct input, collaboration, and scenario planning within dashboards.
- PowerKPIs creates customizable KPI views to tell compelling data stories.
Students then paired up, each duo picking one extension and a use case to develop. The goal was simple: learn by doing and see how interactive dashboards can solve real business challenges.
Learning by Doing
Throughout the week, Klaus Schulte and I supported the students, answering questions and providing feedback. It was inspiring to see how quickly they picked up the tools and started shaping their own dashboard ideas:
- The SuperTables team built a flexible, spreadsheet-style tool inside Tableau.
- The WriteBackExtreme team transformed dashboards into collaborative spaces with direct input and updates.
- The PowerKPIs team created interactive KPI views that made data insights engaging and easy to follow.
Showcasing Results
By Friday, each group presented their dashboards. Every project highlighted how Tableau Extensions bring interactivity and new value to data visualization.
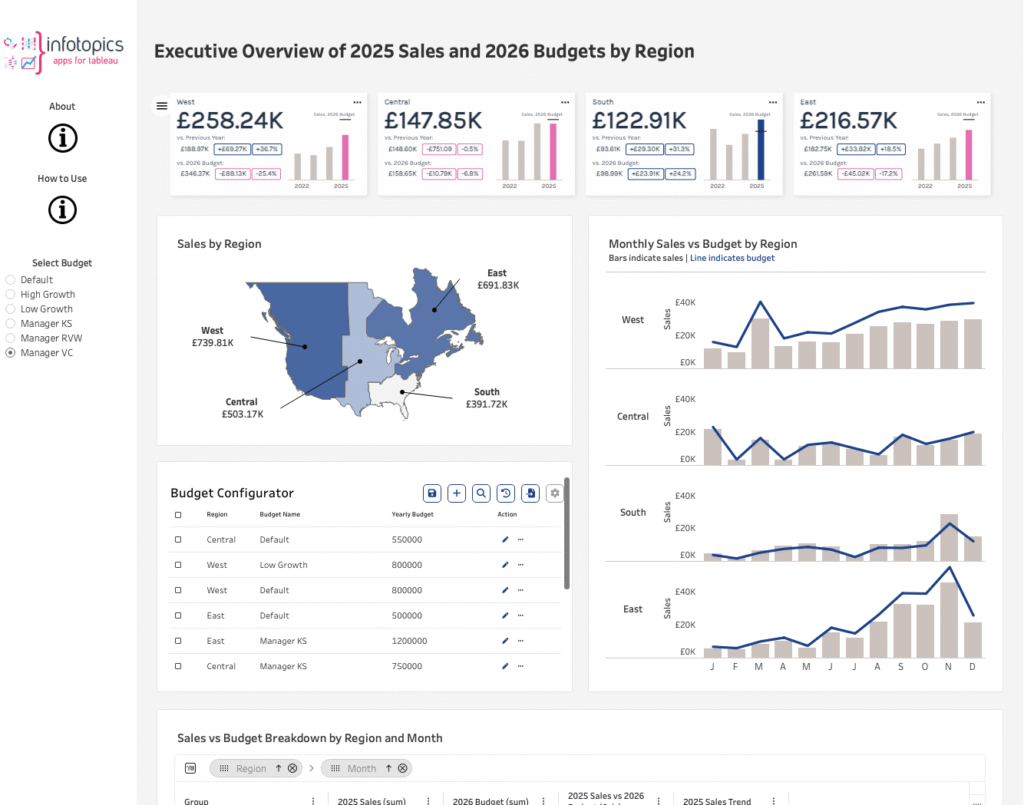
SuperTables in Action

Flexible data exploration with spreadsheet-style functionality, built directly in Tableau.
WriteBackExtreme in Action
A collaborative dashboard where users can input and update data seamlessly.
PowerKPIs in Action

Sleek, customizable KPI dashboards that tell clear and compelling stories.
Looking Ahead
We’re incredibly proud of the creativity, teamwork, and effort the students demonstrated. Guiding them through the projects was a true pleasure, and we’re excited to see how they use these Tableau skills in their future careers.
A big thank you to The Information Lab’s Data School for having us—we’re already looking forward to the next project week!

Collaborating with More Data Schools
It was a pleasure working with The Information Lab’s Data School, and we’re excited about the possibility of collaborating with other data schools and training programs. If your organization is interested in exploring Tableau Extensions and providing hands-on, interactive learning experiences for students, get in touch to see how we can work together.