Extensions for Tableau – Integrate and Interact with webapps
 As of Tableau 2018.2 the world meets the Tableau Extensions API. This new API allows us to directly integrate web applications into our dashboards by dragging them from the objetcts pane to your Dashboard using Tableau Desktop Creator. With Extensions for Tableau one can interact with datasources and add new visualization types to your dashboards while still maintaining high rates of interactivity.
Use cases we think might interest you
Some of the advantages of Tableau Extensions
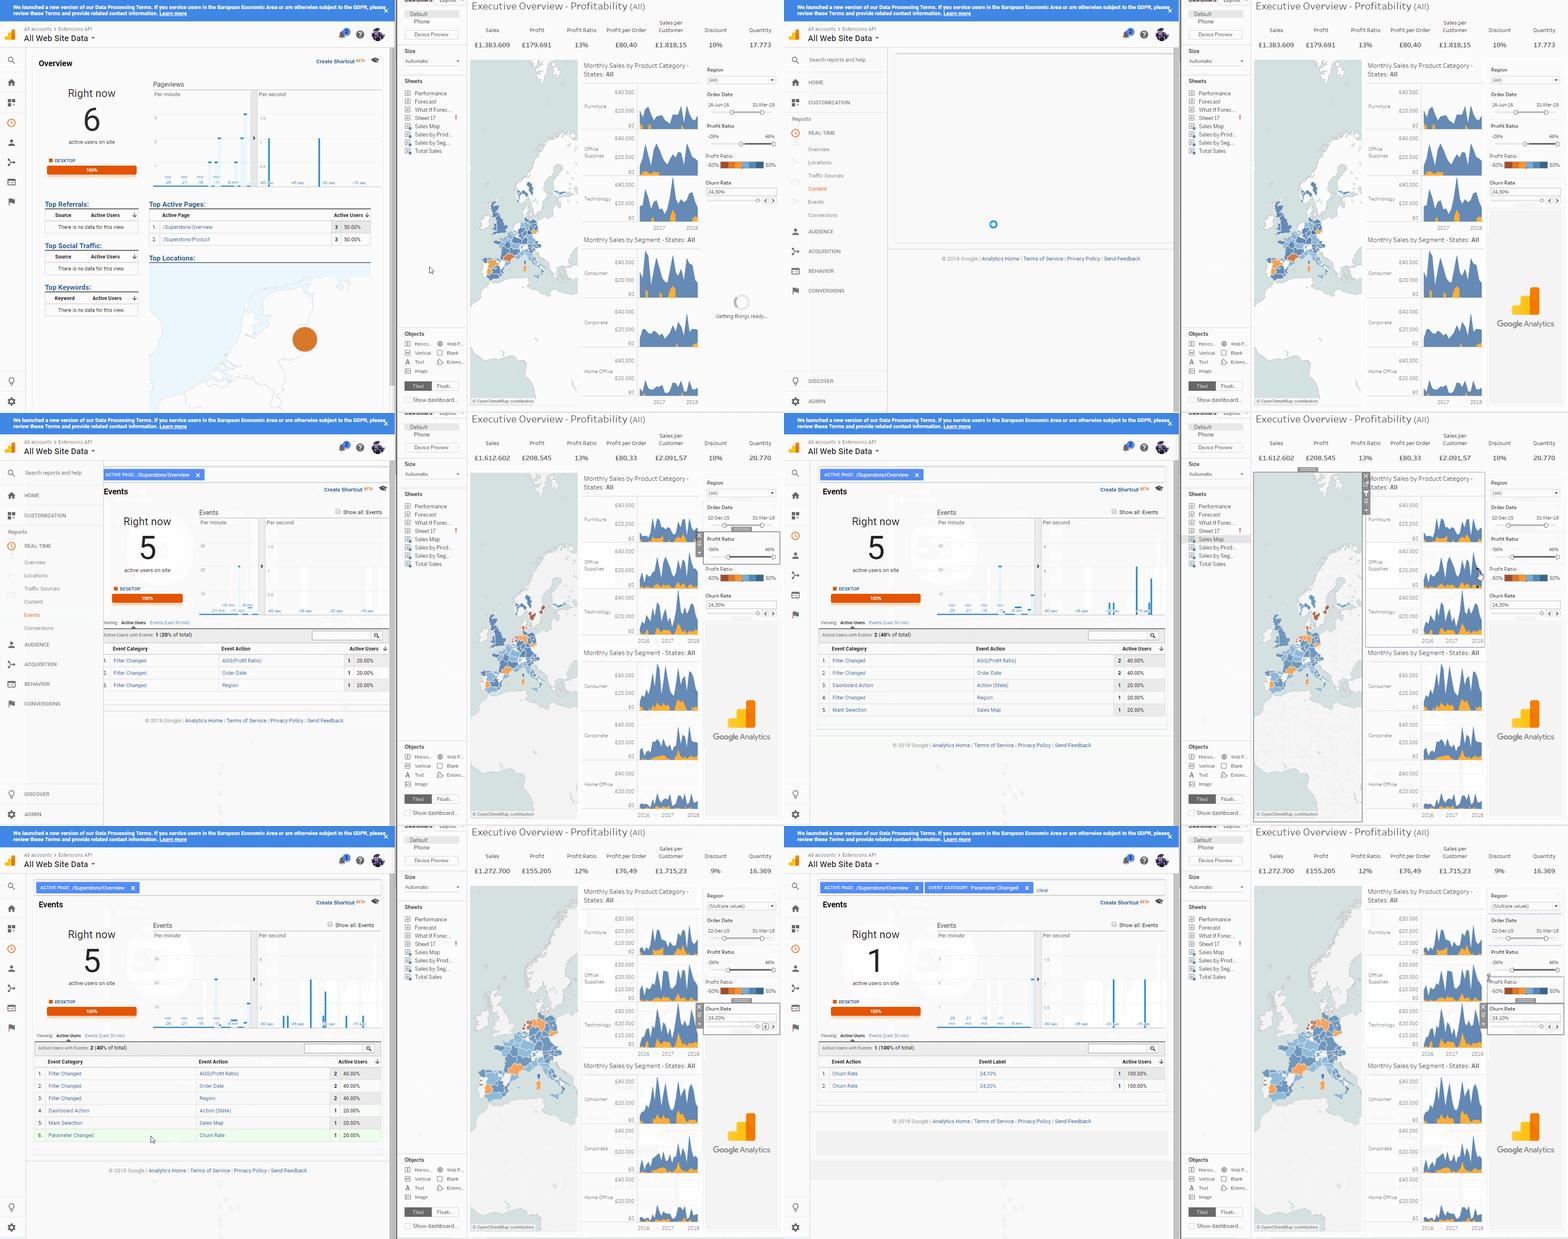
Dashboard Usage Monitor
To continiously improve one has to learn. Learn about the usage of your dashboards and gain knowledge on how people use your dashboards. This knowledge enables you to evolve your dashboards to highly useable information products.
The Dashboard Usage extension uses Google Analytics technology to monitor all traffic and content that is viewed, clicked or filterd by your dashboard visitors.


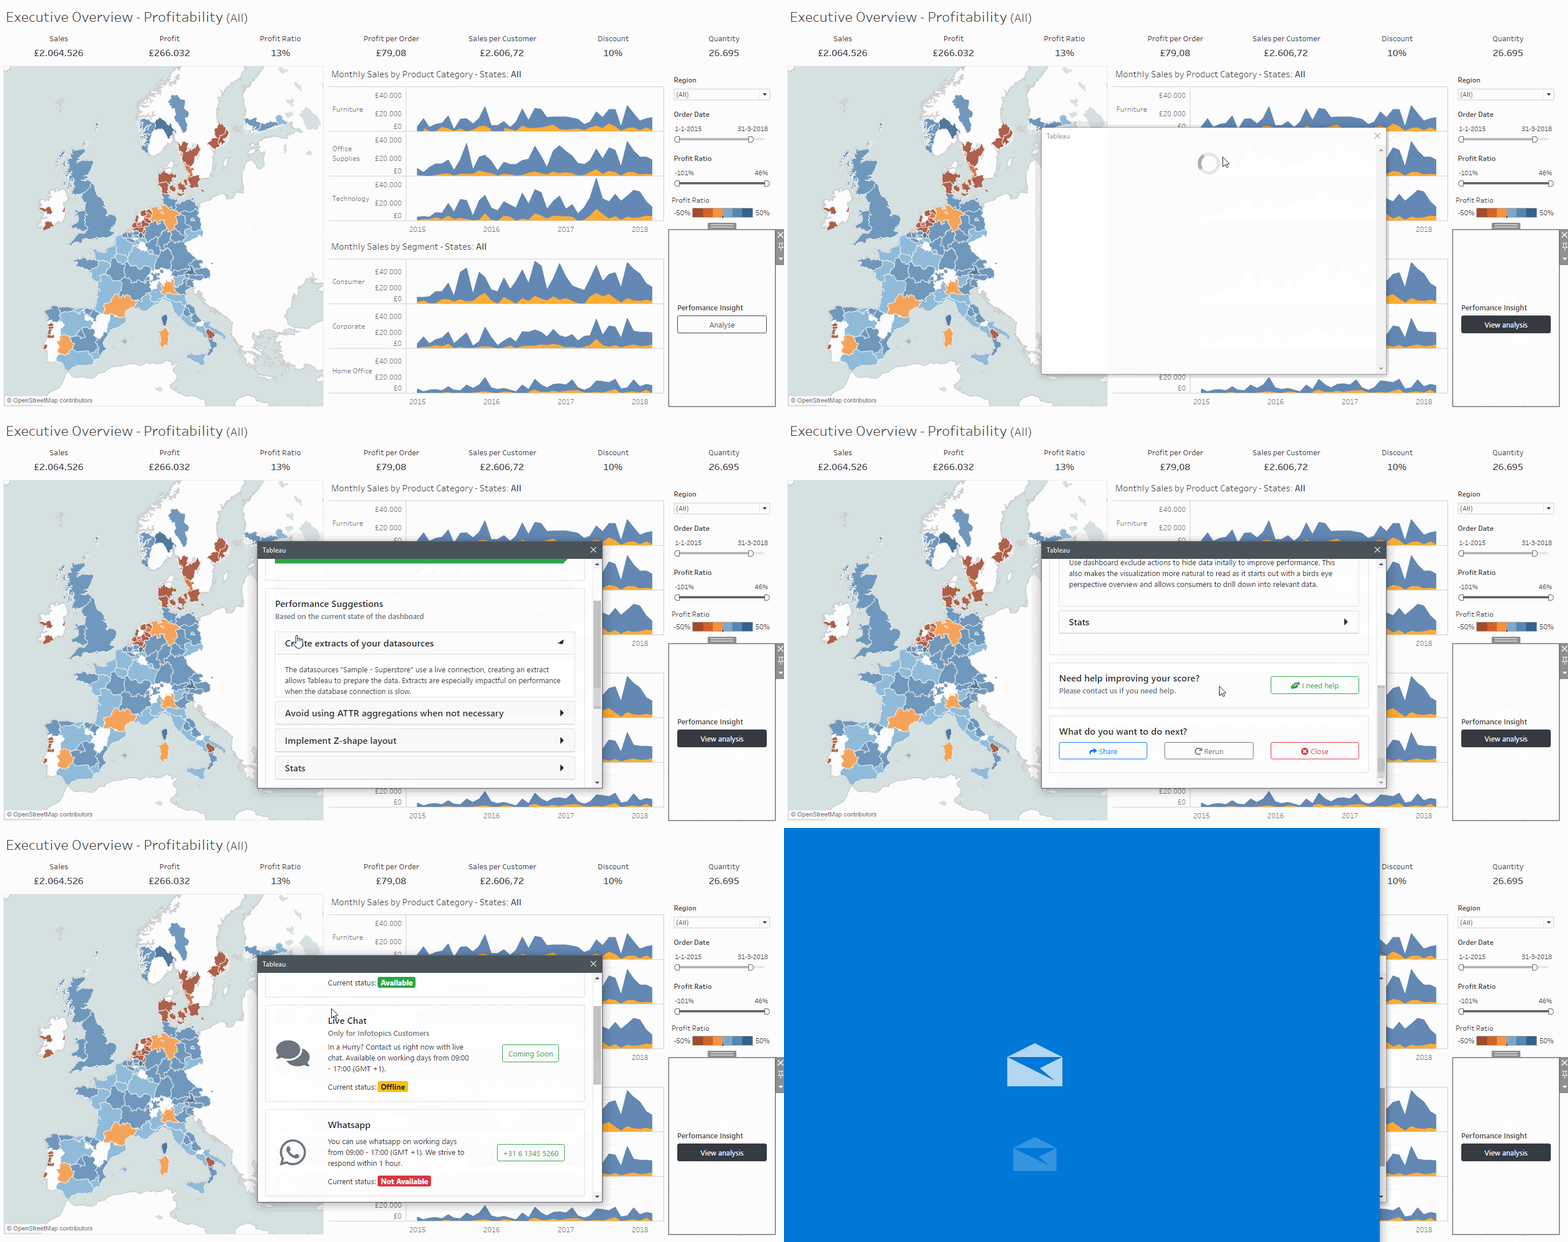
Performance Insight
This free Tableau Extension tells you the performance characteristics of the dashboard you build. Where Tableau’s Performance Recorder only measures Query performance and points you in the direction of ‘heavy queries’, this Extension will help you determine why performance might not be as expected.
Receive free but valuable tips and advice on how to improve your dashboard performance. The help of an expert is allways just one click away….
Show me More
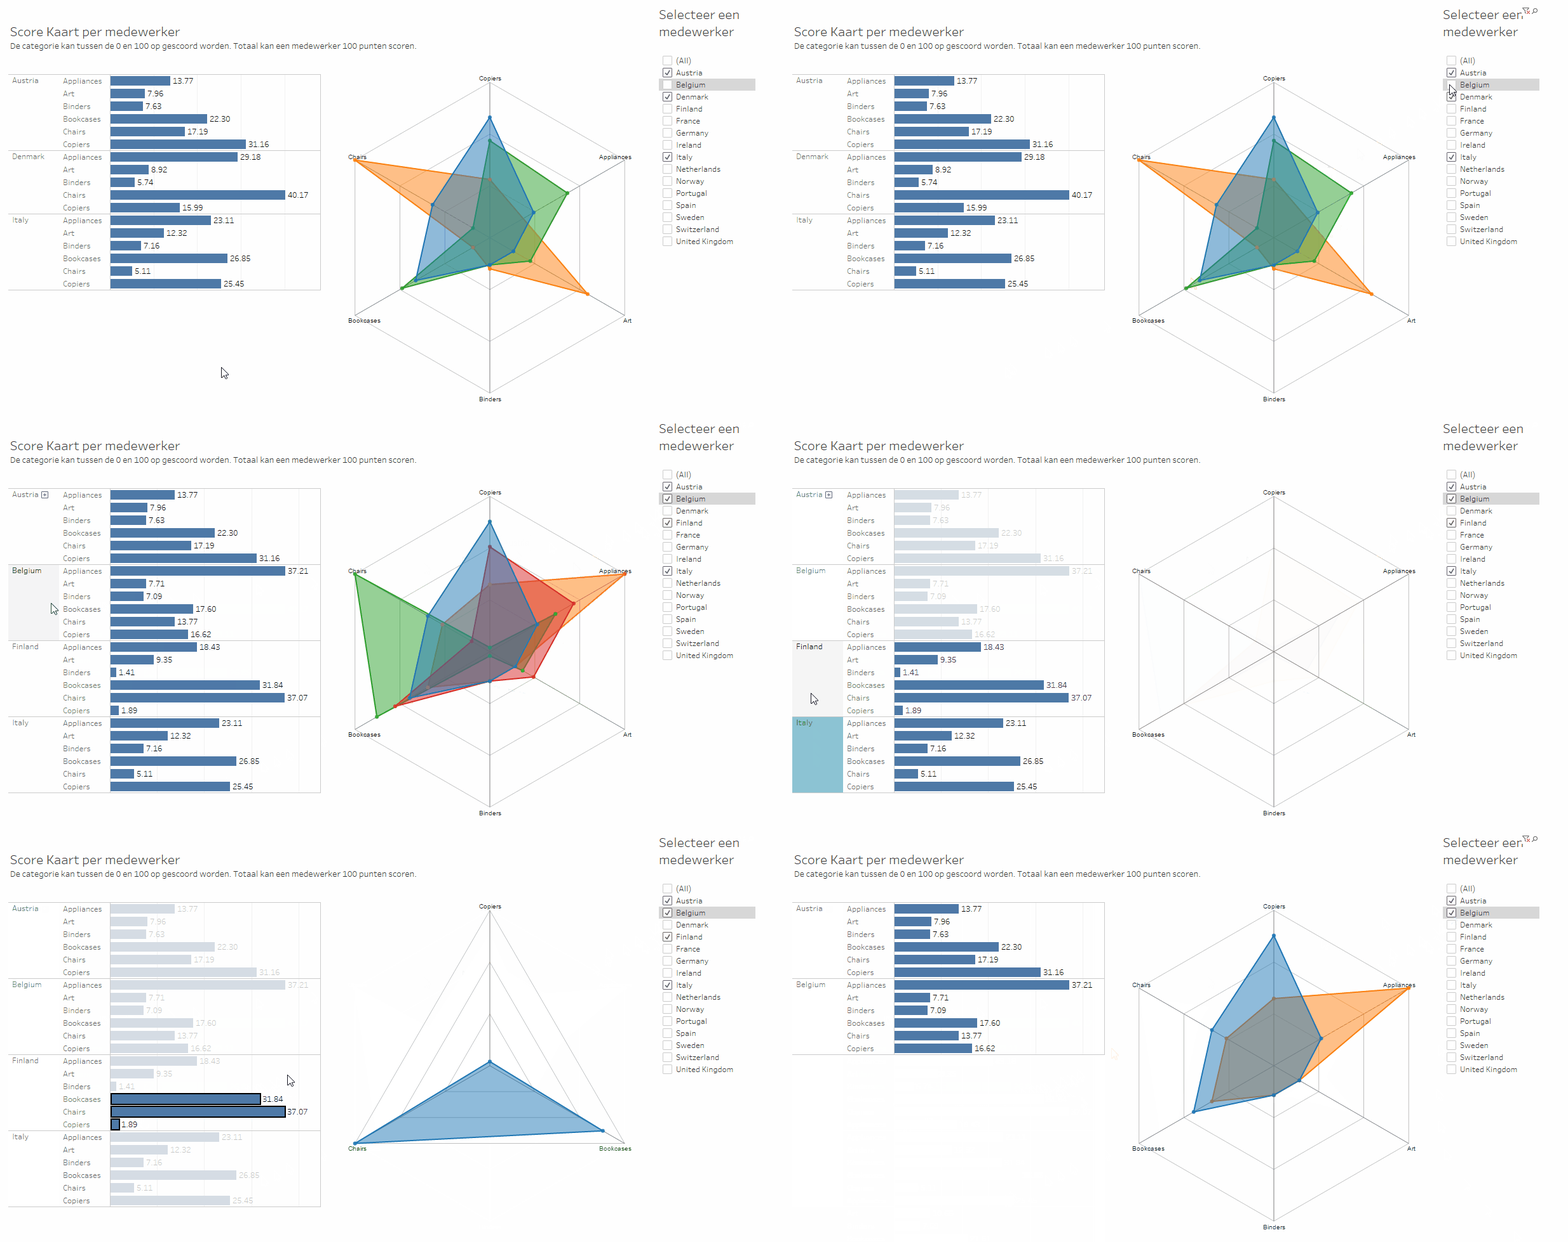
The Show me More Extension for Tableau adds new visualization types to your Tableau Desktop Creator. Just drag the extension to your dashboard, select your Graph type and you’re ready to connect some data to your chart.
The Free version allows you to use a Sankey Diagram and Network Chart. The premium version adds more graph types like the Radar Chart, Google maps chart and Organization Chart. Have a look at our subscription plans and decide what best fits your needs.
