Maximizing Data Potential
LONDON | Tottenham Hotspur | 27th June 2023
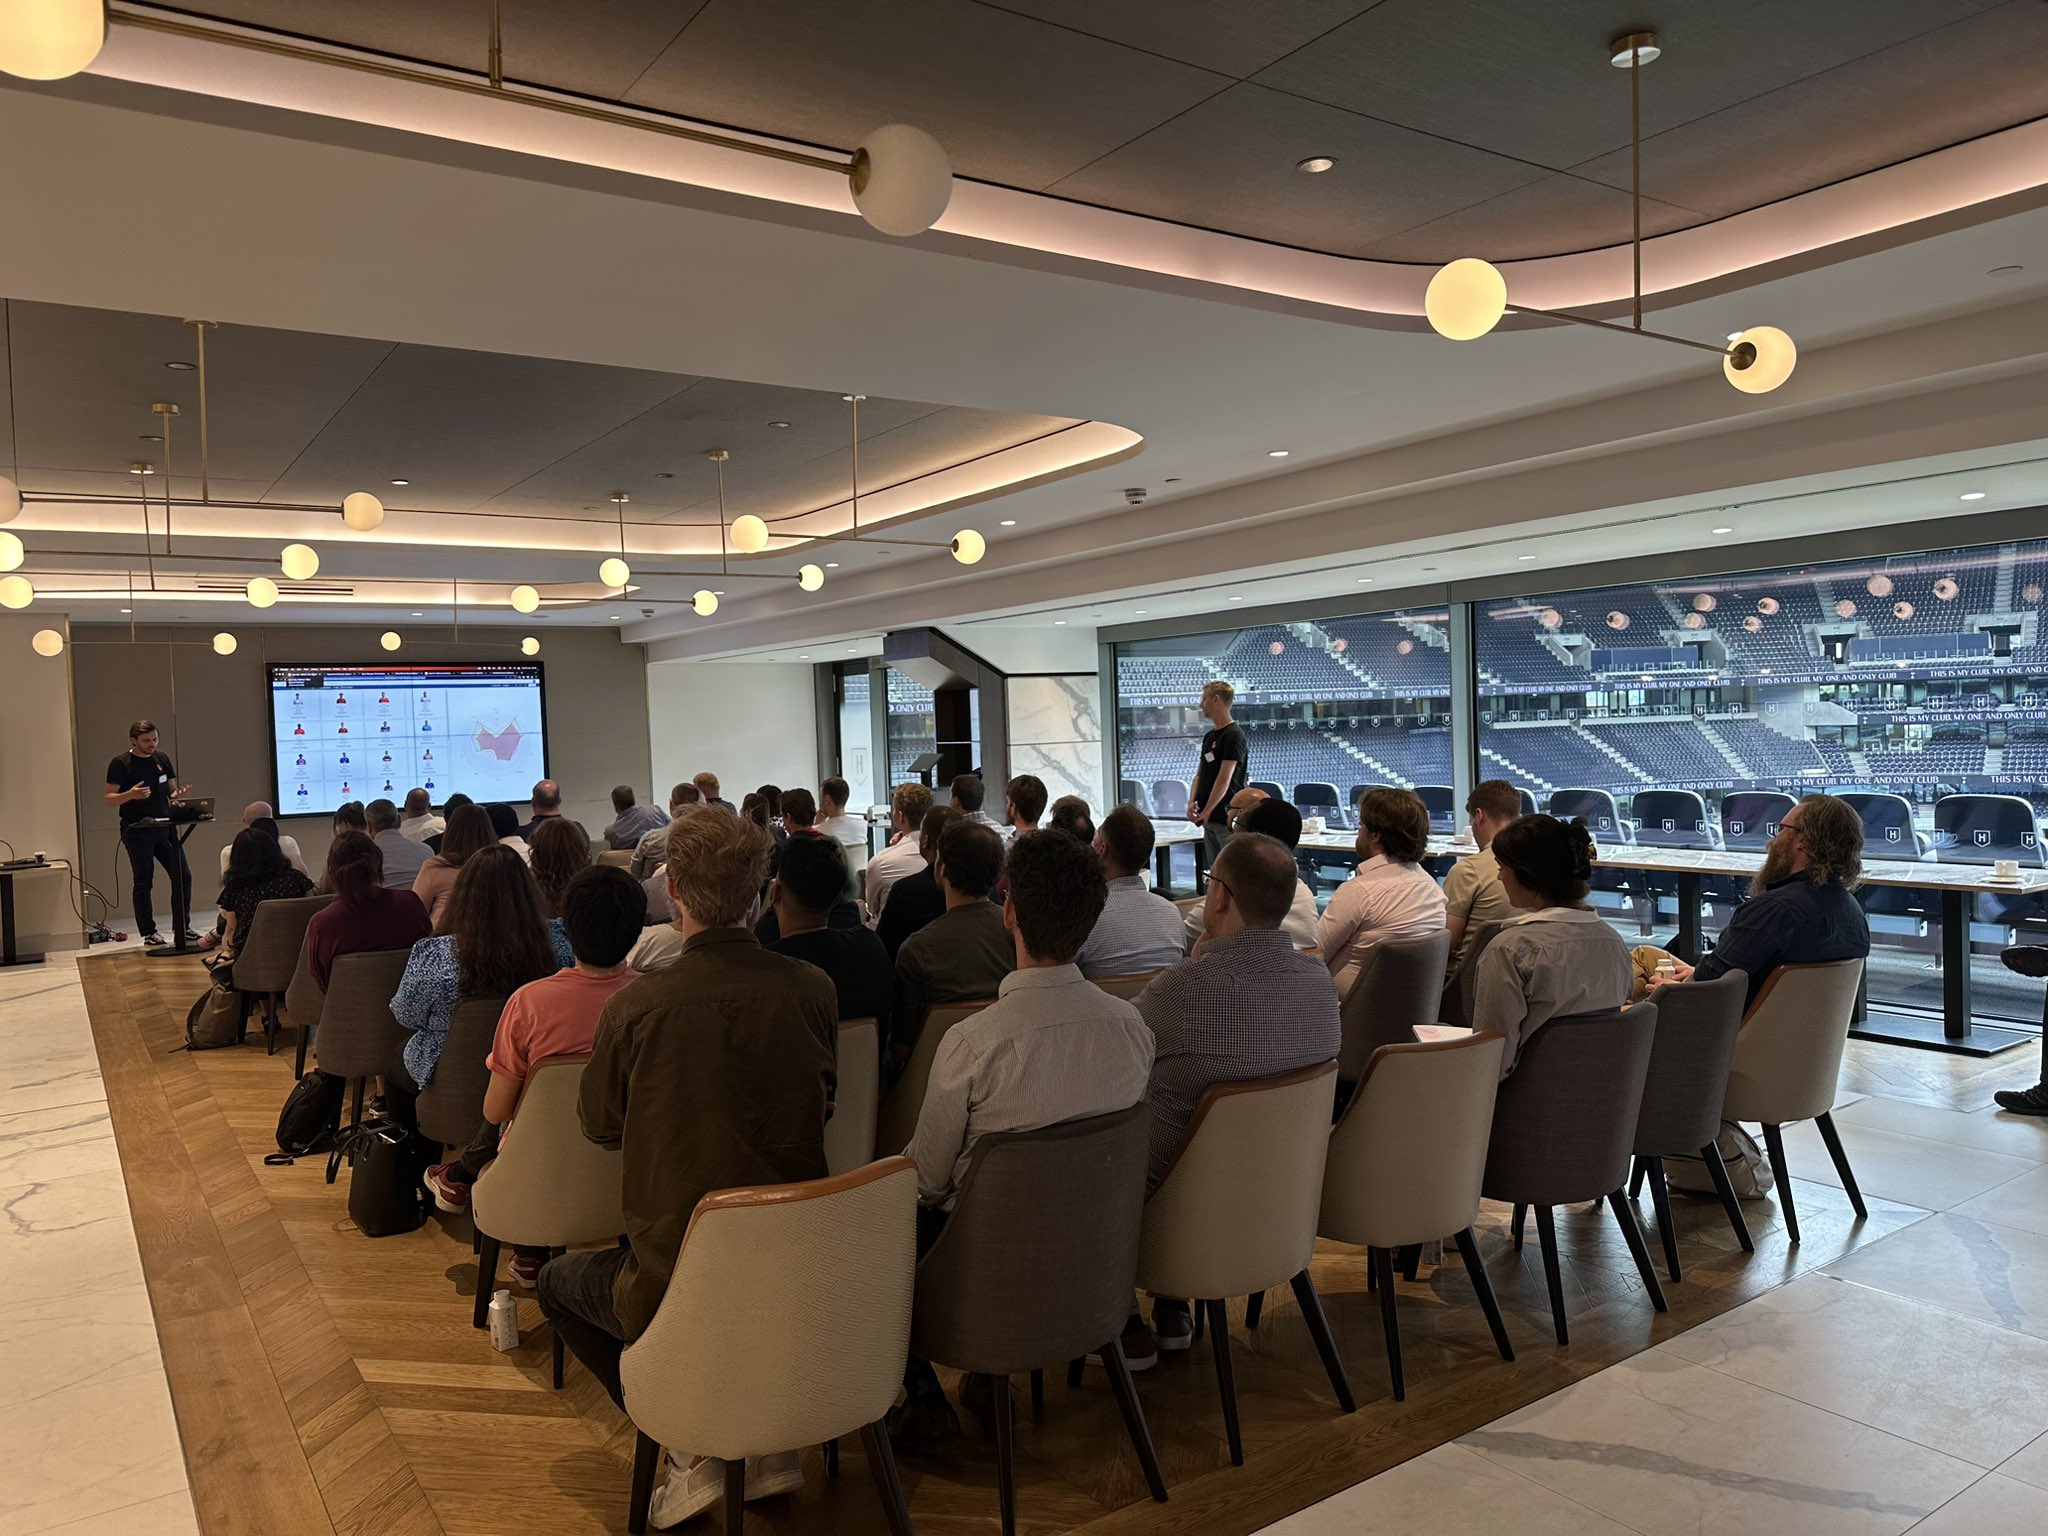
Tableau enthusiasts and experts gathered at Tottenham Hotspur Stadium for an unforgettable event. With distinguished speakers and thrilling experiences, attendees immersed in the world of data visualization and sports greatness.
You did WHAT with Tableau APIs?
Vincent Cruickshank initiated the event by providing an informative overview of Tableau’s Embedding API. He then proceeded to demonstrate a practical application of the API through a Google Chrome extension that seamlessly integrates Tableau dashboards onto the Google homepage, offering users convenient access to visualized data directly within their browsing experience.
Tableau visionary Sarah Bartlett shares captivating insights on dashboard design
Next up was Sarah Bartlett, a Tableau visionary, who delivered a captivating talk on “Amazing Dashboard Design.”
Sarah not only shared tips and tricks on creating visually stunning dashboards but also emphasized the do’s and don’ts when it comes to dashboard design. Her expertise, combined with the awe-inspiring view from the skywalk, provided a unique and immersive learning experience for the audience.
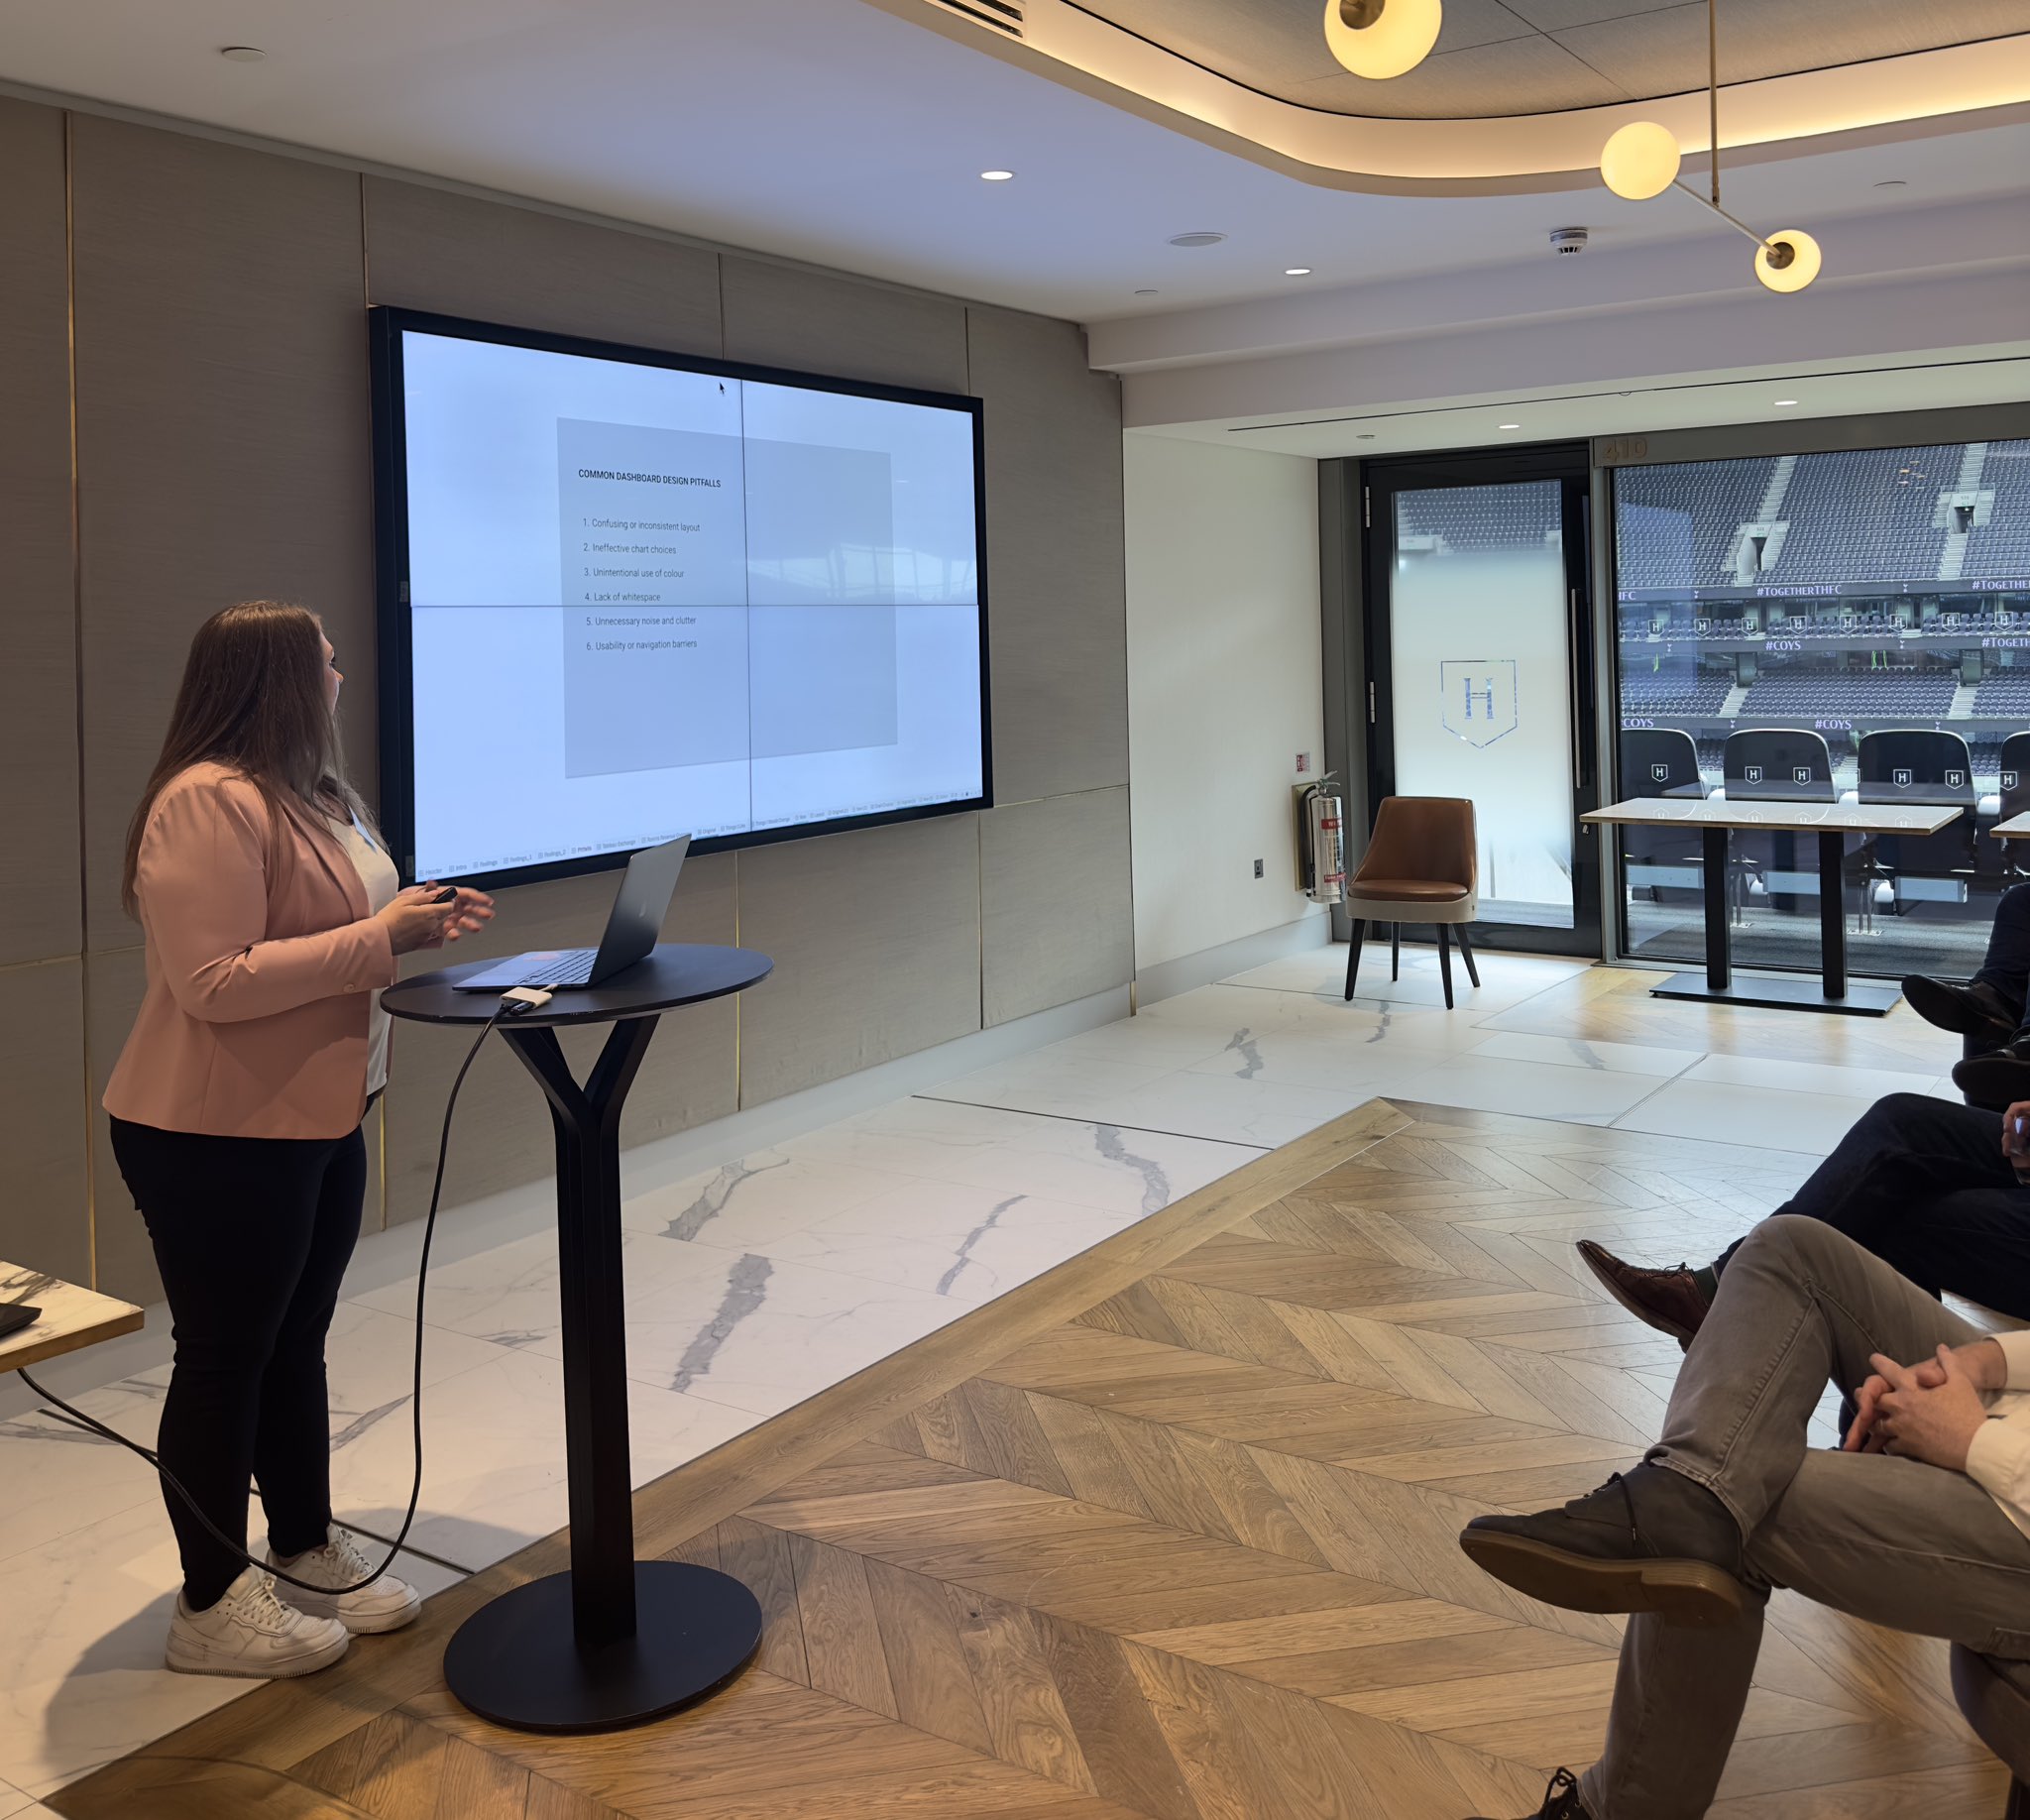
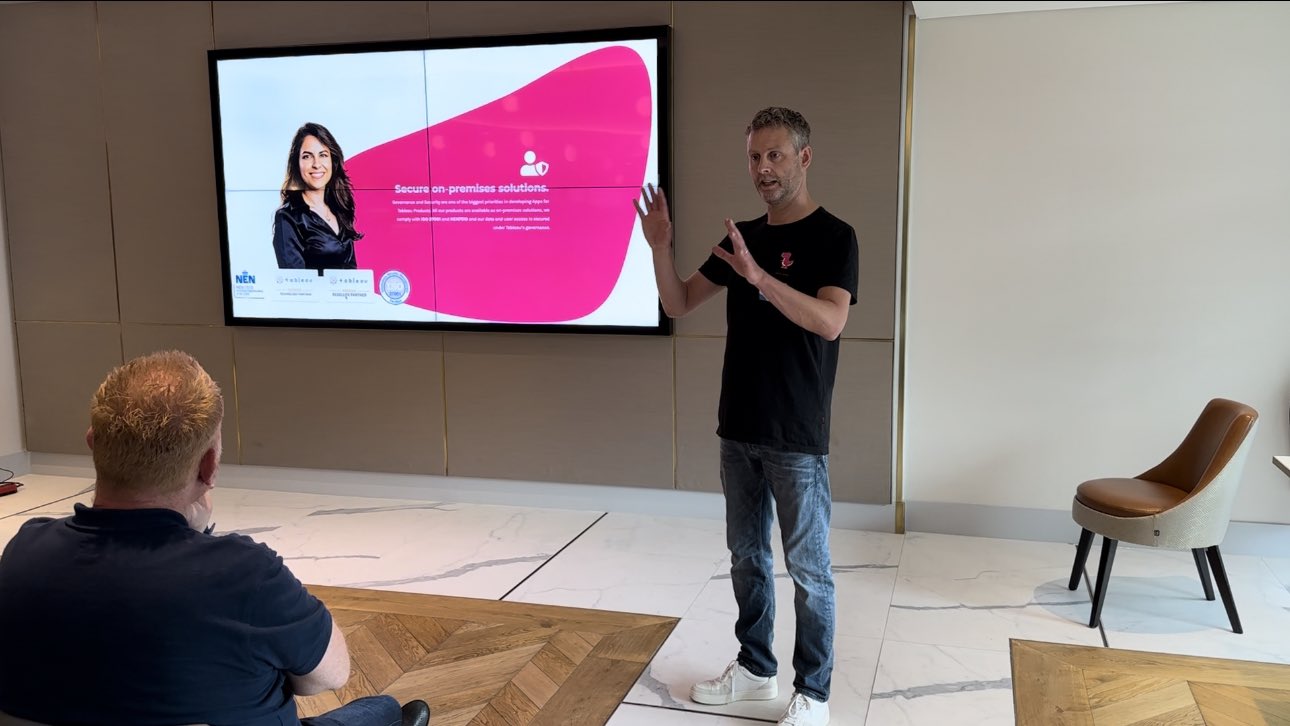
Tableau extensions redefine data exploration
Richard van Wijk and Vincent Cruickshank returned to the stage, this time to demonstrate the power of Tableau Extensions. Their session showcased three remarkable extensions: SuperTables, DrillDownTree, and WriteBackExtreme. These Extensions exemplified how Tableau can be extended beyond its core functionalities to enhance data exploration, analysis, and interactivity. The energy and excitement from the stadium tour added an extra layer of enjoyment to the session, as attendees experienced the thrill of being on the hallowed grounds of the Tottenham Hotspur stadium.
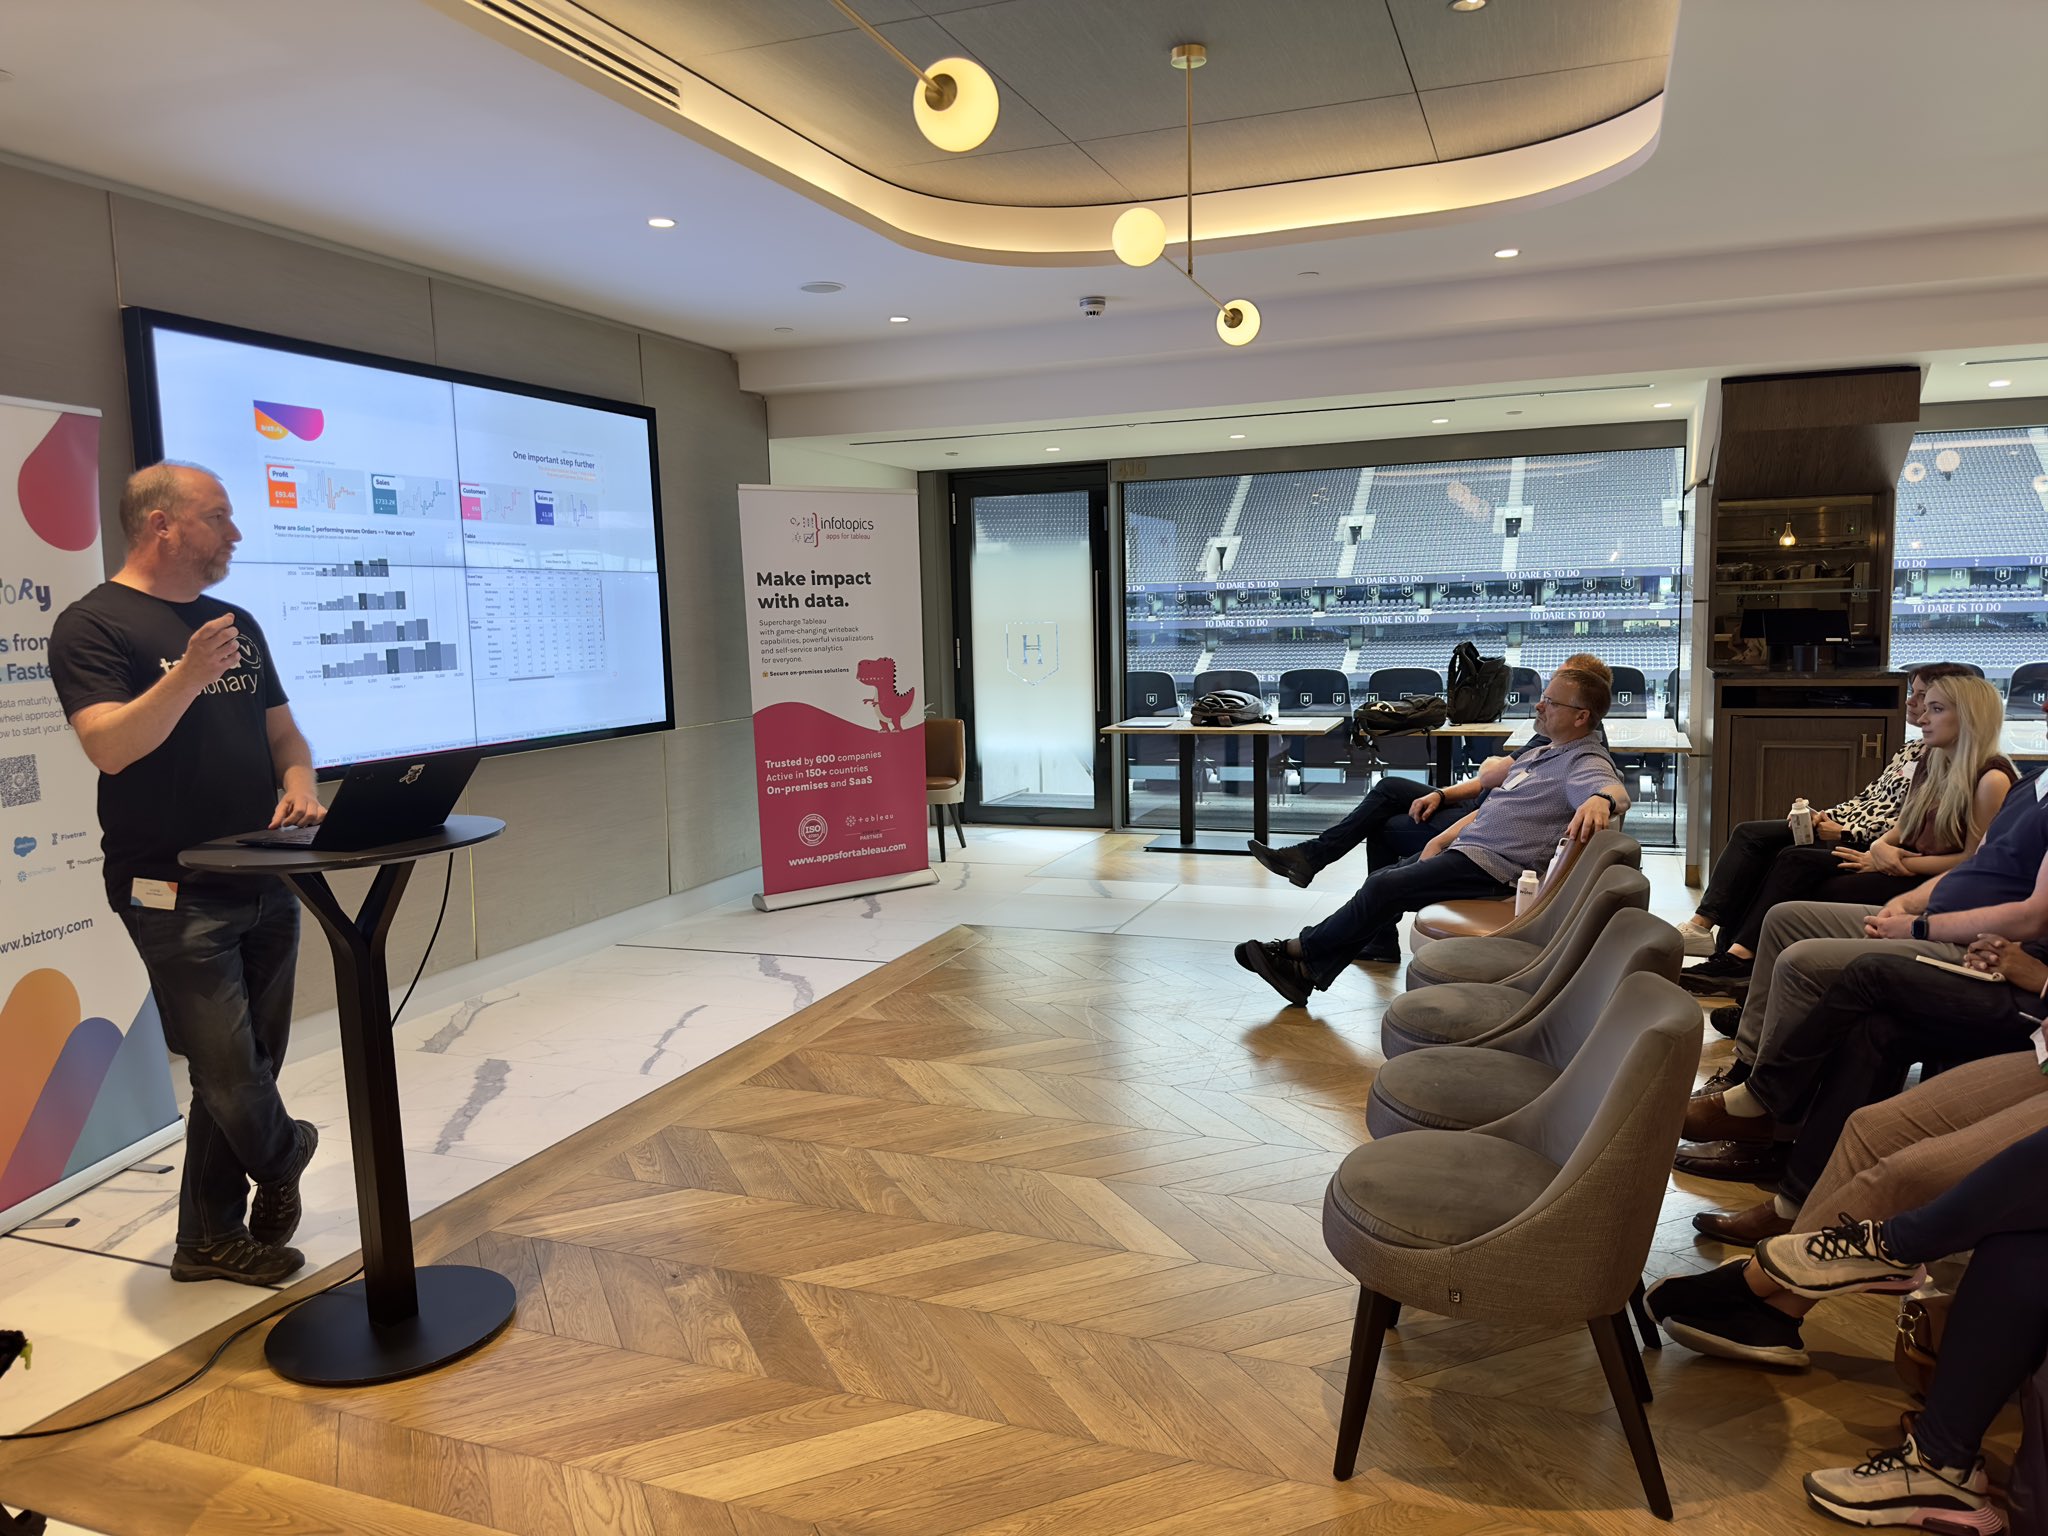
Harvey Ryan and Andy Montgomery highlight effective data bridging strategies, sharing real-world insights
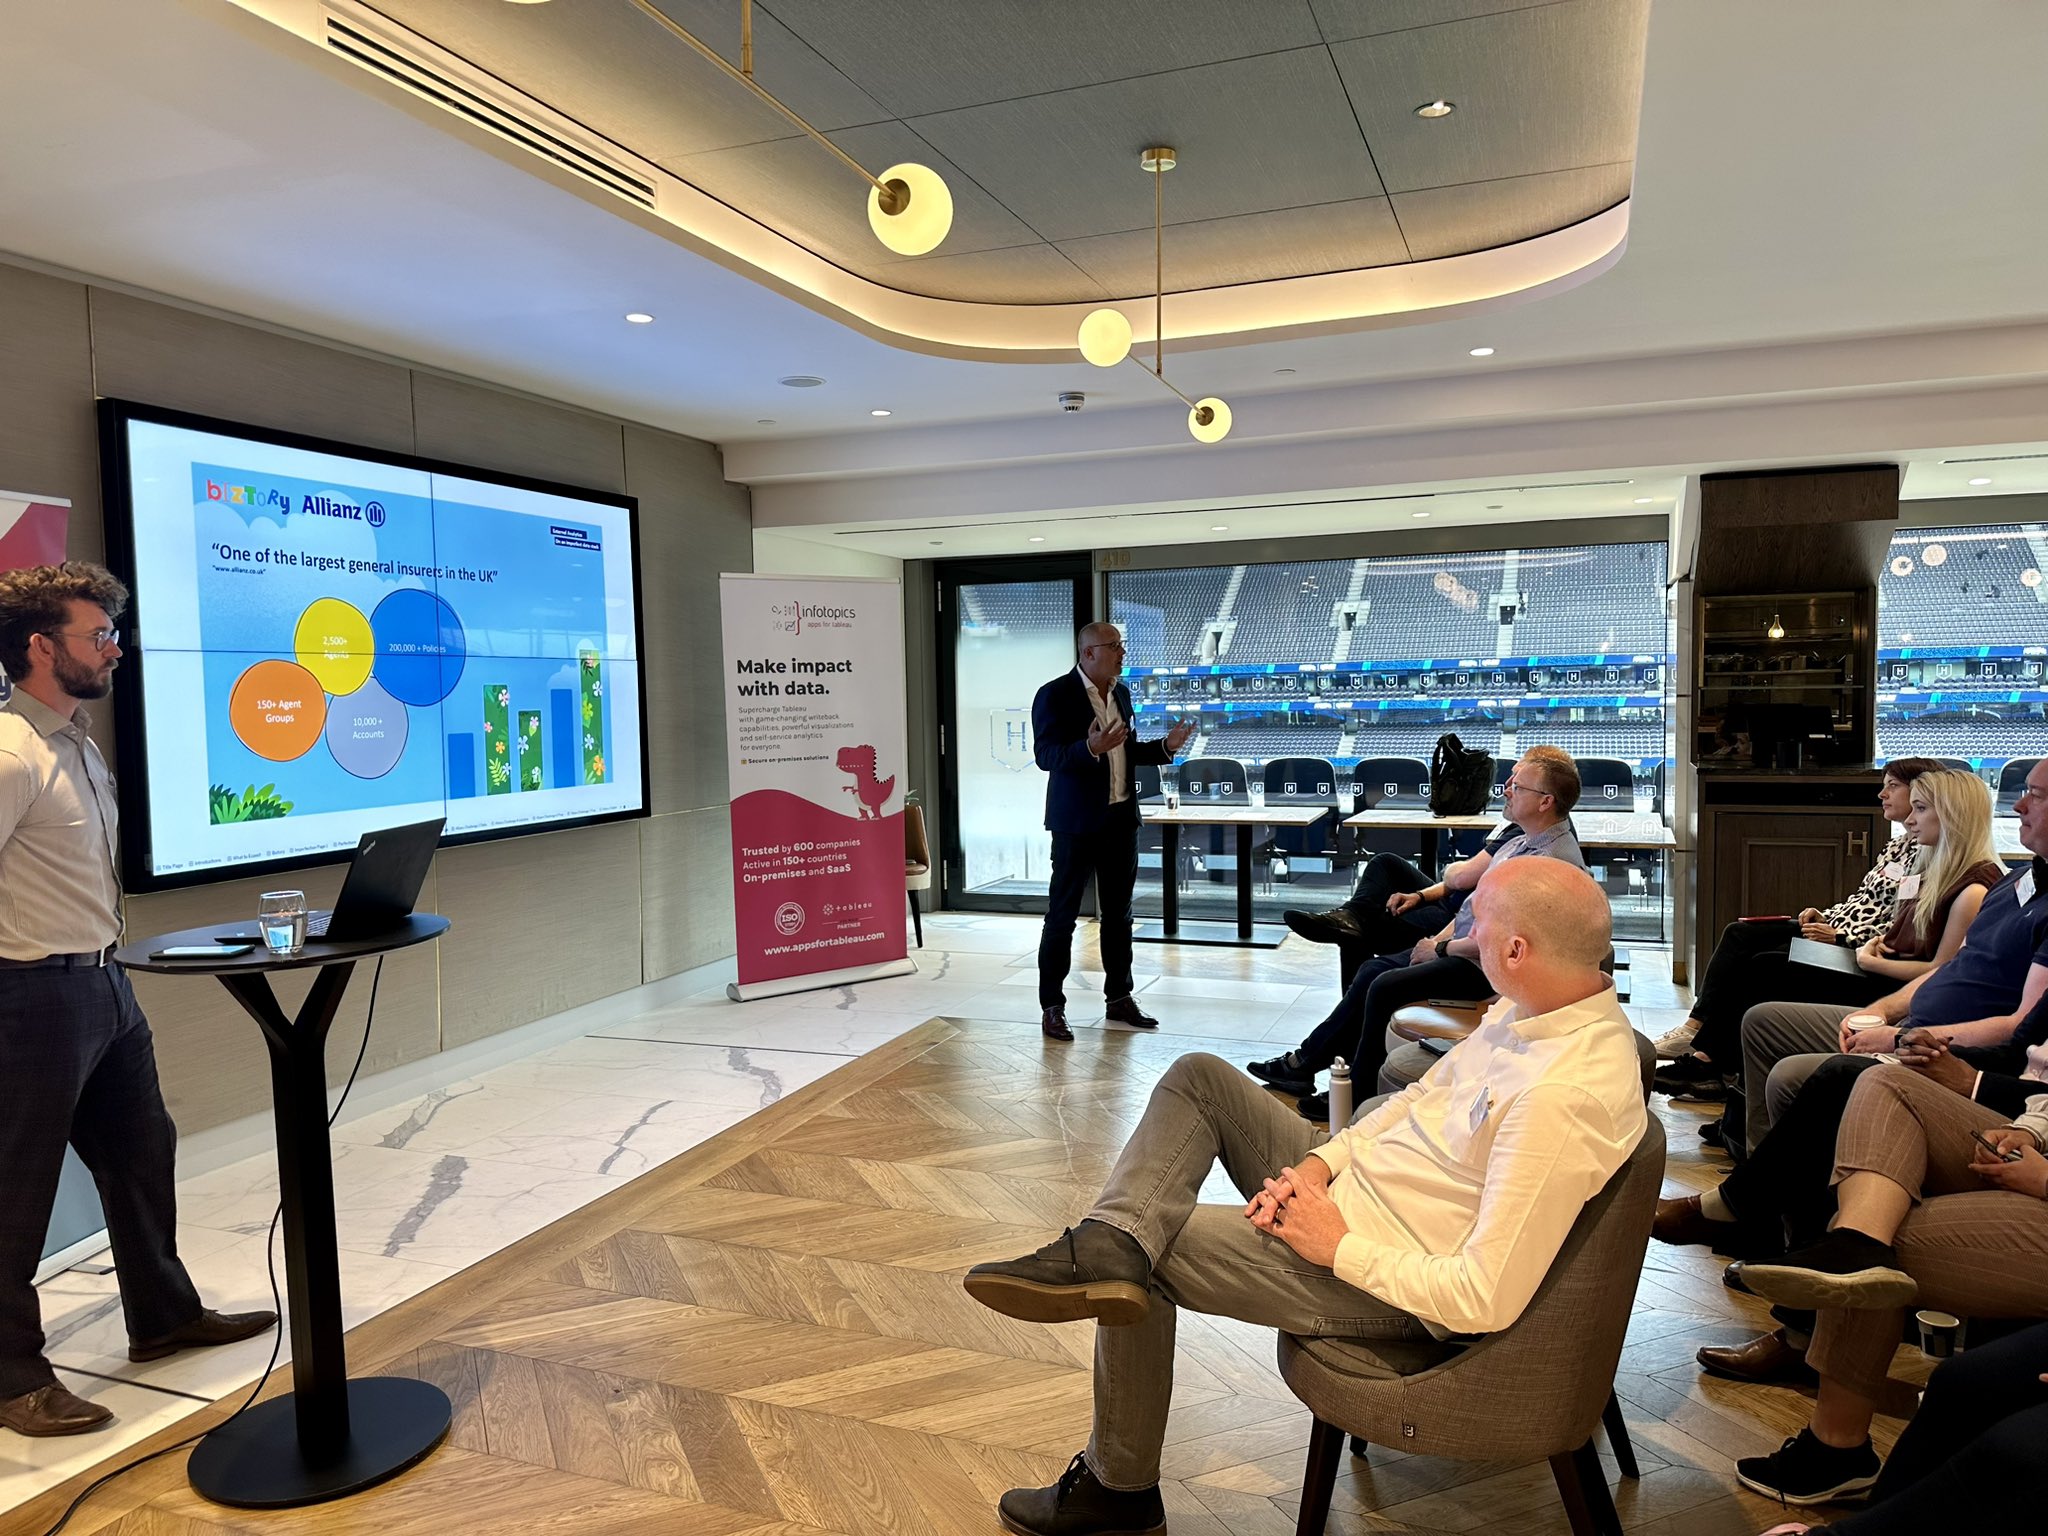
Harvey Ryan from Biztory took the stage to discuss leveraging Tableau to bridge the gap between complex data structures and effective dashboard development. He shared insights and strategies for overcoming data challenges. As part of his session, Harvey invited Andy Montgomery from Allianz to join him on stage. Andy discussed their onboarding experience from Biztory, providing real-world insights into the challenges and successes they encountered.
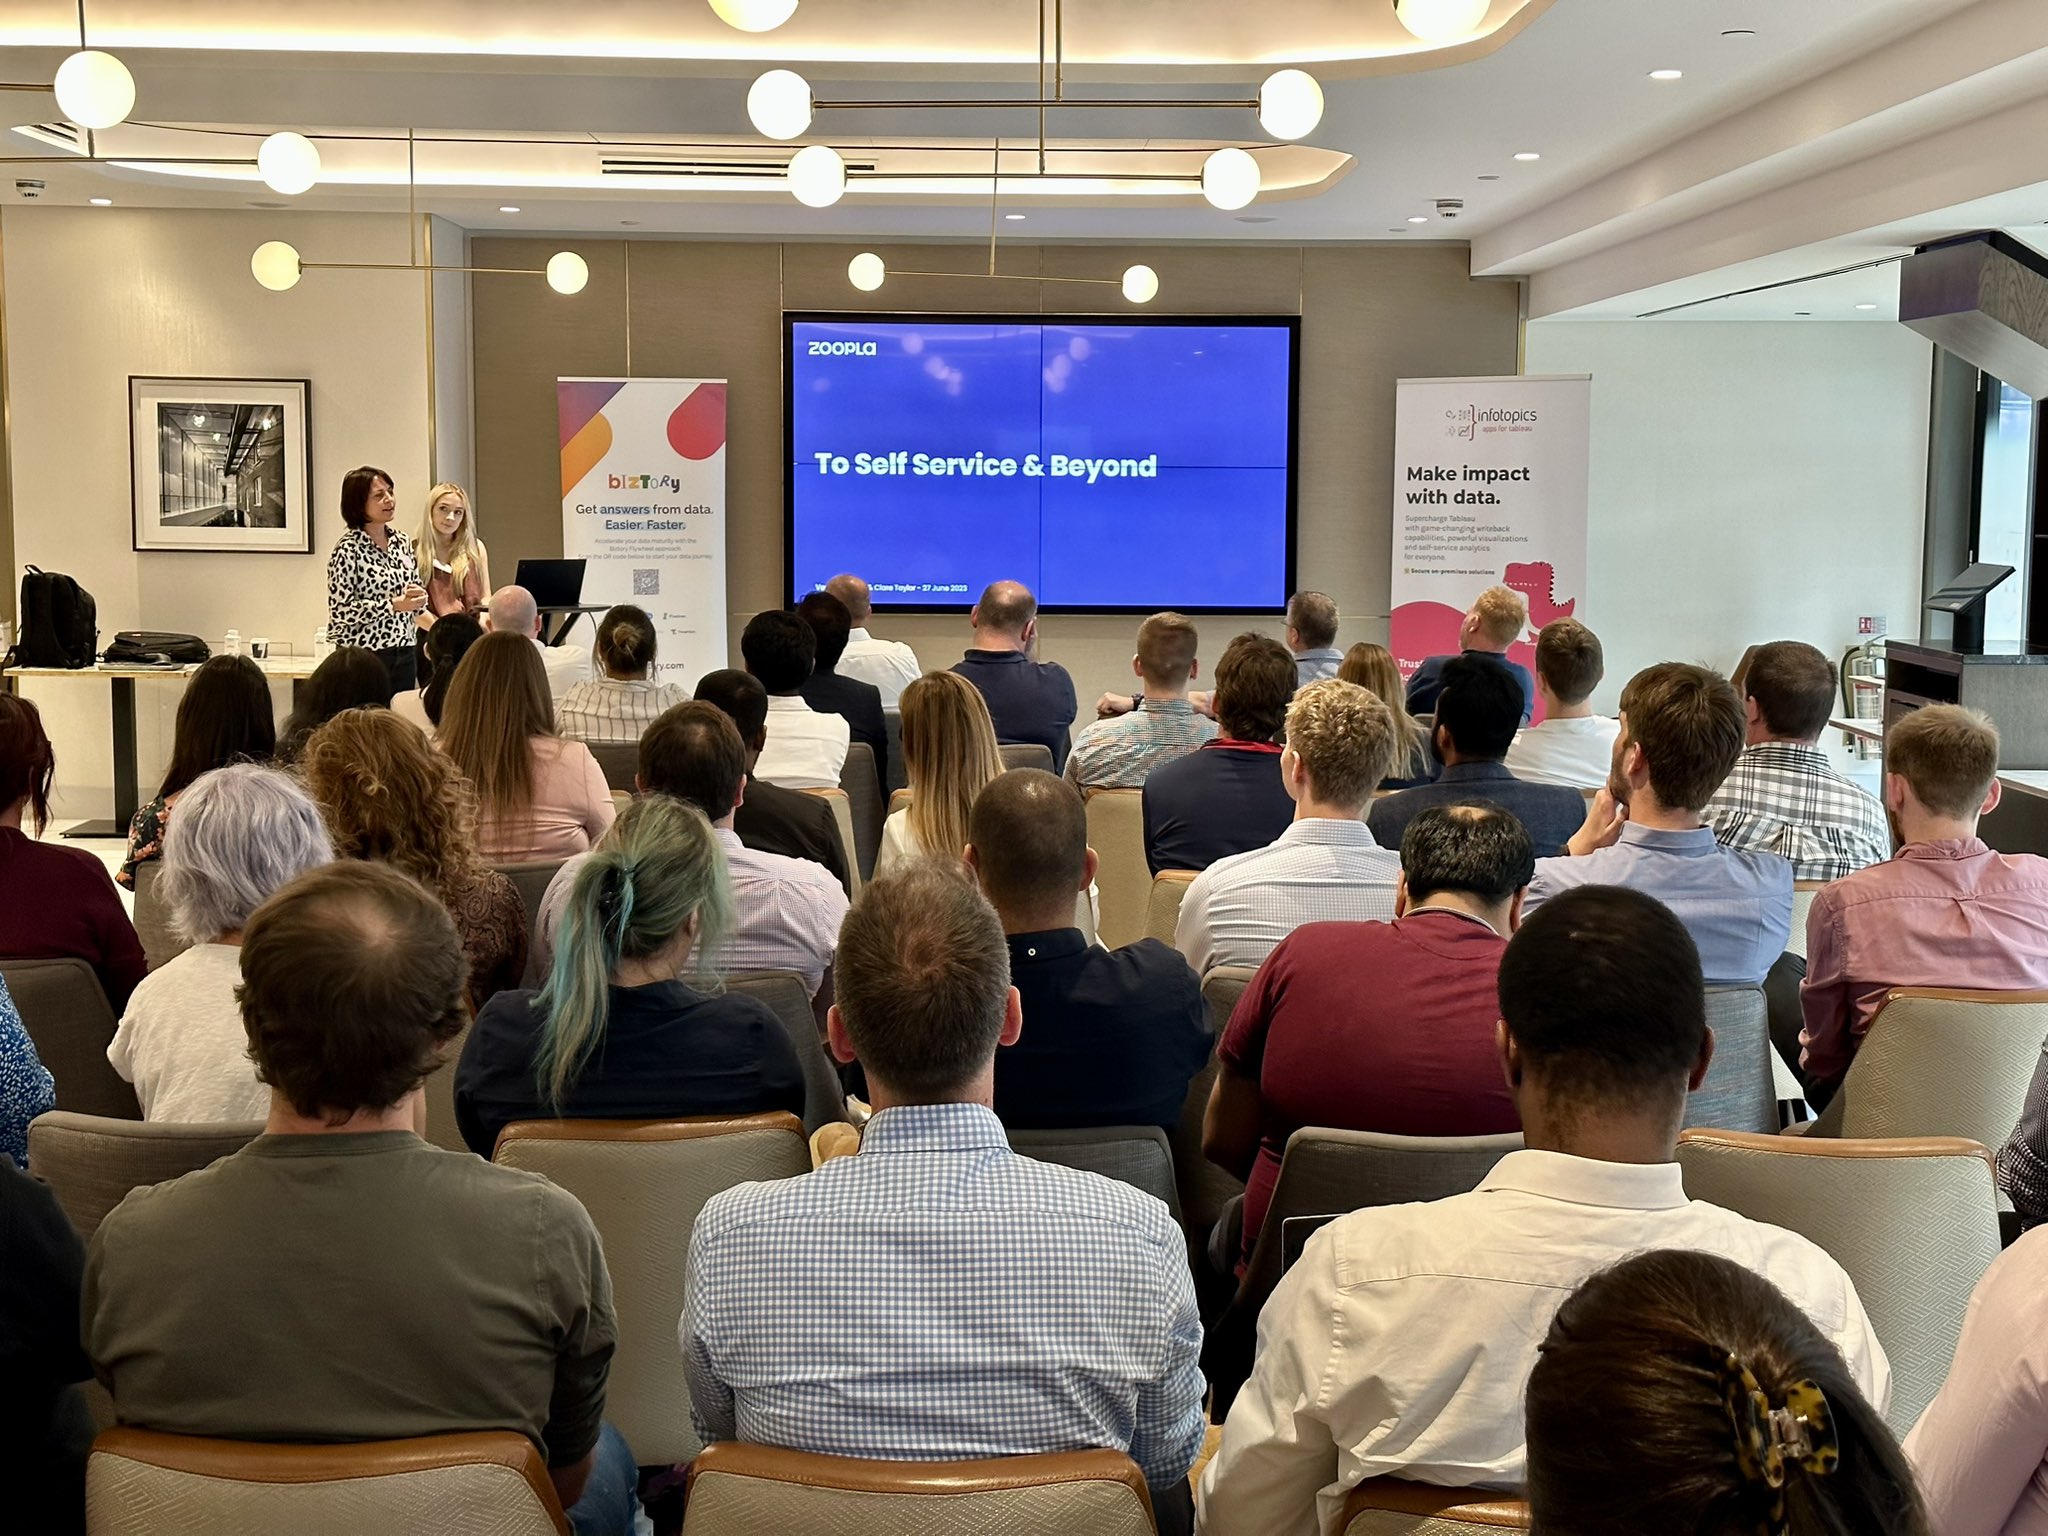
Zoopla’s Clare and Veronica showcase their journey from service desk to self-service analytics
Clare and Veronica took the stage with their session titled “To Self Service and Beyond.” They shared their data team’s journey, highlighting the transformation from a service desk to empowering the business with a self-service analytics platform. Attendees gained valuable insights into the challenges, successes, and lessons learned as they ventured beyond traditional service-based analytics.
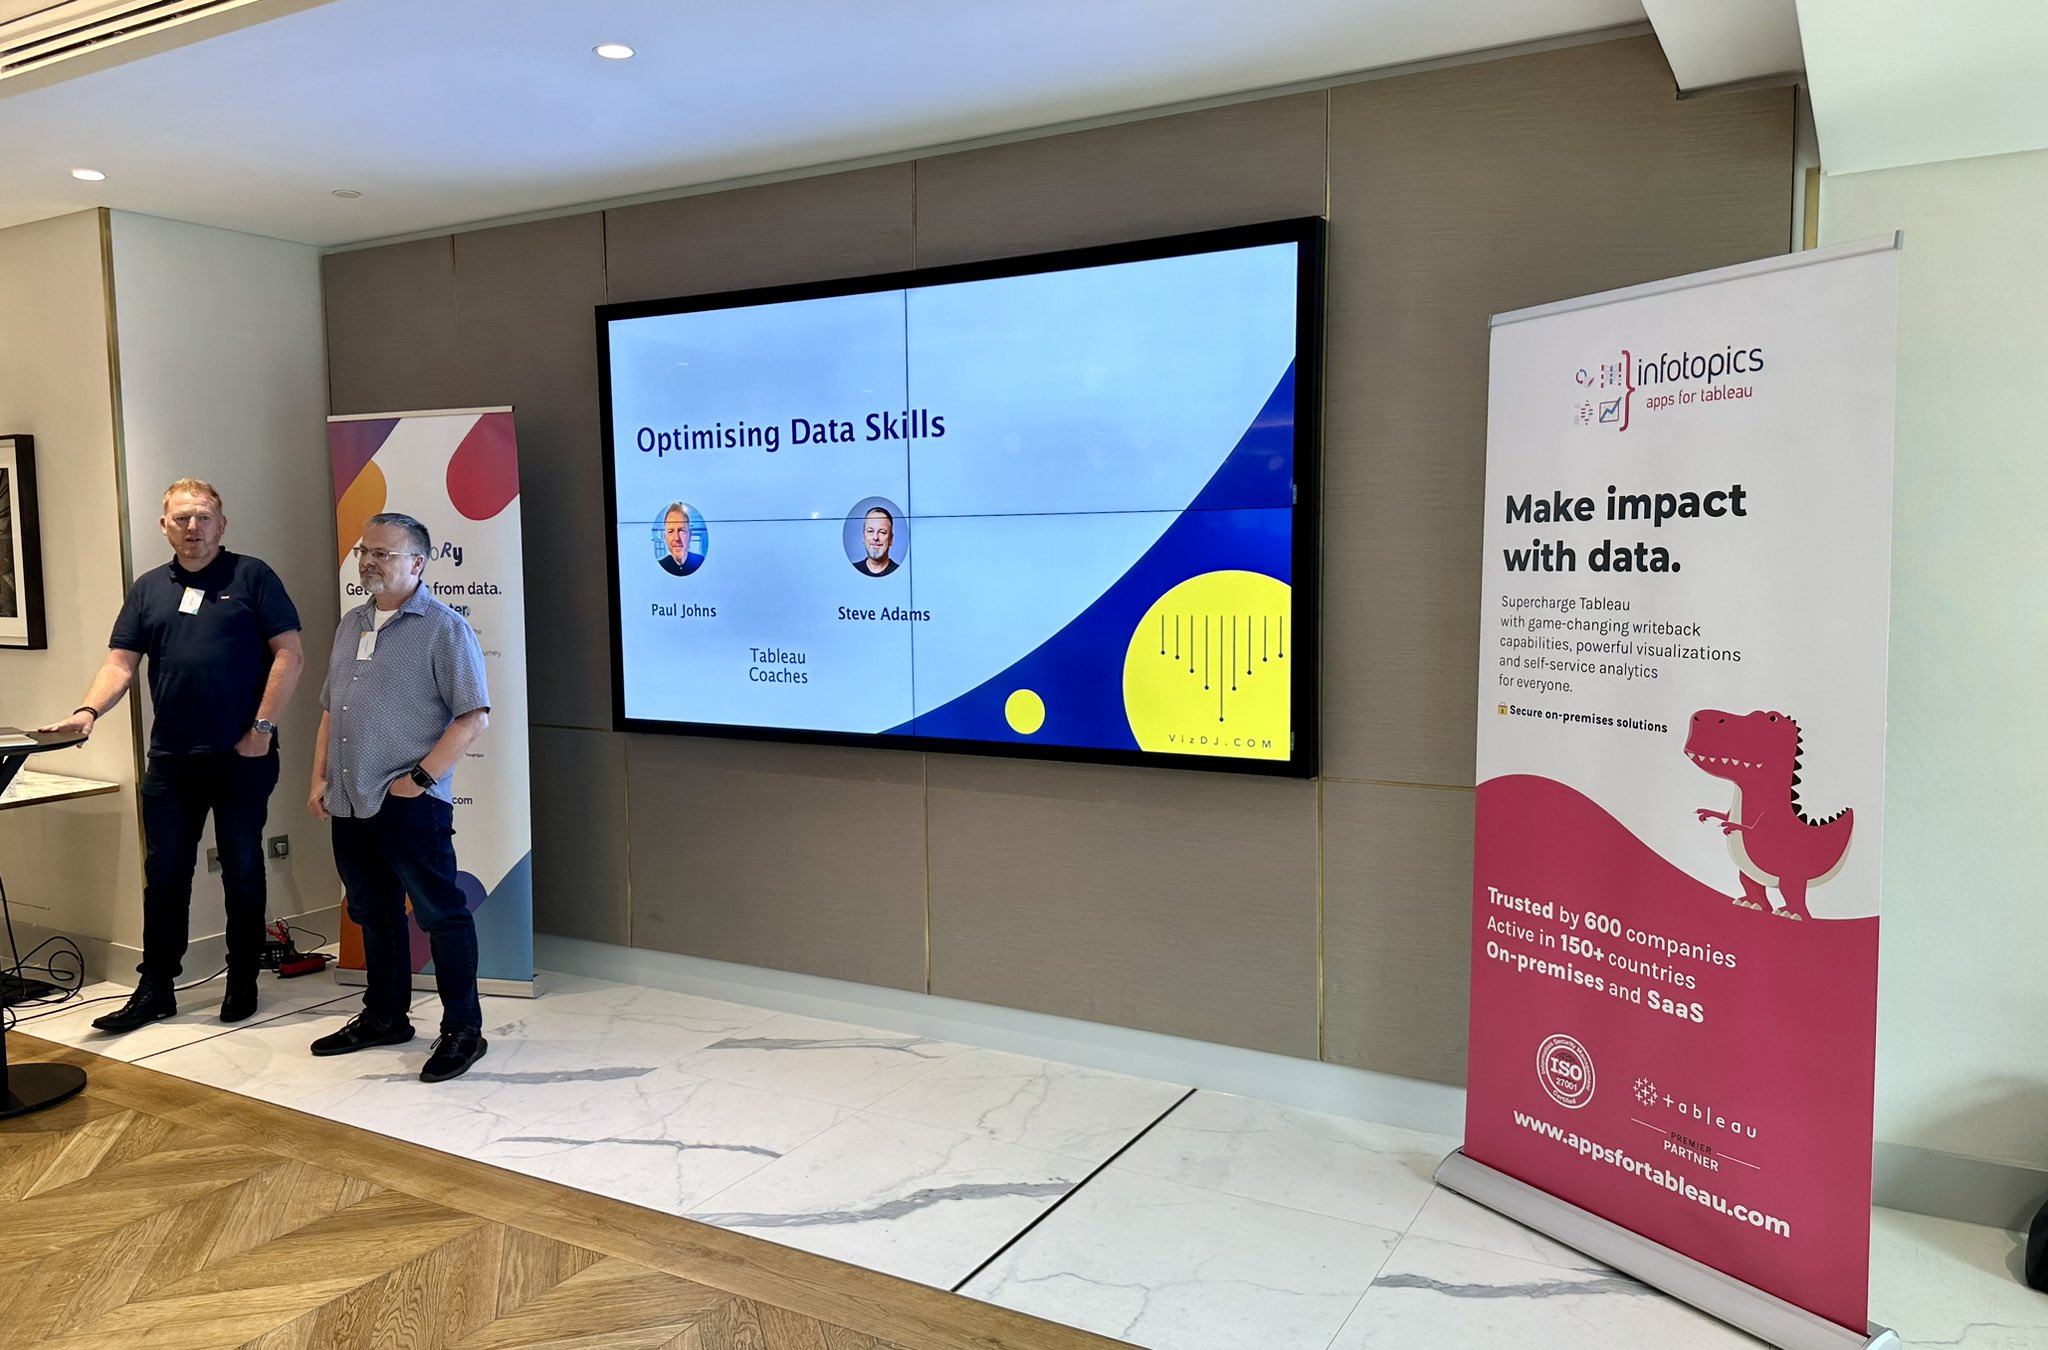
VizDJ’s Steve Adams and Paul Johns ignite inspiration and motivation by discussing dynamic Tableau coaching sessions
VizDJ‘s Steve Adams and Paul Johns brought a unique and dynamic element to the event with their session on Tableau coaching. Through a combination of storytelling, interactive exercises, and live demonstrations, they showcased the power of coaching in unlocking Tableau’s potential while infusing the session with entertainment and creative elements, leaving attendees inspired and motivated.
Elevating Tableau Reporting: Dynamic Zone Visibility Unveiled by Samuel Parsons
Samuel Parsons, a Tableau Visionary and Biztory Analytics Cloud Lead, delivered an enlightening session on the topic of dynamic zone visibility in Tableau. He demonstrated how this feature can be leveraged to enhance reporting capabilities and create interactive dashboards that adapt to user interactions. By showcasing the potential of dynamic zone visibility, Samuel inspired attendees to explore new possibilities and take their Tableau reporting to the next level.
The day was nothing short of amazing, featuring captivating sessions delivered by inspiring speakers, and we even added some adrenaline-pumping moments with the Dare Skywalk and a remarkable Tottenham Hotspur Football Club Stadium Tour! Are you interested in hosting an event together of presenting at a session?