Dashboard Usage 2.0
BUILT FROM THE GROUND UP WITH A NEW SUITE OF TRACKING FEATURES

Redesign
In this blog, we would like to introduce you to a completely redesigned Dashboard Usage extension. It has been built from the ground up and we’ve implemented some powerful new features. We’ve been listening to your feedback and can’t wait to show you what’s new!
What is Dashboard Usage?
With Dashboard Usage, you can keep track of the way users interact with your Tableau dashboards. With this information, you can perform analytics and improve the design of your dashboards.
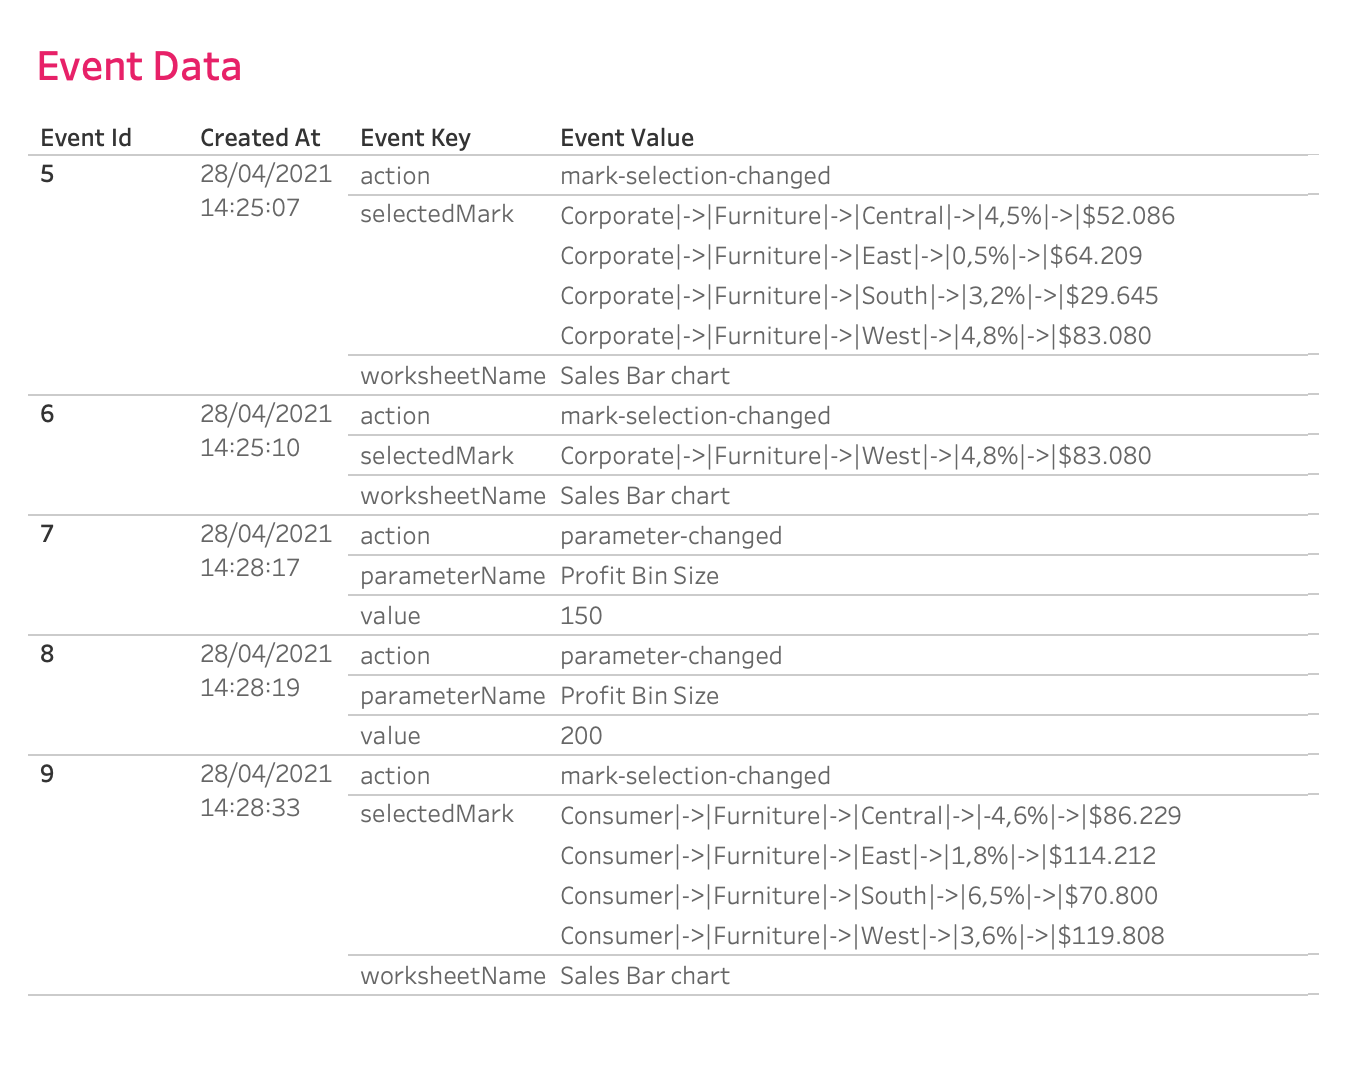
On the right, you can see an example use case where we’ve used the data that was logged by Dashboard Usage to analyse dashboard events. We’ve created a timeline in Tableau that illustrates the interaction with marks, filters and parameters on a specific dashboard. Joined to the timeline is a table that shows detailed event data. For example: the marks that have been selected, or the value a filter has been set to. You can use this to design better dashboards by removing unused elements and pay attention to the ones that matter.


Moving away from Google Analytics
The old Dashboard Usage relied on Google Analytics to store logged events in Tableau dashboards. With the introduction of the new Dashboard Usage, we’re choosing to collect the data locally and not share anything with Google. Doing so ensures a higher level of security, because you decide what to do with your data. The new extension uses a local database to store dashboard usage information and the installation remains as simple and straight forward as before. The collected data can be used to power other dashboards, right in Tableau!
More tracking options
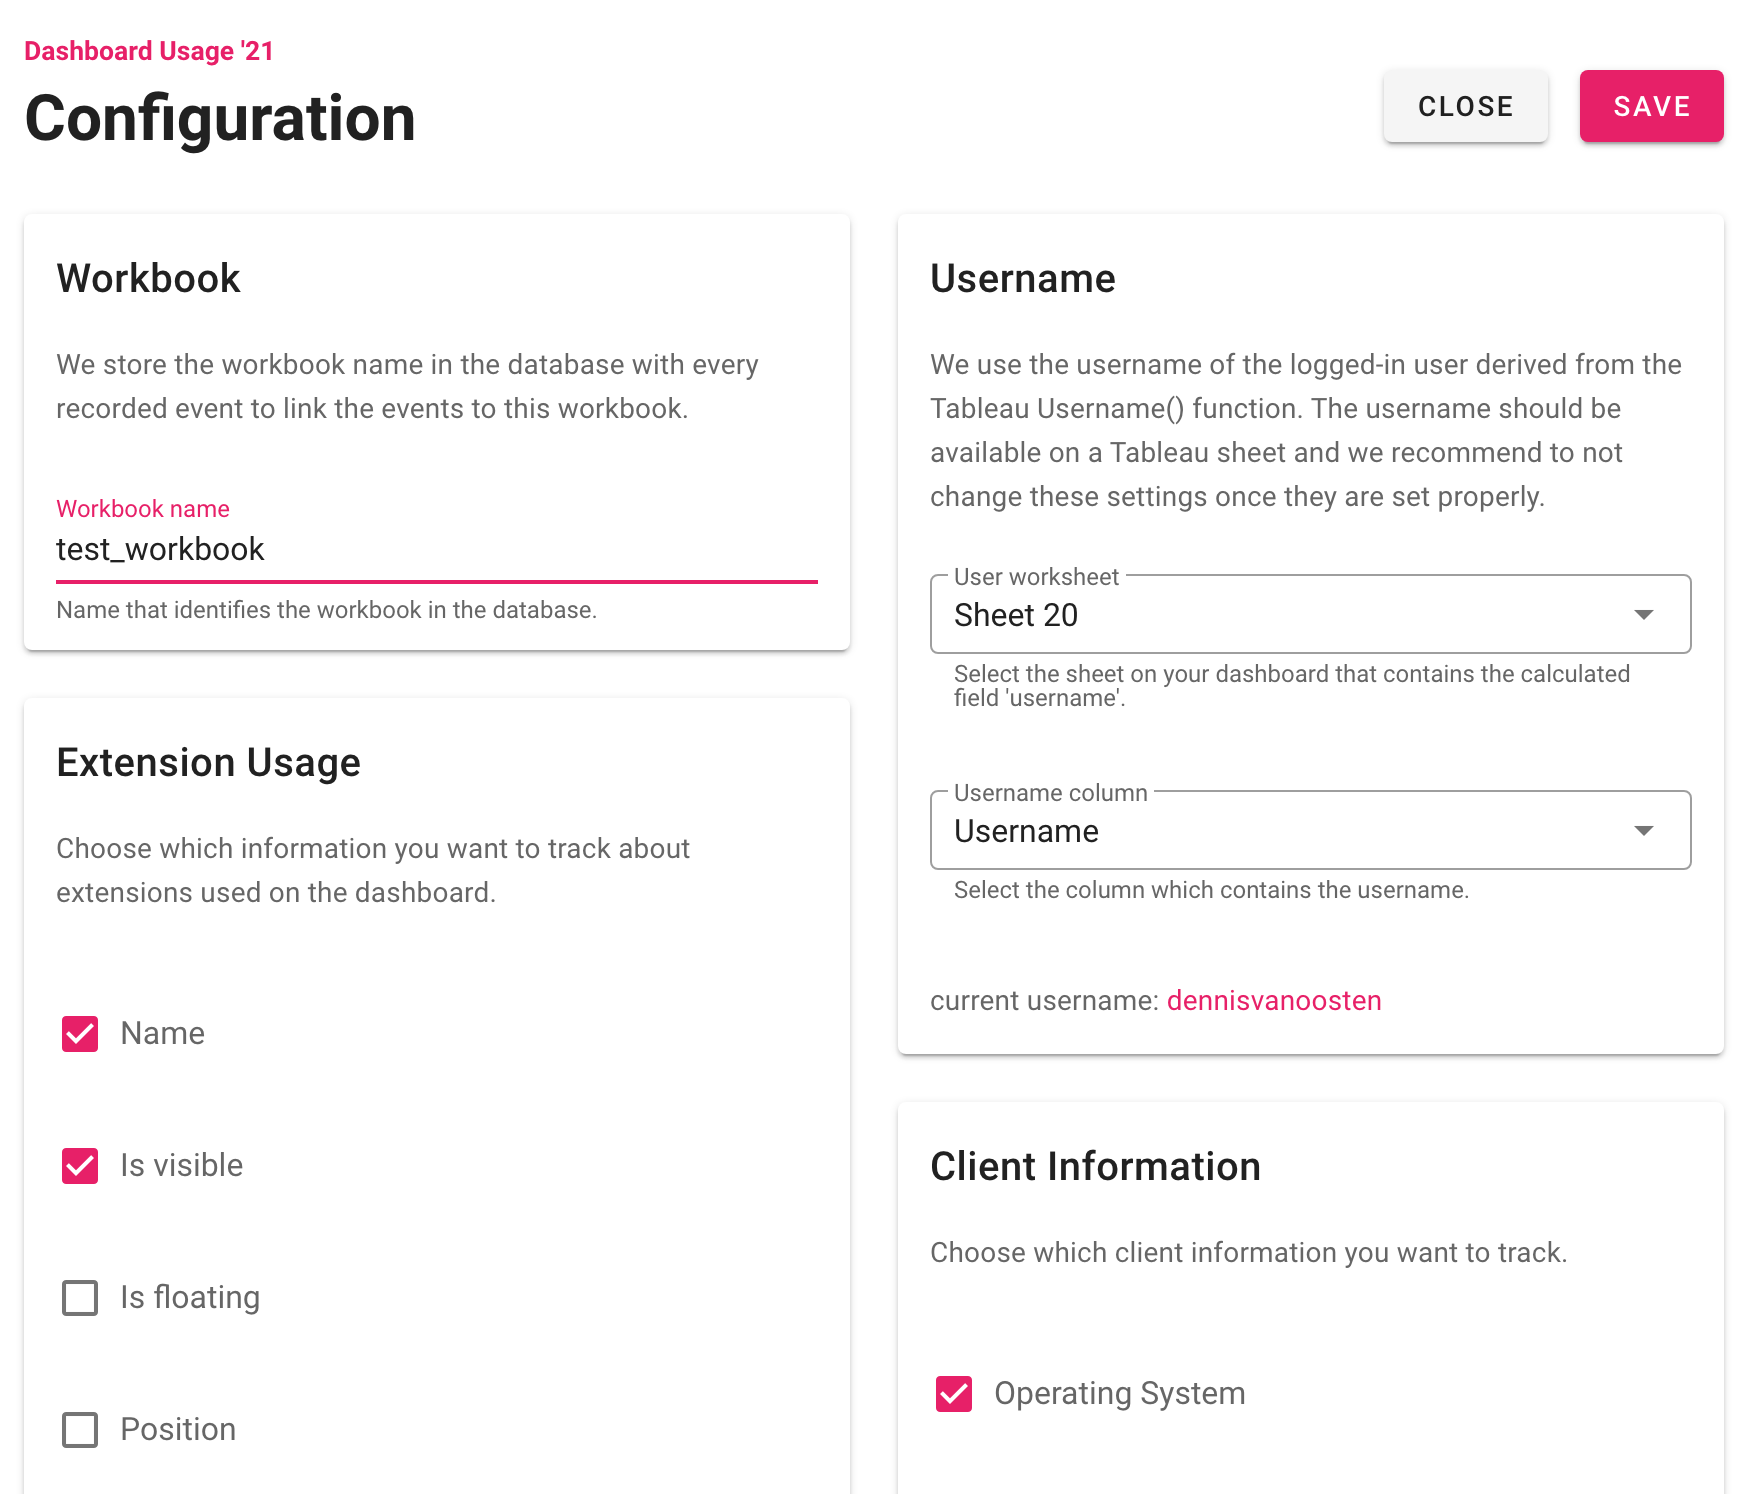
With the new Dashboard Usage, the amount of information that can be track increased massively. We’d like to present you with the additions and give you a few more use cases for the new features.
Dashboard events
The old extension was able to track dashboard events such as mark selections and filter changes. This doesn’t change with the new extension. You can configure which of these events you want to track and use the information to improve your dashboards.

Client information
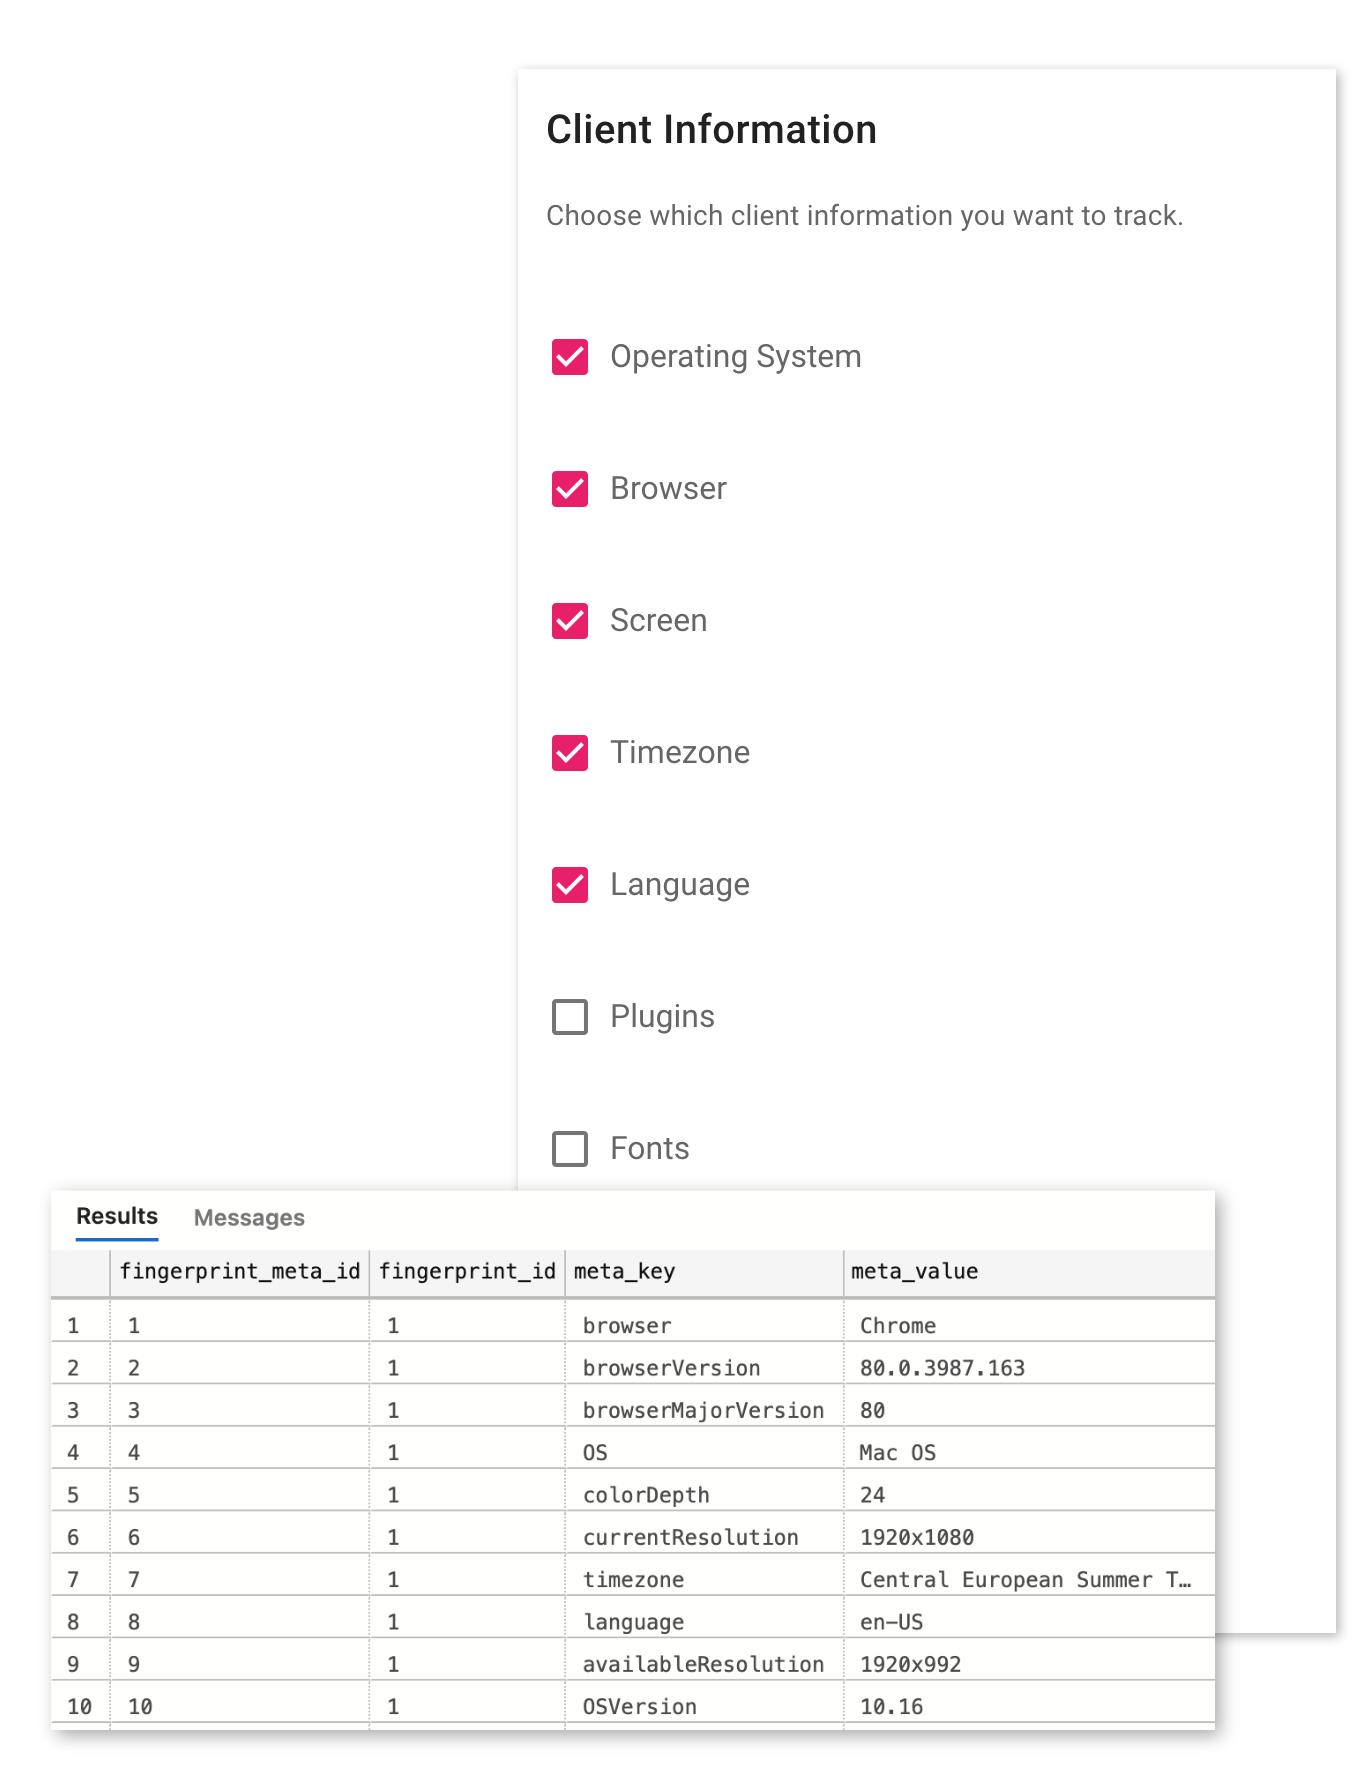
New to Dashboard Usage is the ability to track client information. This is basic user identification, such as the username of the person who’s logged in, but can be expanded with a variety of client data. This includes things like operating system, browser, and installed fonts, just to name a few.
The image shows an example of the fingerprint_meta table. All client information about a specific user will be stored in here. A possible use case is to analyse screen resolutions and adjust the size of your dashboards accordingly.

Extension usage
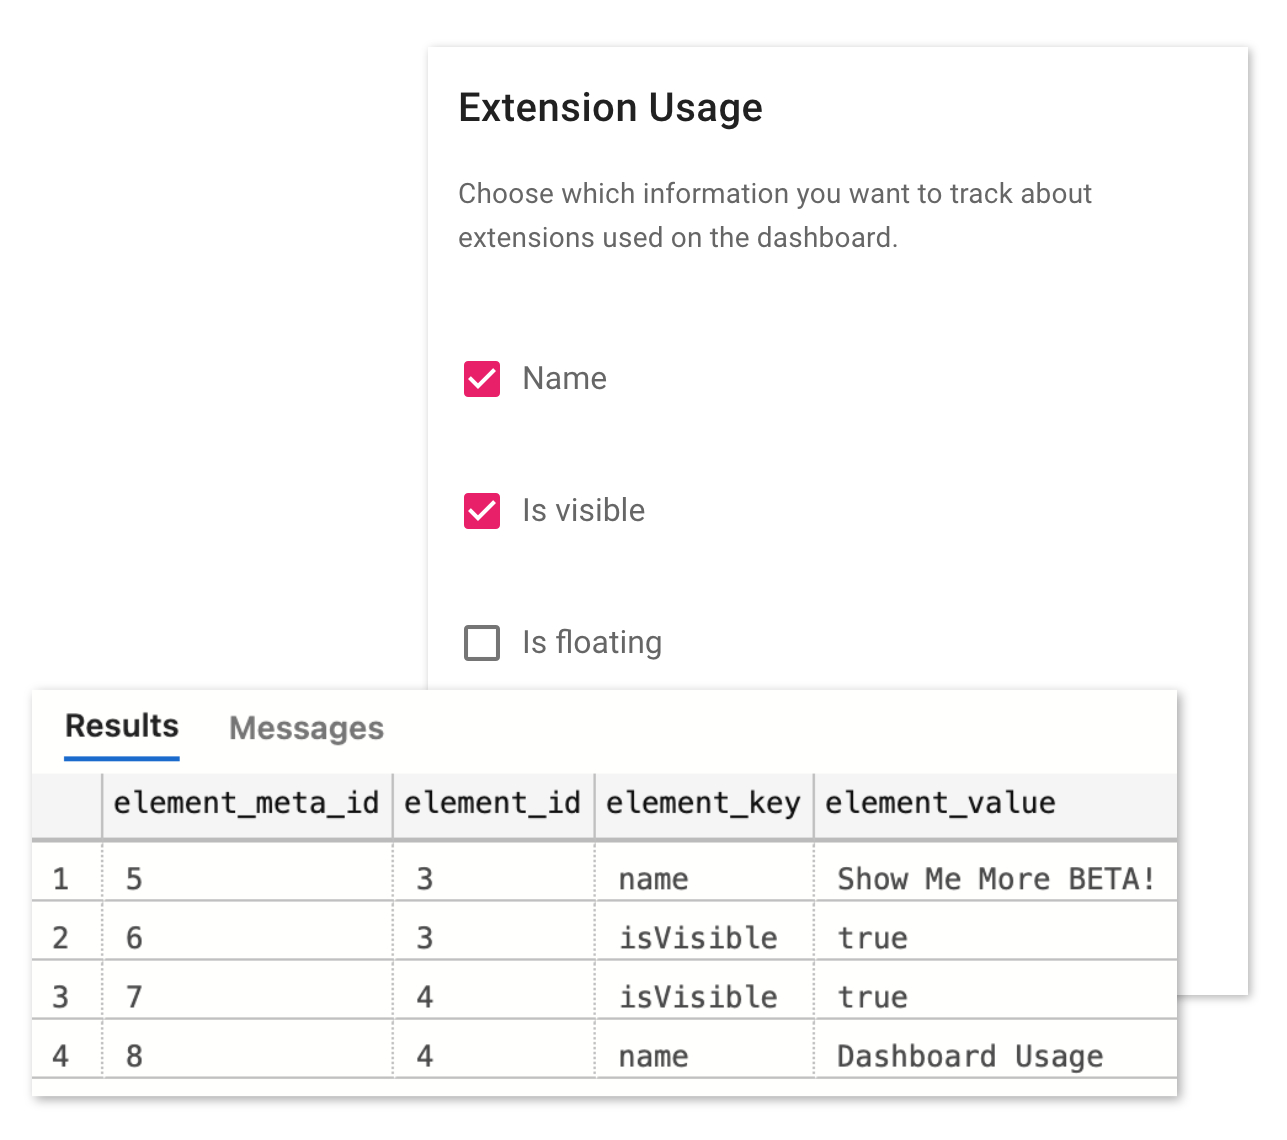
It is now possible to track which extensions are present on the dashboard. A possible use case for this is to see if the extensions you’ve purchased are actually present on any dashboard.

Super simple installation
Dashboard Usage 2.0 is on-premises only. The installation of the new extension is easier than ever, because there is close to no installation required. Everything you need is the .trex, the .env and the extension file. The entire extension is a single executable package for Windows or macOS. Simply fill out your database settings in the .env file and you’re all set.
How do I get it?
The new Dashboard Usage is now live on our website
Database support
Currently, the extension supports SQL Server. More database options will follow. Not familiar with SQL Server, but still want to use the new extension? Creating a local SQL Server is really easy. You can follow this macOS guide or this Windows guide.
We love to make extensions and help Tableau users to do things more efficiently. If you have feedback, ideas, questions or need support, please make sure to share it with us! Also, don’t forget to follow us on social media for our latest news and updates.