Empowering Law Enforcement:
The Dynamic Crime Management Dashboard
In the realm of law enforcement, the path to safety and security hinges on data-driven decisions and insights and having the right solutions can be the key to success.
Introducing our Police Department Analysis Dashboard, a powerful solution engineered to transform crime management, optimize resource allocation, and enhance community safety for law enforcement agencies
An In-Depth Use-Case Exploration.
Crime Pattern Analysis
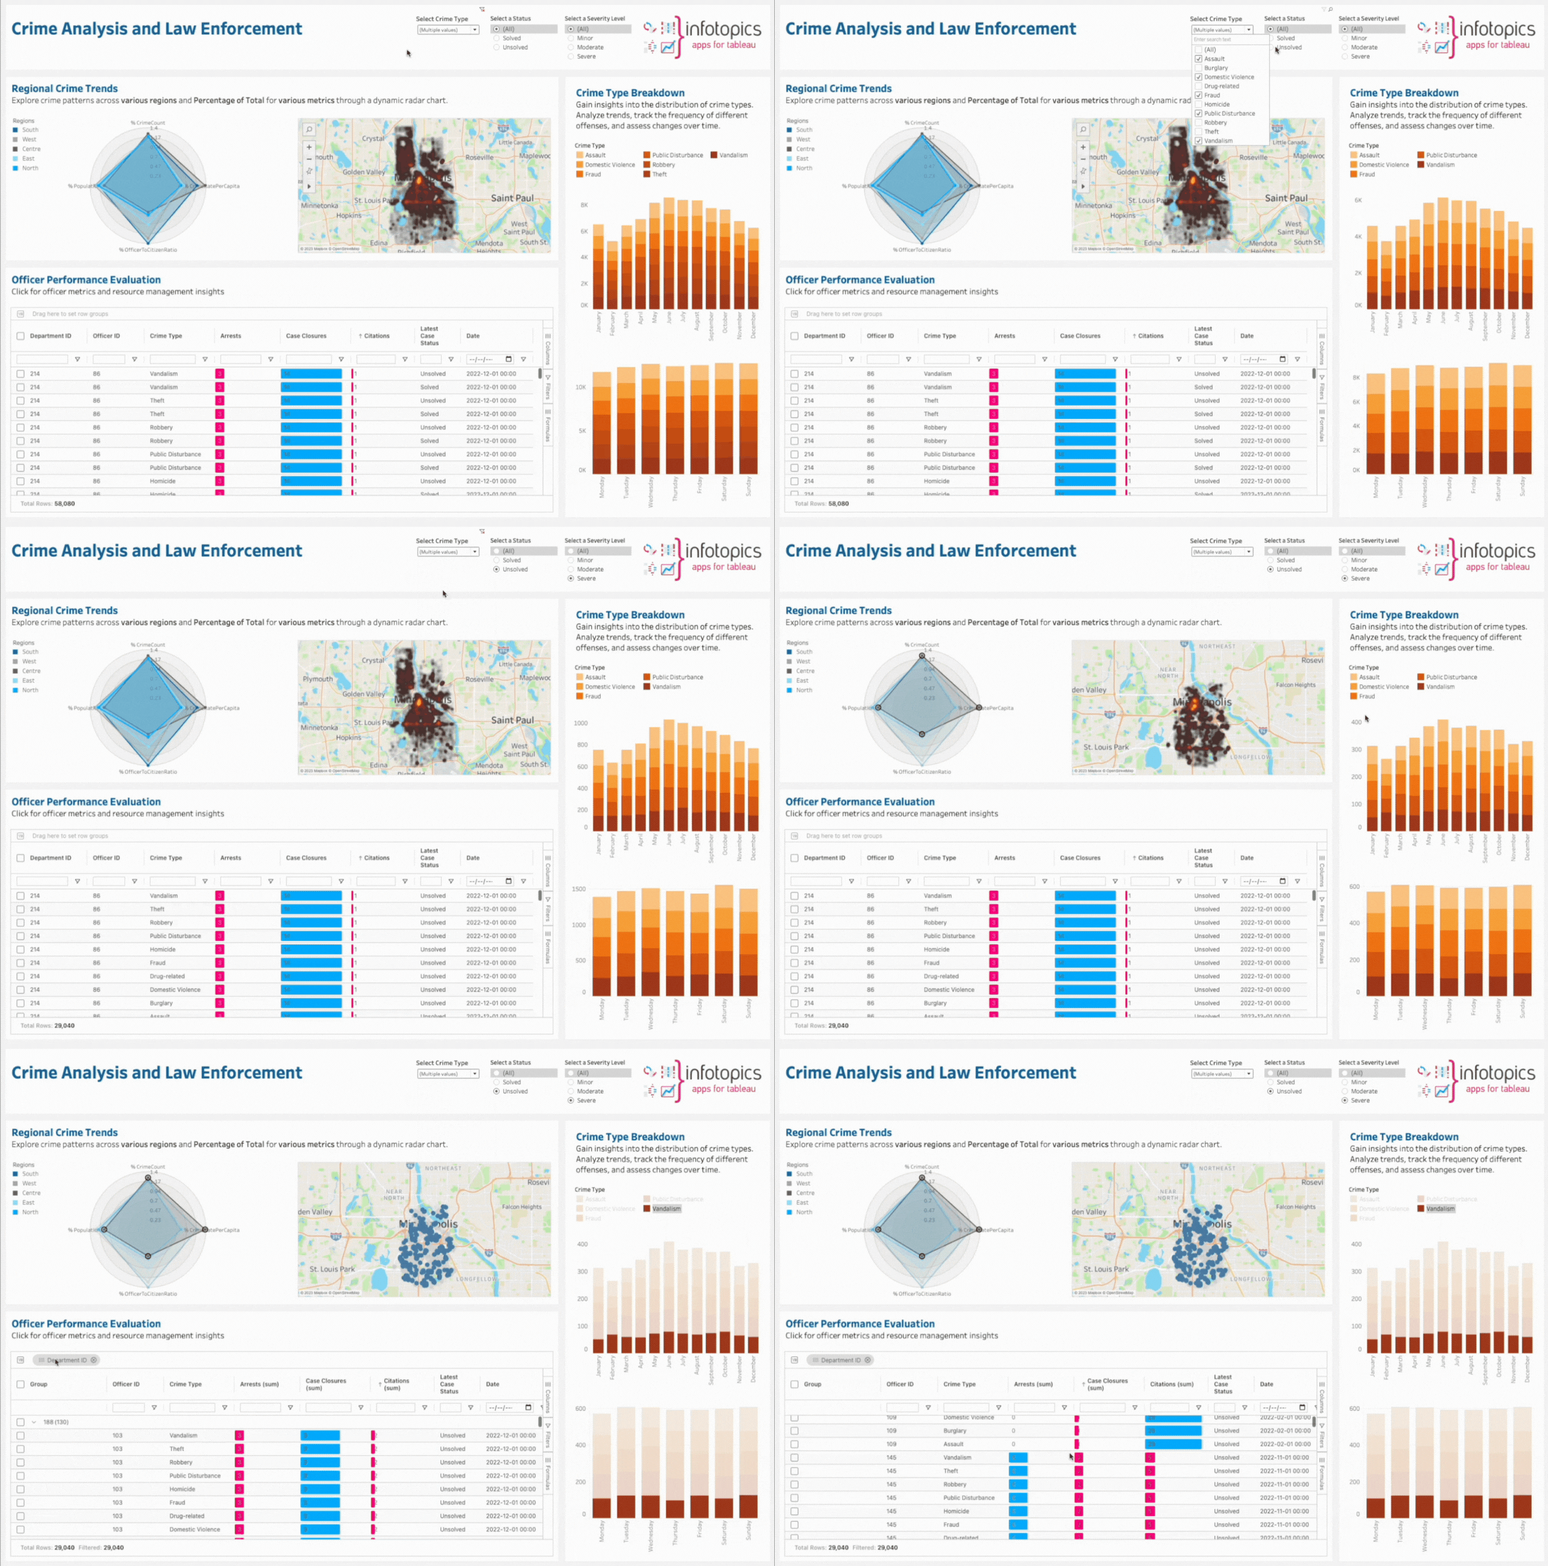
Understanding intricate crime patterns across regions is vital for proactive policing. Gain a Strategic Edge and Delve into intricate regional crime patterns for proactive policing with our dynamic radar chart and interactive map. These visualizations enable you to understand crime trends and their impact on different areas. The Percentage of Total metrics aids in resource allocation, enhancing your agency’s ability to address crime effectively.
Crime Type Analysis
Uncover Trends with Precision: Our stacked bar charts reveal the distribution of crime types, helping you analyze data based on months and days of the week. By tracking the frequency of various offenses, you can pinpoint emerging trends and make informed decisions to combat crime more effectively.

Officer Performance Analysis
Optimize Resources Strategically. The SuperTables Tableau extension empowers you to evaluate officer performance with granular detail. Tailor the column order and sorting to your specific needs, group the table by any dimension, and seamlessly incorporate customized bar charts within the table. This functionality enables your agency to allocate resources efficiently, ensuring officers are optimally deployed for community safety.
Resource Allocation Optimization
Our dashboard is a valuable solution for optimizing resource allocation in law enforcement. By providing insights into regional crime trends, officer performance, and crime type trends, it enables agencies to make data-driven decisions. This leads to the efficient deployment of officers to high-crime areas, enhances deterrence, and reduces response times, ultimately improving public safety. The dashboard’s interactive features allow for real-time adjustments based on changing circumstances, ensuring that resources are used where they are needed most effectively.
Community Engagement
Our Police Department Analysis Dashboard plays a crucial role in strengthening the bond between law enforcement and the community. By offering transparent insights into crime trends and resource allocation, it fosters trust and collaboration. Community members can actively engage in crime prevention efforts, while law enforcement can allocate resources more effectively to address community concerns. This tool promotes open dialogue, cooperation, and ultimately, safer neighborhoods.
