Raise your game by Drilling Down
A dashboard is designed to take the user as close to an action that improves your organization’s performance. The deeper you dig into the data, the more questions you will find. These questions enable you to look at the information and analyze it from different points of view. Drilling down allows users to explore specific information in a dashboard from different angles by shifting from an overview of data to a more detailed picture using the same dataset.
The different ways we can Drill Down in Tableau
Tableau Coach Steve Adams from Visual DJ, a valued partner of Apps for Tableau, presented multiple ways to Drill Down in the Tableau Analytics TUG.
Improving self-service for your end-users
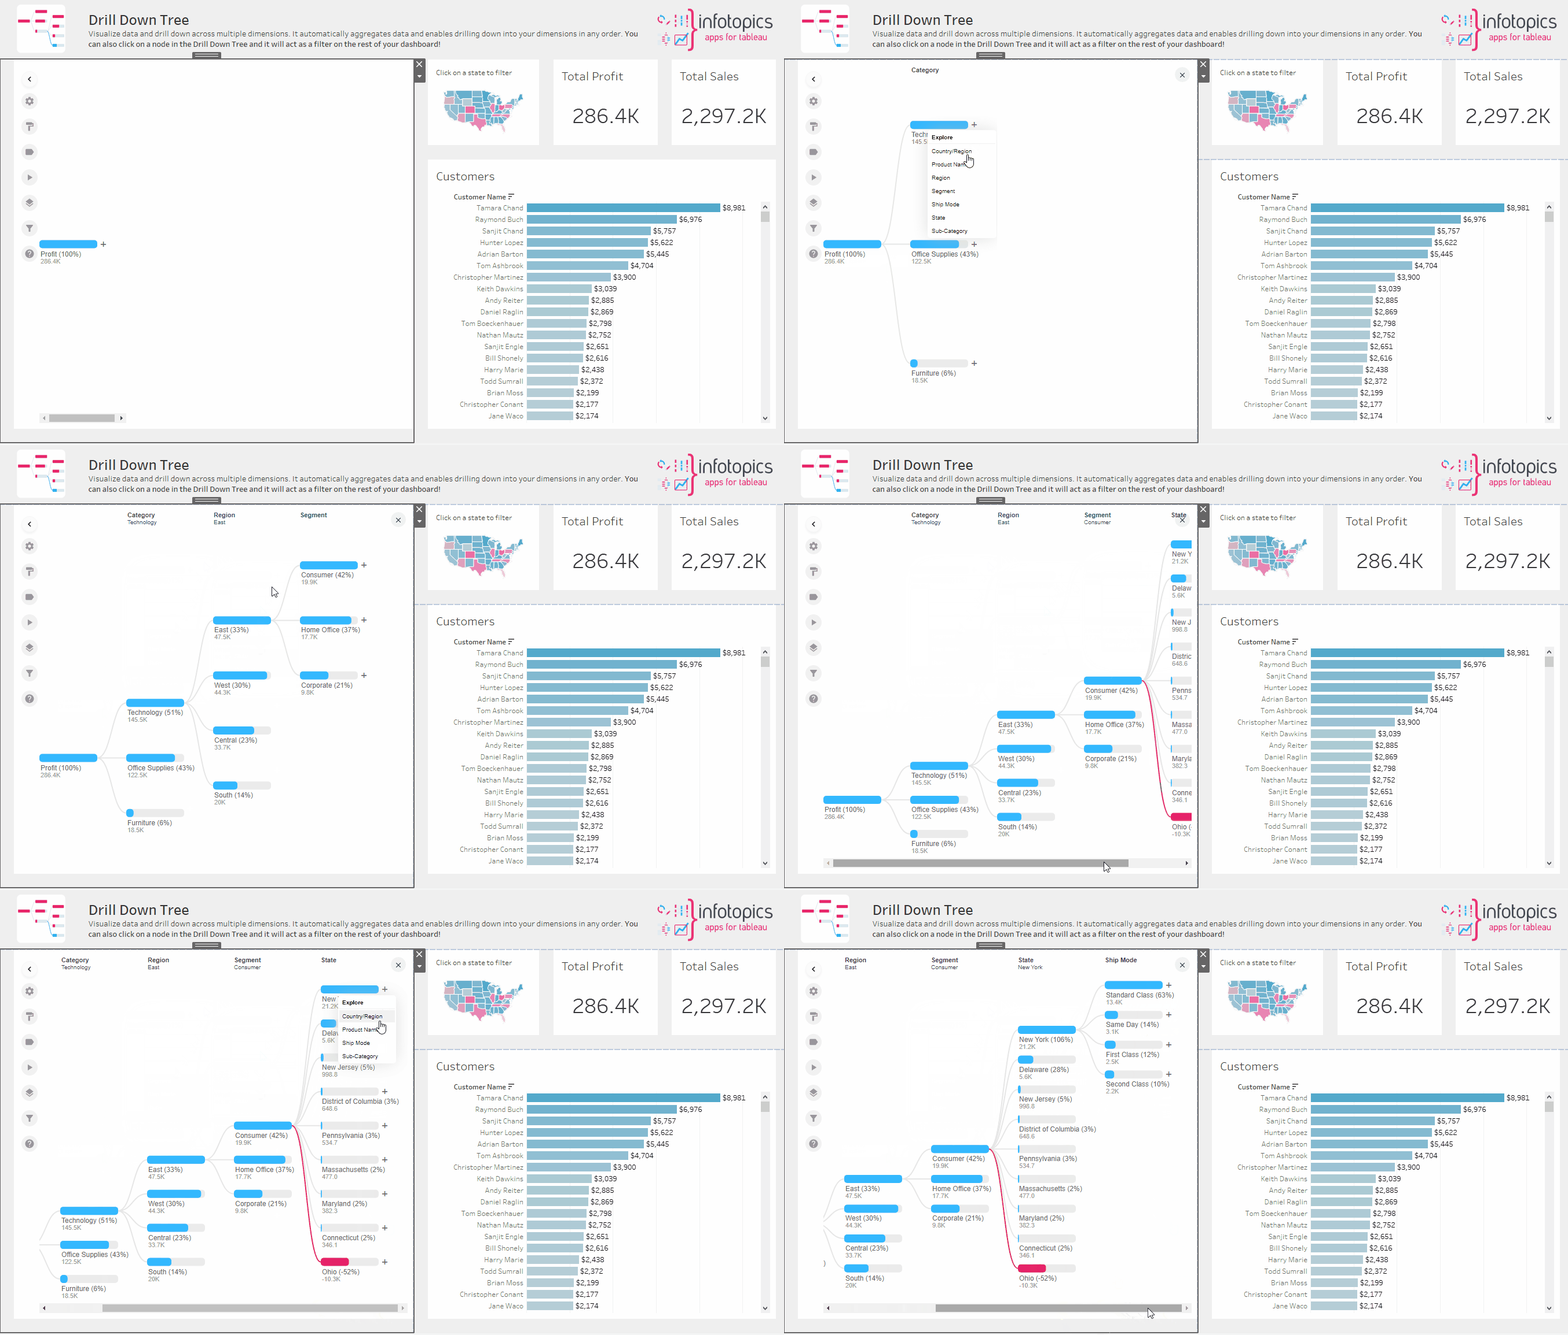
Another way to Drill Down in Tableau is to use the DrillDownTree Extension. The power of the DrillDownTree Extension is that it opens up many drill-through paths for your end user to choose based upon the answers that are provided, with minimal development time for the dashboard builder.
A good use case for using the DrillDownTree is ad hoc and root-cause analysis. In this case, you want to transfer from the bigger picture to a lower level to pinpoint your issue’s root cause. The Extension shows a Tree Map where you can Drill Down on a measure and drill it down on any dimension. As a result of this Tree Map, you can ask relevant questions such as ‘Why is my sales not working out in X area?’. Get to the cause of these questions, analyze what caused it, and follow up!


We love to make solutions and help Tableau users to do things more efficiently. If you have feedback, ideas, questions or need support, please share them with us! Also, don’t forget to follow us on social media for our latest news and updates.