
How to drill down in a Sankey Diagram
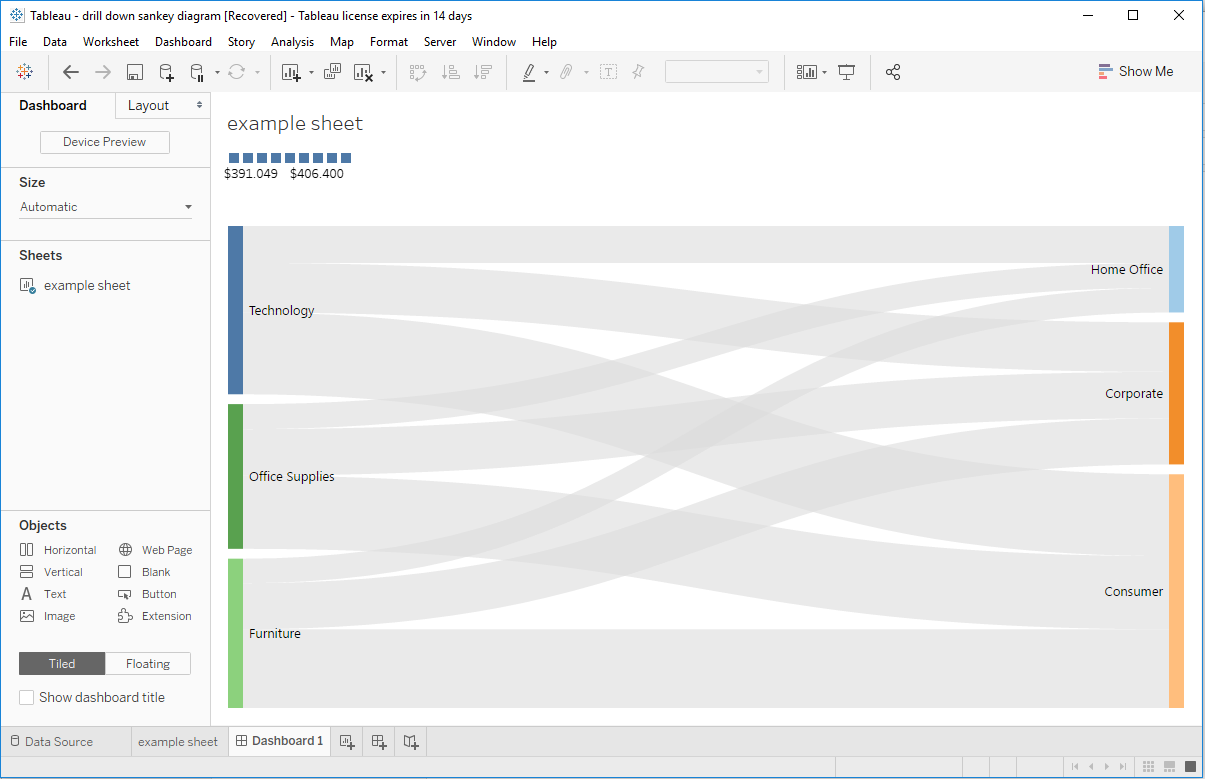
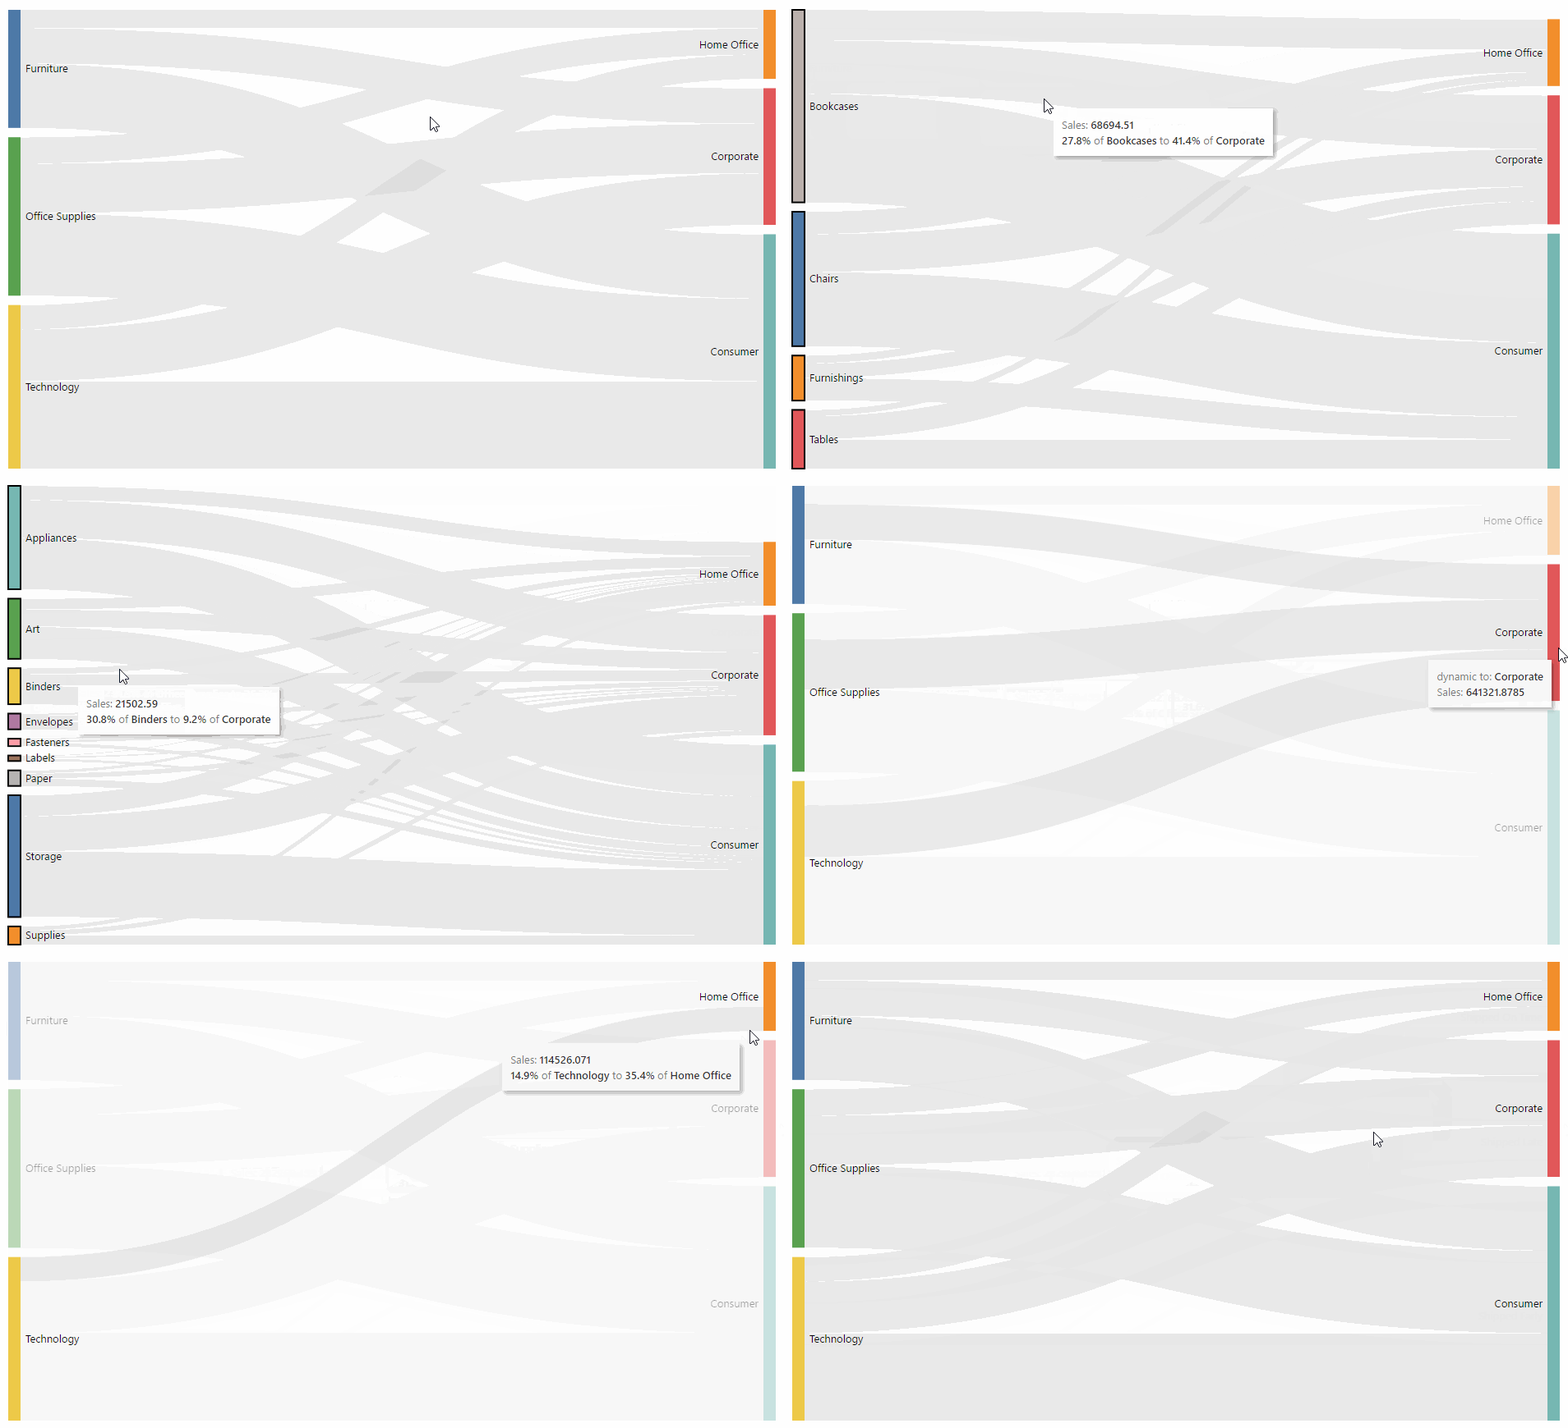
We often get the question if it is possible to drill down in a ShowMeMore visualization. This is possible with the new ‘Use as Filter on‘ option for Sankey Diagrams and Organization Charts. With this feature, you can click on marks in the ShowMeMore visualizations the same way you are used to as in an Tableau Dashboard. You can also use this feature to do a drill down in your Sankey Diagram shown on the right.
You will need ShowMeMore Create, Share or Enterprise to use this feature.
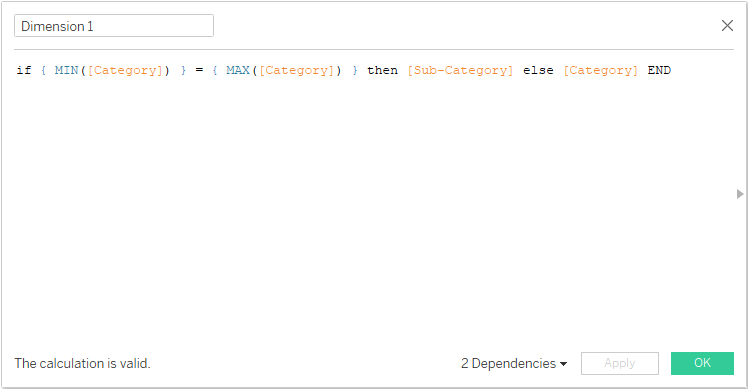
Tableau Calculations and Filters
You need a datasheet with 2 calculations and 2 context filters. This will do 90% of the magic for you, the other 10% is done in the extension. This example is built with the SuperStore dataset and can be used with any dataset.
Create the following calculations:
[Dimension 1]: if { MIN([Category]) } = { MAX([Category]) } then [Sub-Category] else [Category] END [Dimension 2]: if { MIN([Segment]) } = { MAX([Segment]) } then [Ship Status] else [Segment] END
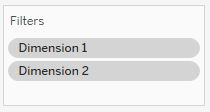
Add them to the Filter Shelf and add to context:
Create the Tableau Data Sheet
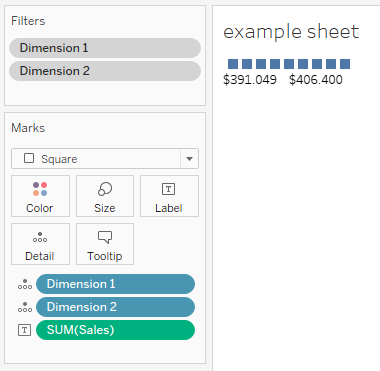
Ccreate the datasheet and add it to your dashboard with the extension. Your Data Sheet will look like this:
Configure Sankey Diagram
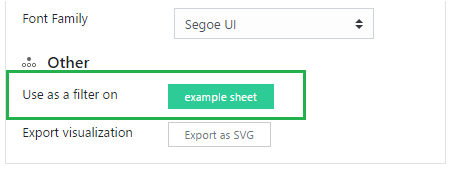
The only thing remaining is to configure the ‘Use as a filter on‘ feature in the Sankey Diagram.
Open your Sankey Diagram configuration and scroll down to Other settings, make sure you select your data sheet as a sheet you want to filter when clicking on a mark.
We love to make solutions and help Tableau users to do things more efficiently. If you have feedback, ideas, questions or need support, please make sure to share it with us! Also, don’t forget to follow us on social media for our latest news and updates.