Building a Data Community with PictureThis
Karina Korpela – Head of data analytics and visualization at Invesco
When Karina was hired as head of data analytics and visualization, there were already colleagues within other departments making their own reports. She wanted to stimulate them to keep analyzing their own data and using their own reports. The data analytics and visualization team focus on the more complex analytical projects, enabling and curating data. This way, she wanted to encourage others to use data within the company themselves and do their own basic reporting.
They started a data community for the people who were already making their own reports and ad-hoc analysis. These people became the data artisans of Invesco, and they were looking for one place where reports could be shared, and people could see who was working on what. They could make the community bigger. Next to that, Invesco uses several visualizations and analysis tools, like Tableau, PowerBI, Adobe etc., and she wanted to create a repository in one place, where reports within these tools were visual.
Although she had a clear vision of what was needed to build a repository and a community, she couldn’t find a solution or tool for this. They explored the option of building it themselves but didn’t have the resources to do this in a proper way. Via a Google search, they stumbled upon Apps for Tableau and the extension PictureThis. They started a trial and discovered that the PictureThis extension provided them with the solution to build a visual repository. They could easily add meta-data and link the artisan behind the reports in one place.

Invesco is an independent investment management firm dedicated to delivering an investment experience that helps people get more out of life. They believe the best investment insights come from specialized investment teams with discrete investment perspectives, operating under a disciplined philosophy and process with strong risk oversight. Their pure focus on investment management eliminates the distractions that compromise results.
New functionalities and a fast implementation
On the 9th of December 2019, the Apps for Tableau Team received an e-mail from Invesco, briefly explaining their use case and with one simple question: “It would be great, if possible, to add a URL action on this picture. If I am correct, this is currently not possible as right now clicking on the picture only lets you filter other sheets?”
The extension didn’t allow them to click on the picture and open up the displayed workbook. This was essential for the team, as it eliminated the need to send links to everyone who needed to know about the reports.
Luckily, this problem didn’t last very long. Within two days, the Apps for Tableau team included the URL action as functionality into the Picture This extension. Simply because they also saw the value of this functionality for their customers.
As Siebe Grijpma from Apps for Tableau explains: “We need the creativity and use cases of our customers. We don’t just follow our own strategy, but make things work with the input of our customers.”
Karina also remembers the interaction with the Apps for Tableau team as being prompt and helpful. The challenges and issues that arose during the implementation largely had to do with connecting all the different tools and their own knowledge level.
Creating the Greenhouse
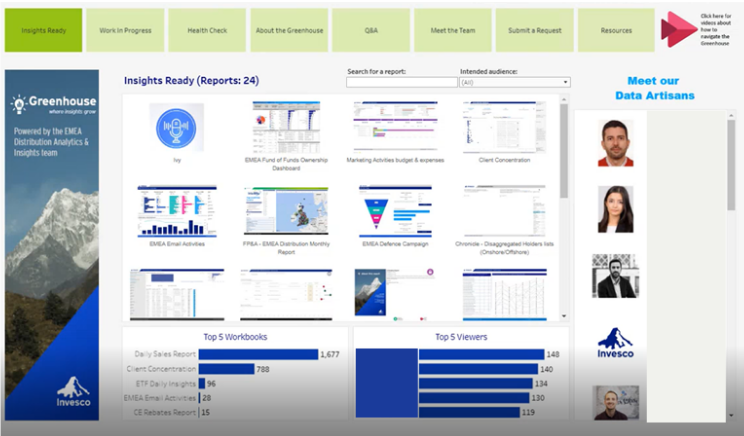
The solution they eventually built is called the Greenhouse. It is a landing page in which all the reports within the company are displayed. There is a distinction between the Insights Ready reports and Work in Progress ones, so people know which reports are ready to use, curated and checked and what reports people are working on at the moment.
The landing page shows the dashboards, metadata and its owner. This information prevents people from re-work or building something themselves that can already be found in a particular dashboard. It also makes it easier to navigate the various reports available and find the information you are looking for. Next to that, it sparks the curiosity of people.
“It is called the Green House because I believe that data is not the new oil. Because for me it says that data is a commodity that we need to protect. I prefer to believe that data is the new soil. Democratize data, let people play with it, let people plant their ideas and let see what grows.” – Karina Korpela
The analogy is used throughout the platform. Everything on the Work in Progress page is, for example, green, like a fruit in the Greenhouse, so it is ready for growth but not ripe yet.
In order to use the Greenhouse, you need to go through an onboarding process. The team essentially sits down with the business’s artisans and teaches them how to make an about page for their report and share this in the correct way in Sharepoint. The usage of the platform is pretty straightforward. If your report doesn’t have an About page, it will not pop up in the Greenhouse.
The real fruits of the extension
Right now, the Greenhouse is helping to build the community within Invesco. It increases data literacy within the company, and people can get more out of the data because it is visible within the organization.
Things like adding a top 5 of reports and users are implemented to spark the conversation about data. It shows who is using the reports a lot and what makes people curious about reports they otherwise never would have clicked on.
Sharing reports and data in this way makes it more efficient to work with the data within the organization. People know where to look for information. Most reports are visible to everyone. There are, of course, a few reports that aren’t visible for everyone because they contain sensitive information. The about pages of these reports are visible, but people cannot click on them if they don’t have access. Overall the Picture This extension allows Invesco to build that community and create a complete repository within the company.
The future step within Invesco? Make people more aware of its existence and explore more options with the Apps for Tableau extensions. Because there undoubtedly are many more use cases to work on in the future. Check it out here!
