Better Product Visualizations and Self-service Tableau Tables with PictureThis & SuperTables
Being a retail company with a vast number of products, Carter’s require good visuals when doing their data analytics. Thanks to the PictureThis Tableau extension, the teams can view pictures of their products next to the data and gain valuable insights. Furthermore, SuperTables enables users to pivot the data in their Tableau tables and quickly get insights thanks to its self-service functionality.
Carter’s
Carter’s, Inc. is the largest branded marketer in the United States and Canada of apparel and related products exclusively for babies and young children. The Company owns the Carter’s and OshKosh B’gosh brands, two of the most recognized brands in the marketplace. These brands are sold in leading department stores, national chains, and specialty retailers domestically and internationally.
Visualize products next to the data with PictureThis
Prior to PictureThis, Carter’s used a URL action to show images of its products alongside the data. However, viewing these images was a big challenge, as users had to click on the link to view the image and repeat this action for each URL. It was difficult and time-consuming to get quick visual insights in this way.
PictureThis enables Carter’s to manage their inventory and merchandising by having real-time insights into the best-performing styles, which products are not performing that well, etc. For instance, one of their dashboards identifies their top-performing styles, allowing users to see what these products actually look like and understand their performance for a specific period. Having these images embedded with the data gives the business users the right information at the right time to make important decisions quickly.

Flexibility & Self-service of SuperTables
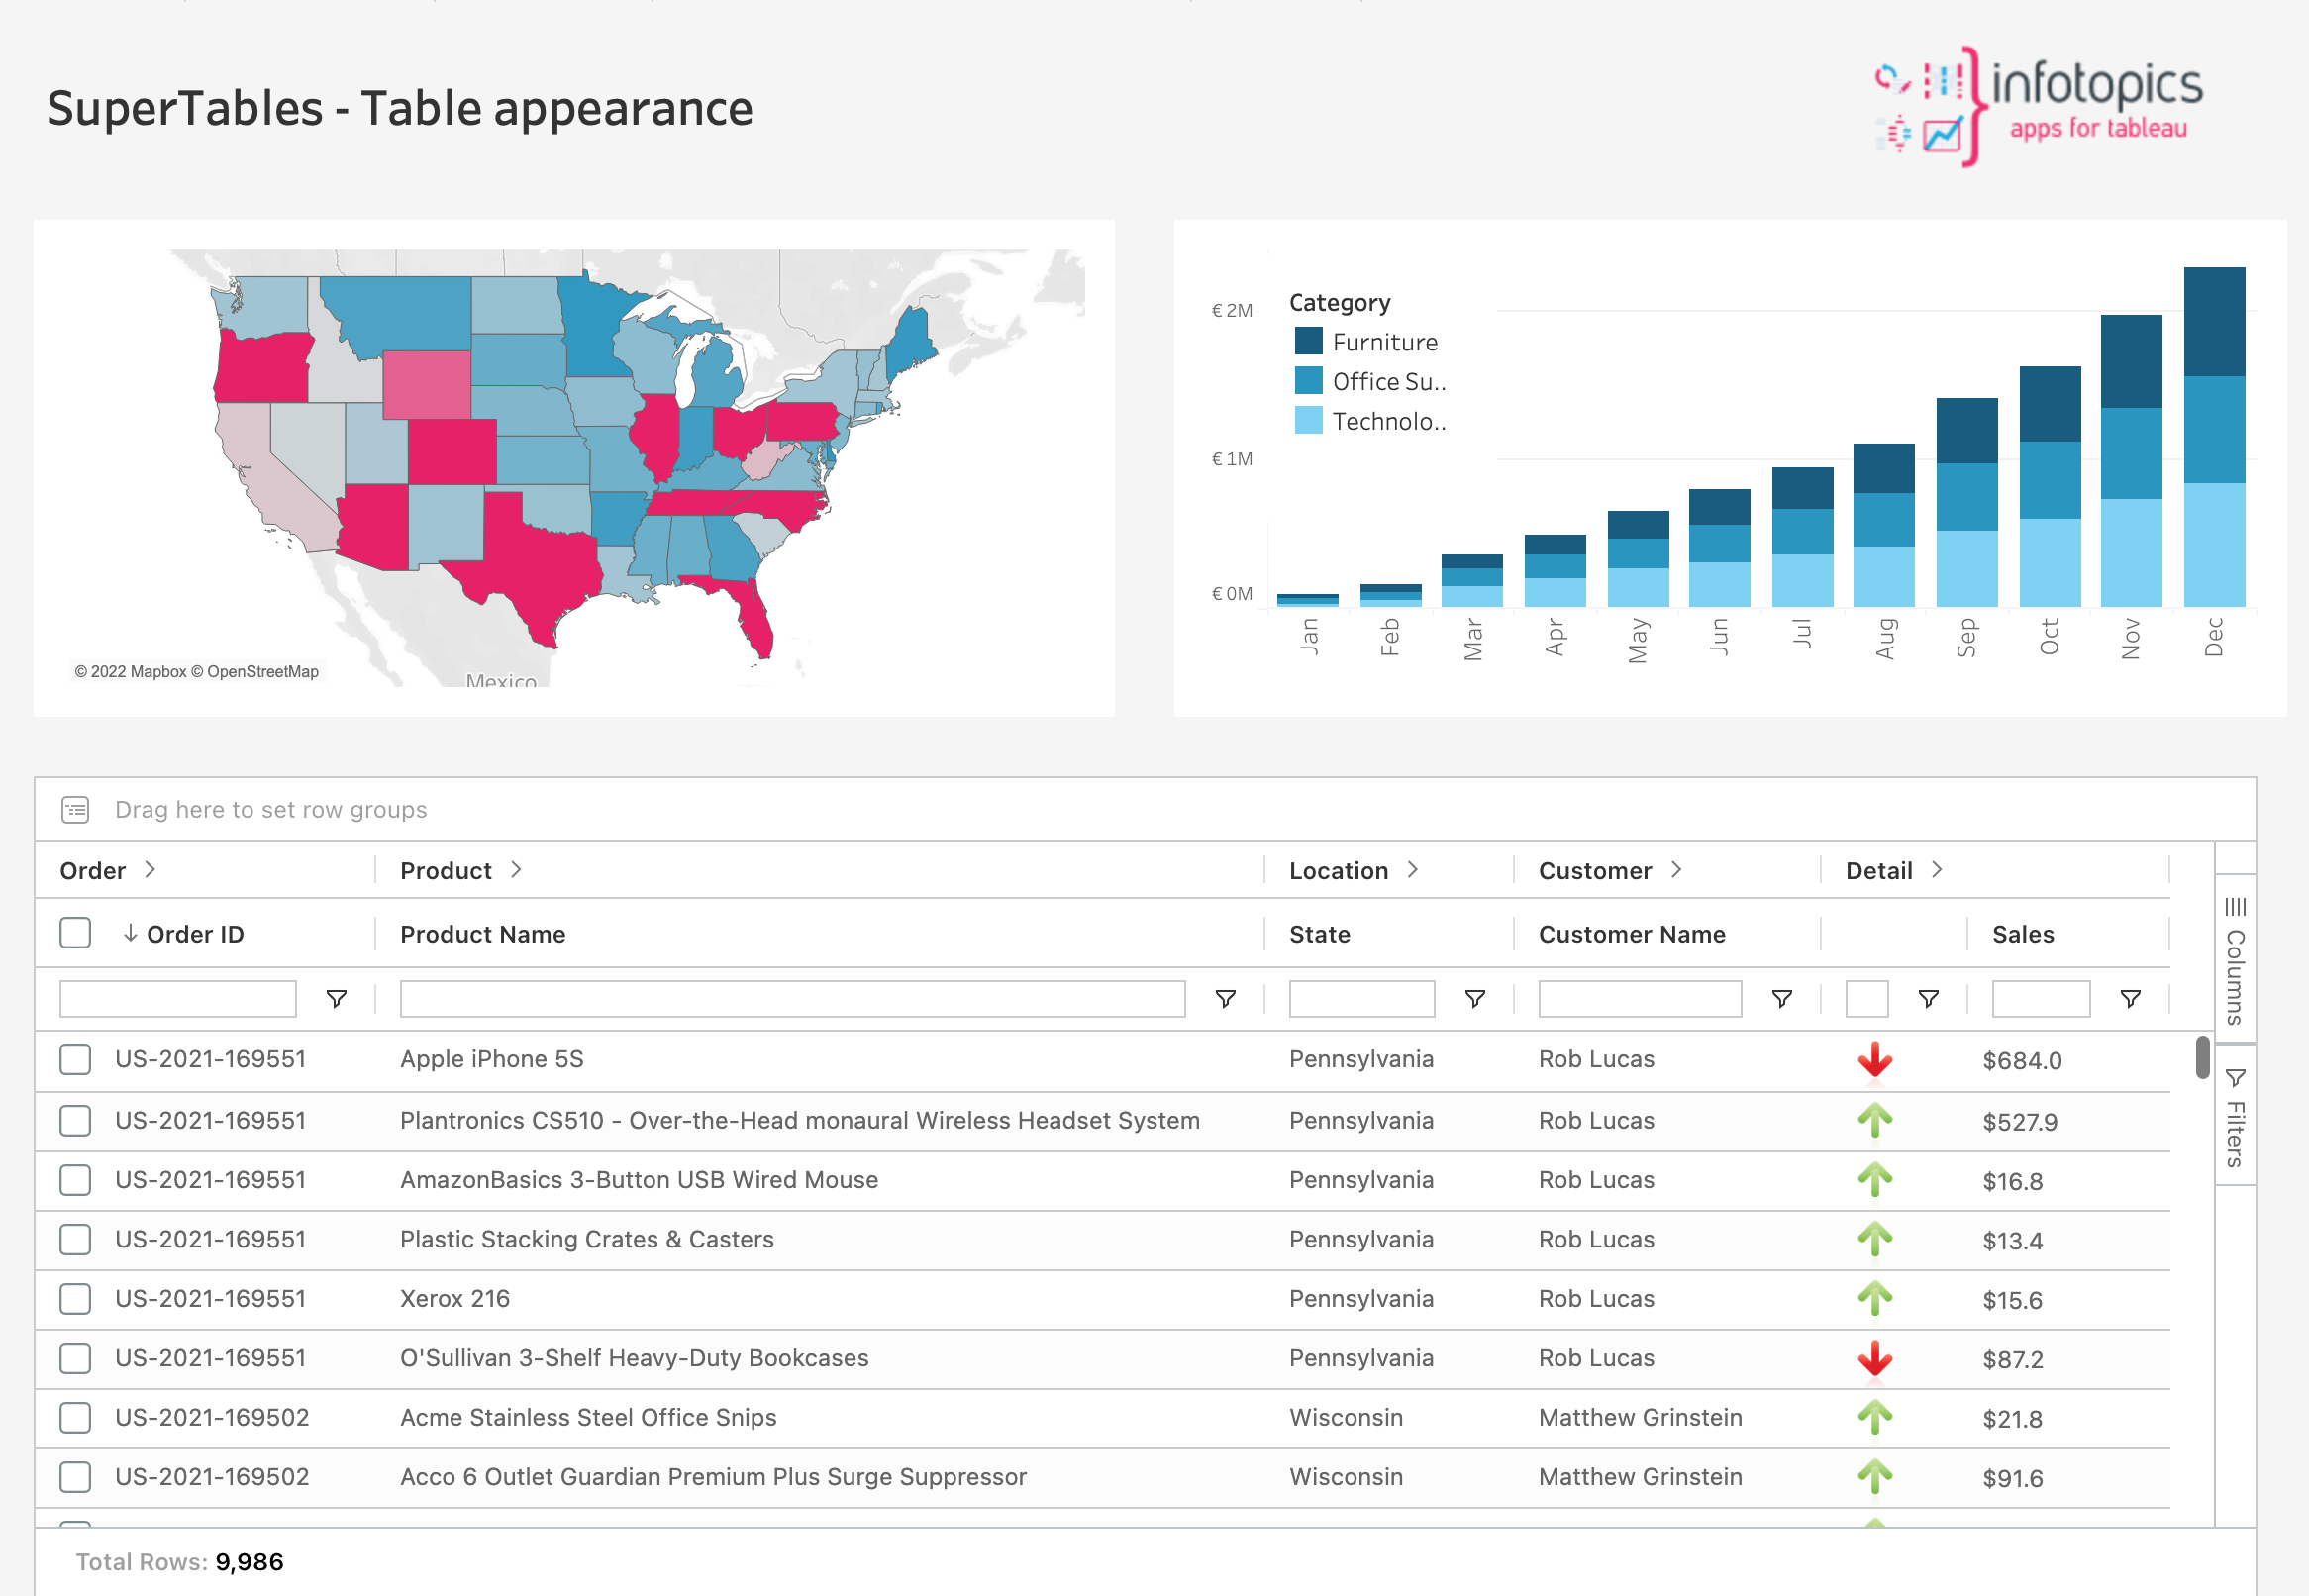
Apart from PictureThis, Carter’s is also using SuperTables. Before the extension, the development team was really restricted in the way they could build tables in Tableau. They were limited in the sizing, the number of rows and columns, and most importantly, the flexibility of the tables. In the end, however the developer built the table, and that’s how the user received the data.
SuperTables was the tool that gave the flexibility to manage the tables and see them the way the user needed to. With the personalized views, every user can pivot around the data and get the information they need. The extension’s flexibility and self-service drive a lot of the decision-making and, most importantly, save time.

*Example of SuperTables dashboard
“Now, users don’t have to go back to either the BI or my team and ask us to build specific tables for their needs. They have the flexibility to do it themselves with SuperTables.”
– Selma Dogic, Data & Analytics at Carter’s

Summary
Overall, both extensions contribute to the data analytics of Carter’s by offering flexibility, saving time, providing valuable insights to the business users, and facilitating their decision-making. Using extensions is governed, secure, and supports companies’ workflow in Tableau!
Curious to experience it yourself? Request your free trial now!
