Easily create and share stories with ScrollyTelling and MailScheduler
Atefeh Hezavehei works as a Tableau & Alteryx consultant at The Information Lab Spain. While preparing a dashboard for a customer, Atefeh was introduced to the ScrollyTelling Tableau extension, which enabled her to create blog-like dashboards with interactive Tableau visualizations and informational text alongside them!
The Information Lab Spain
The Information Lab helps as many people and companies as possible to make sense of their data. Through their partnerships with Tableau, Alteryx, Snowflake & AWS, they have become a leader in software sales and data analytics consulting services. The Information Lab operates in 8 countries across Europe.
Road Trip Data Stories
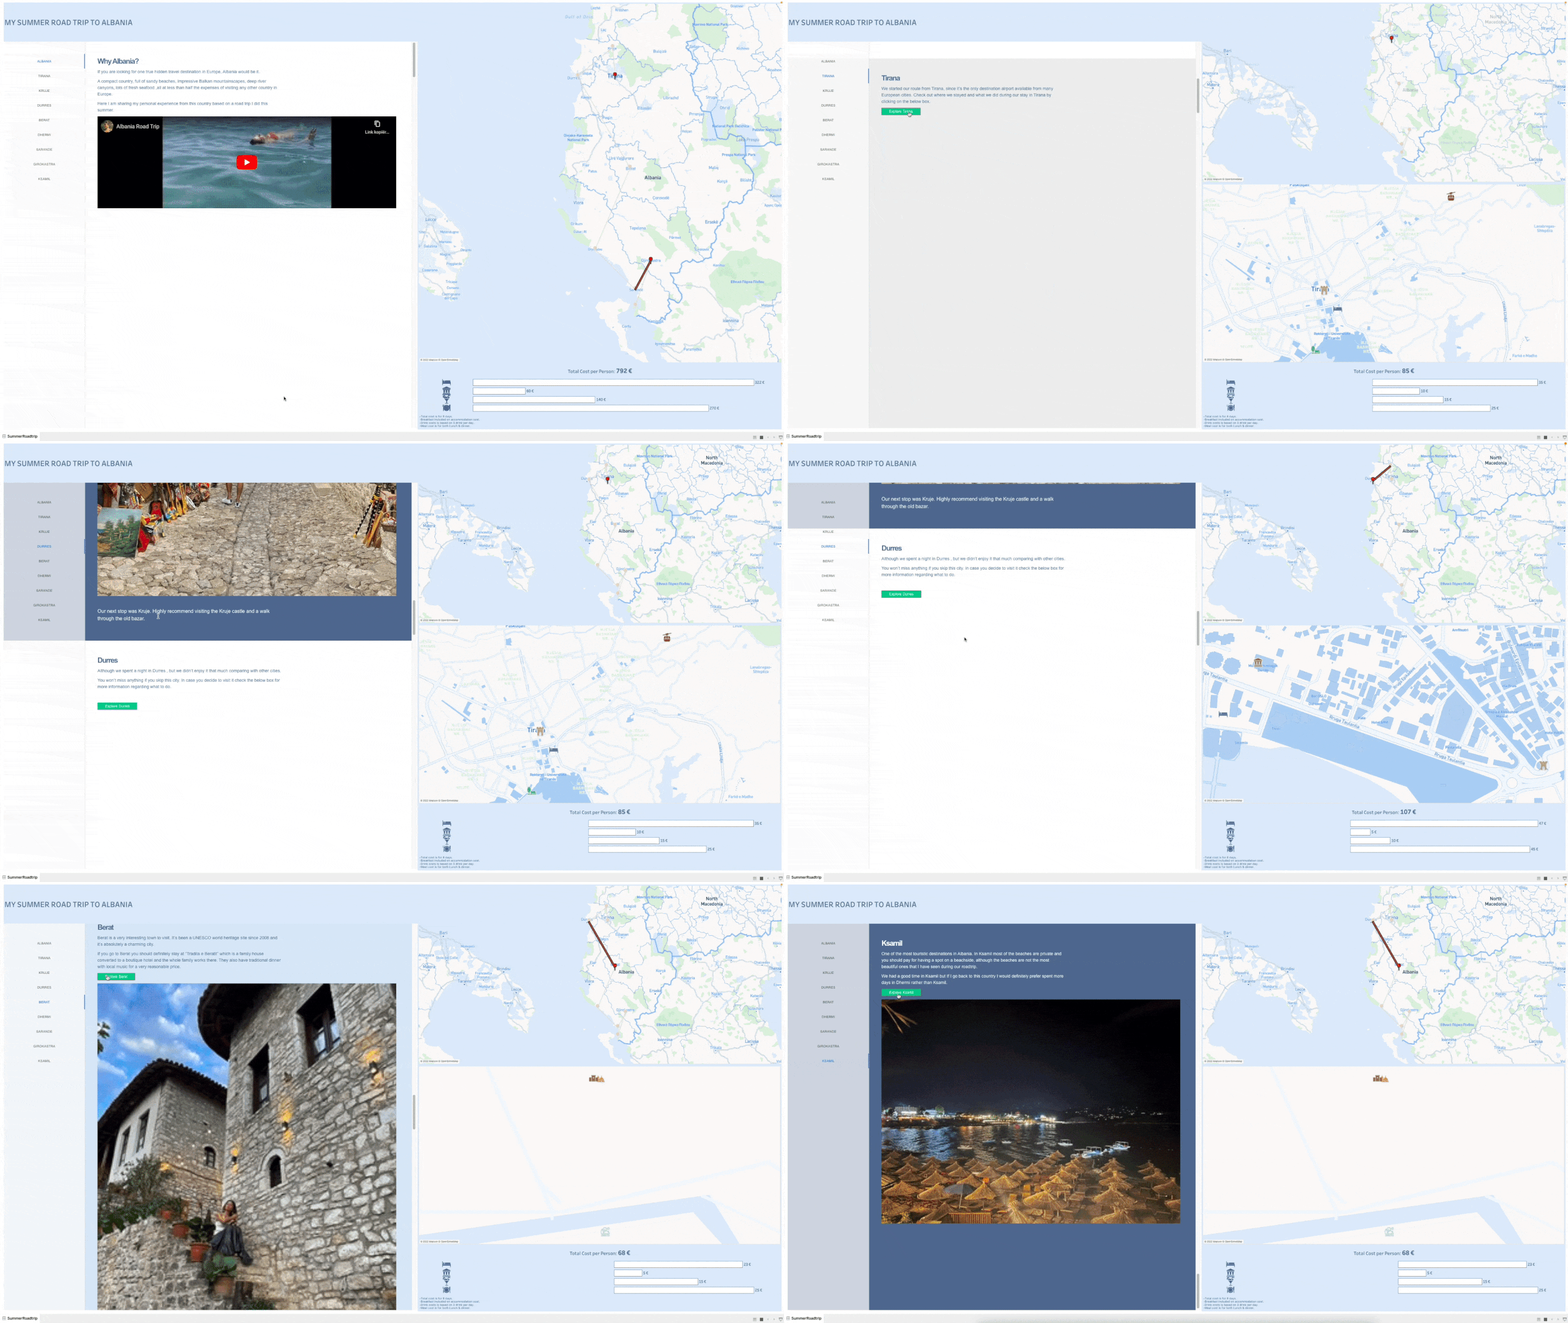
During the summer, Atefeh went on a road trip around Albania, where she visited 8 different cities and experienced various activities in each of them. Upon her return, she wanted to create an interactive Tableau dashboard with all the information about her trip. Initially, her idea was to create a map and graphs with Tableau and to place text alongside them. However, the text was too long, and the dashboard looked messy.
Fortunately, ScrollyTelling is a handy solution for that! In her dashboard, Atefeh included a map of the cities she visited, graphs with all expenses and short blogs about each city. First, she used Tableau to create the map and the graphs. Then, she used ScrollyTelling to add the blogs’ text to the dashboard and through the extension’s interactivity options, she could connect it to the visuals. The result was a truly interactive and informational dashboard that viewers can scroll through and navigate through her summer journey!

ScrollyTelling & MailScheduler Professional use case
Aside from creating personal dashboards, ScrollyTelling is also widely applicable to business-related dashboards. Currently, Atefeh is working on a case which combines ScrollyTelling and another premium Tableau application – MailScheduler. Through ScrollyTelling, the company can easily and quickly create their daily stories, and with MailScheduler, they can schedule to send these daily reports to stakeholders. Consequently, these stakeholders can view the information without being a Tableau user!
“I really enjoyed using ScrollyTelling, integrating it in Tableau and giving another look to the traditional dashboard!”
– Atefeh Hezavehei, Tableau & Alteryx consultant at The Information Lab Spain


*Example of ScrollyTelling Dashboard
A smooth experience
After doing the first two sections of her dashboard, Atefeh defined her experience with ScrollyTelling as really smooth. The extension enabled her to create blog-like content with interactive Tableau visualizations. Now, the users of her dashboard can easily navigate through the information and get the insights they need in a great way!
Do you want to try ScrollyTelling?