ScrollyTelling
Value-adding features
Data Journalism
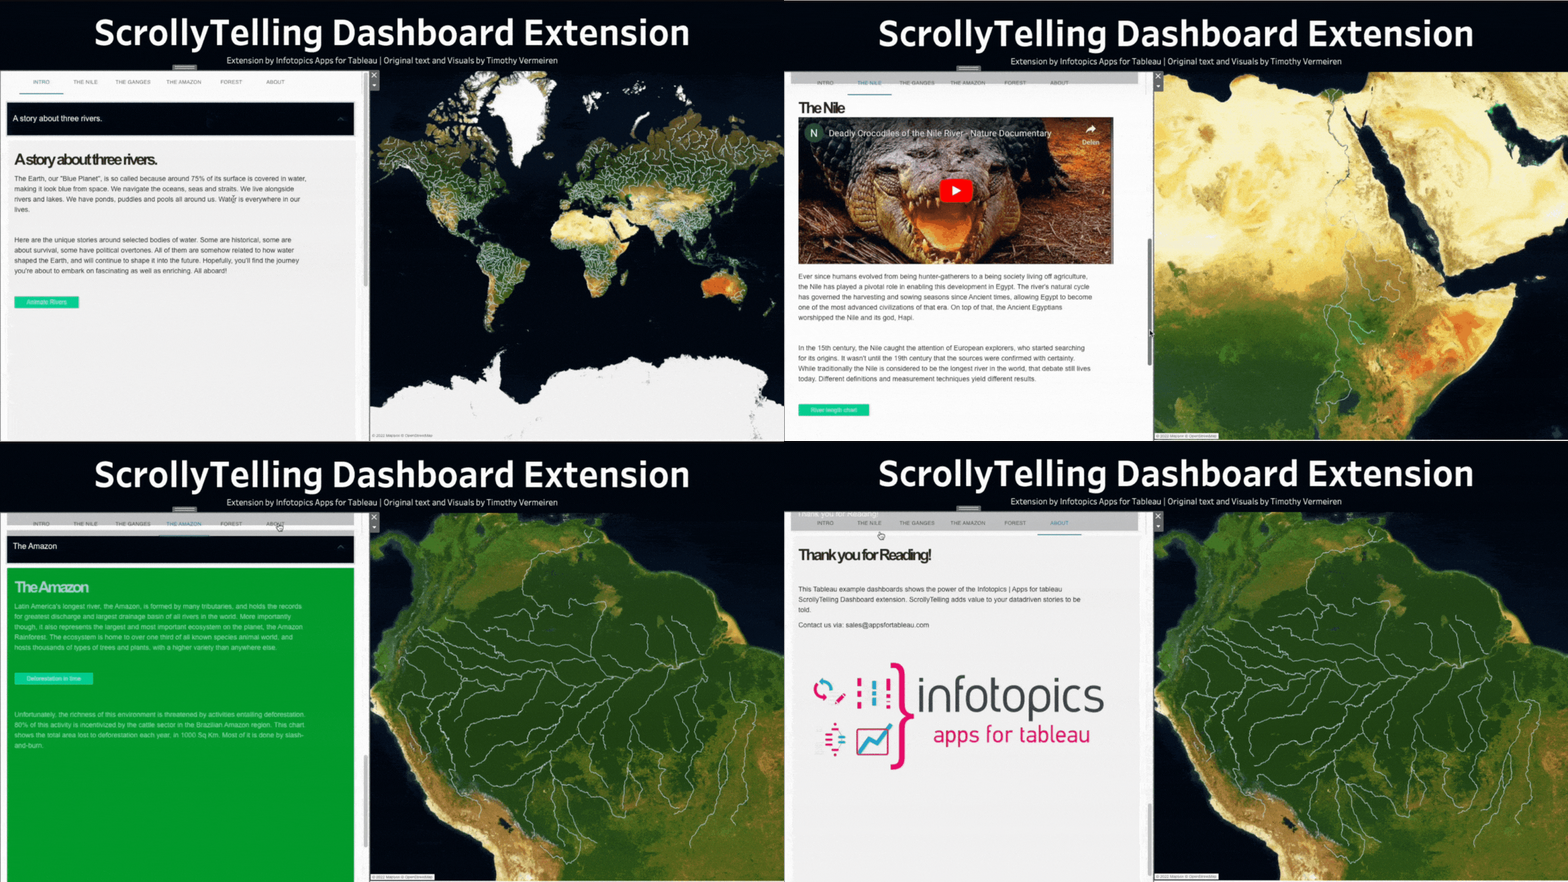
ScrollyTelling can assist you in creating a story with your data and presenting it to your colleagues. In this way, non-Tableau users can easily gain insights from the data thanks to interacting with the images, videos, and animations on your dashboard.
Filters, Highlights, Parameters & Animated Visuals
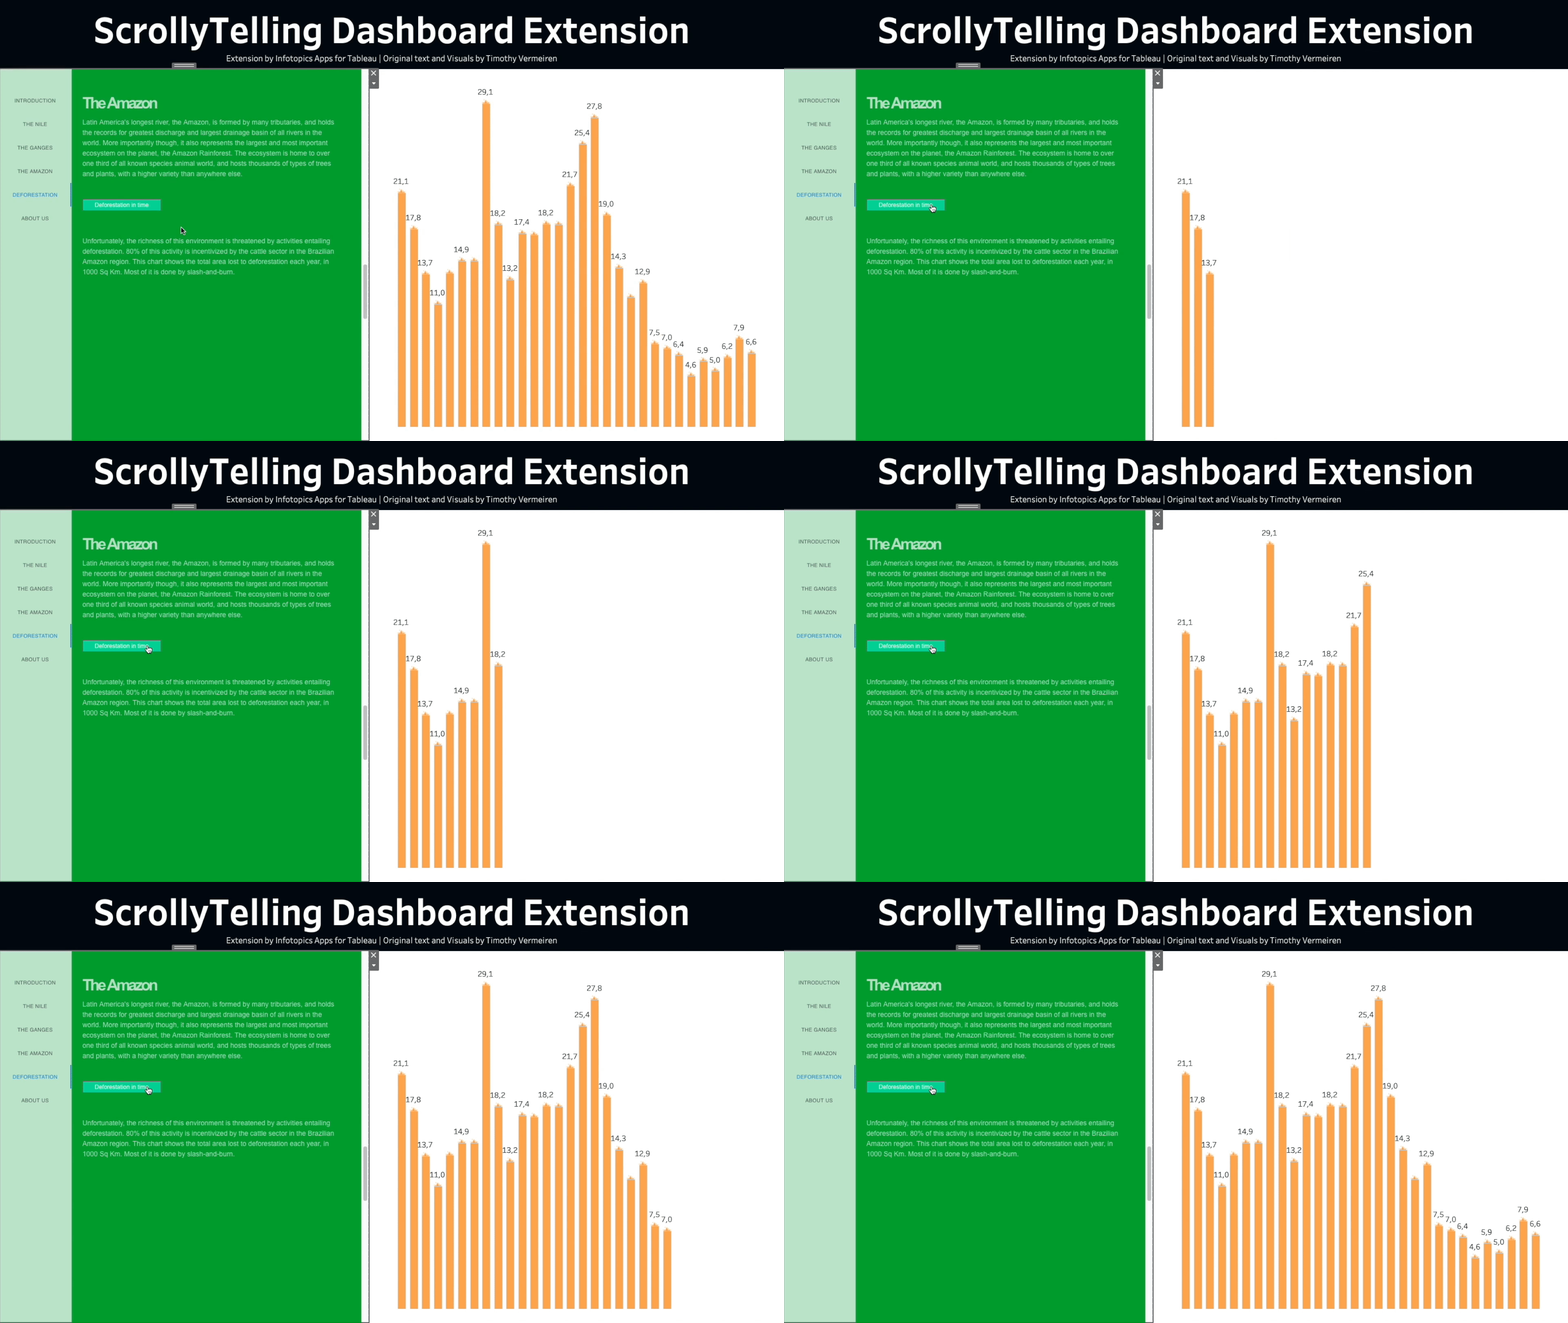
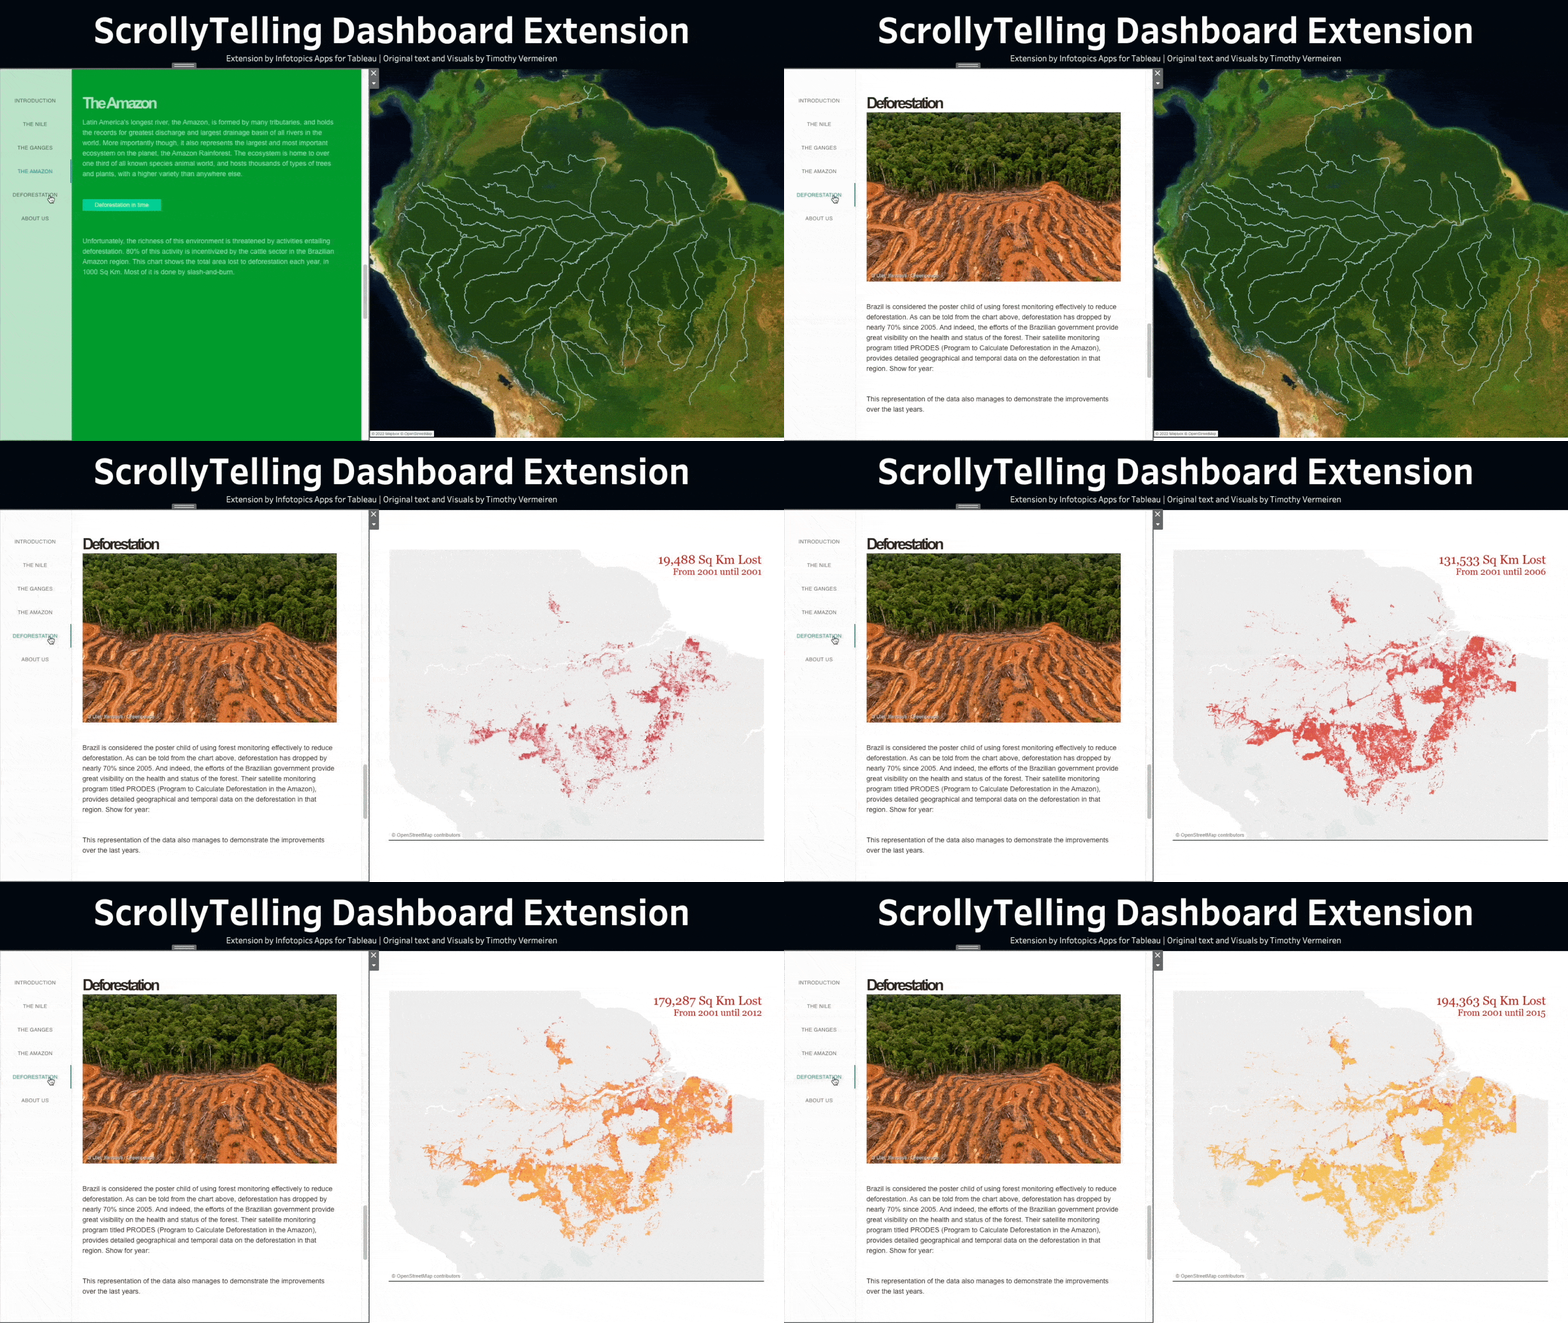
Filter your story on a particular data point you wish to focus on, some outliers may need investigating in more detail. Bring your story to life by animating the data within your story! Animate changes over a period to really visualize the changes.
Navigation Options and Story Sections
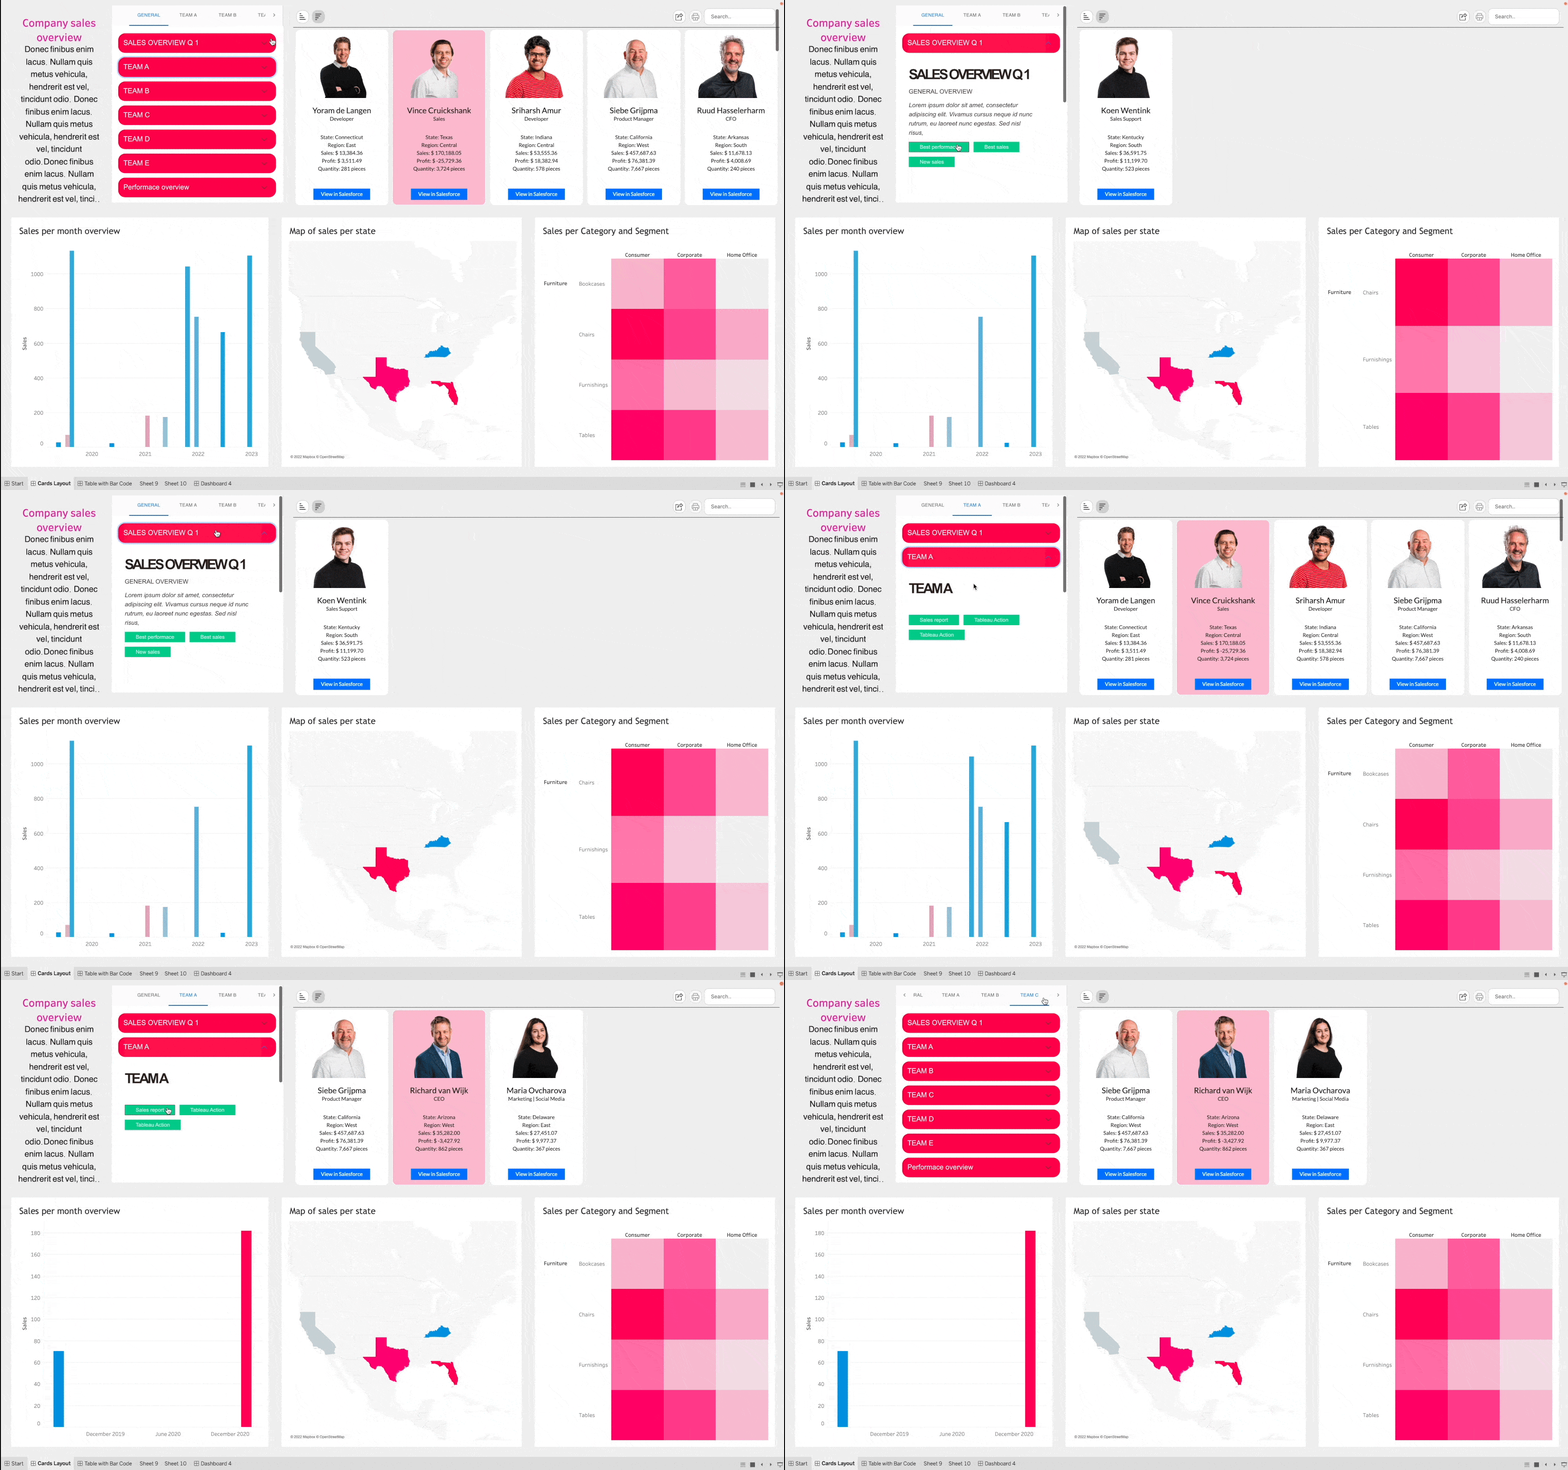
Use tabs to navigate through your story in a single click. Fill up your story and navigate in no time! Accordion headers is ScrollyTelling’s newest way to show your story. Each part of data your story can be sectioned off so your viz will show the relevant data only!
Reporting in Tableau
Use tabs to navigate through your story in a single click. Fill up your story and navigate in no time! Accordion headers is ScrollyTelling’s newest way to show your story. Each part of data your story can be sectioned off so your viz will show the relevant data only!
Key features
FAQ
6 in total. Parameter, Filter, Highlight action & Parameter, Filter, Highlight animation.
No! ScrollyTelling allows you to configure so the visuals change as you scroll through your story.
Of course! Our products thrive on customer feedback, feel free to contact us with your feature requests.


