Restaurant Finder Dashboard with Tableau
The following blog shows the process and value of the latest dashboard we created using WriteBackExtreme and PictureThis Viz Extensions.
This project showcases how powerful and versatile Tableau can be combined with Viz Extensions.
The Process
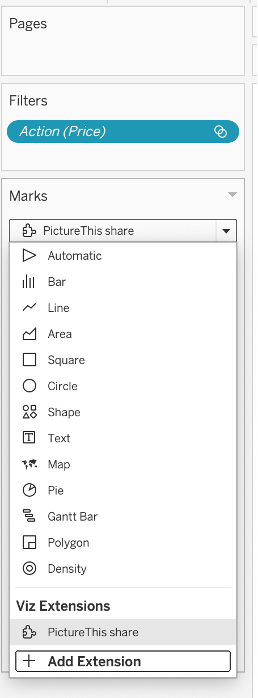
Using Viz Extensions to add PictureThis
Viz Extensions is a recent Tableau 2024.2 release which allows you to use Extensions within a sheet. This means we no longer need to add the sheet to a dashboard.
The Extension has been used to add the restaurant images and the menu.
From the marks card, you can select the PictureThis Extension and configure the Extension within the sheet, the following fields have been used for the Extension.
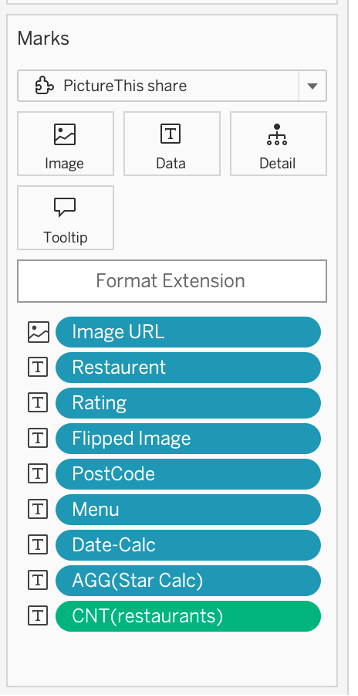
The restaurant data contains a field called Image URL, this field is needed for the extension to show the images and flipped images.
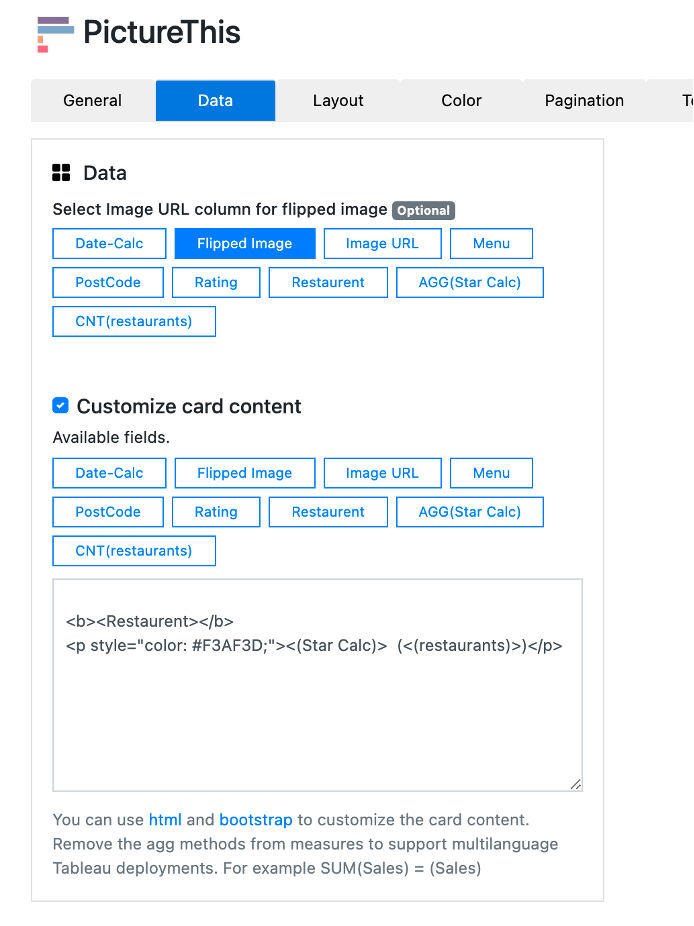
The star rating in the customize card content area uses the following calculation:

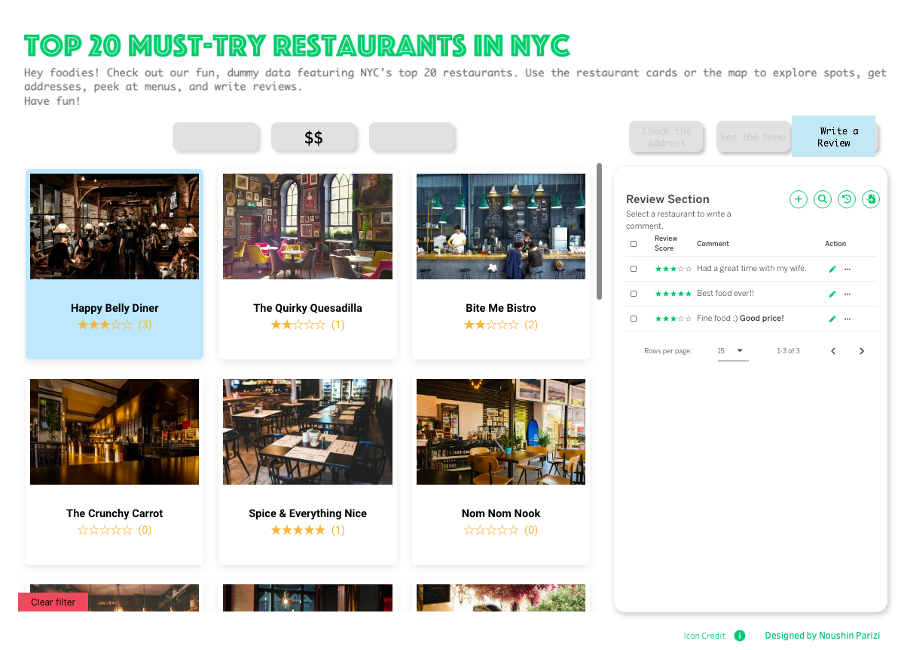
Using Write Back Extreme to add reviews
This Extension has been configured within the dashboard and uses the same sheet as the PictureThis Extension as it has all the fields needed for configuration.
Steps
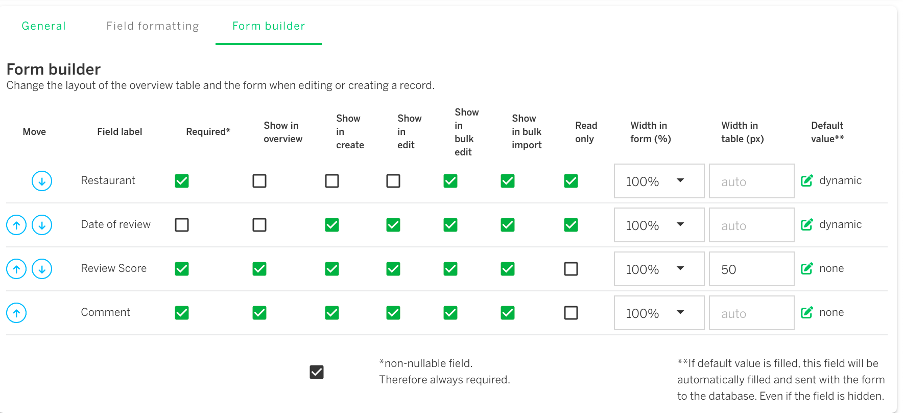
1. Create the schema using the Add Data module in the management console, the fields needed are: id, restaurant, review score, date of review, and comment.
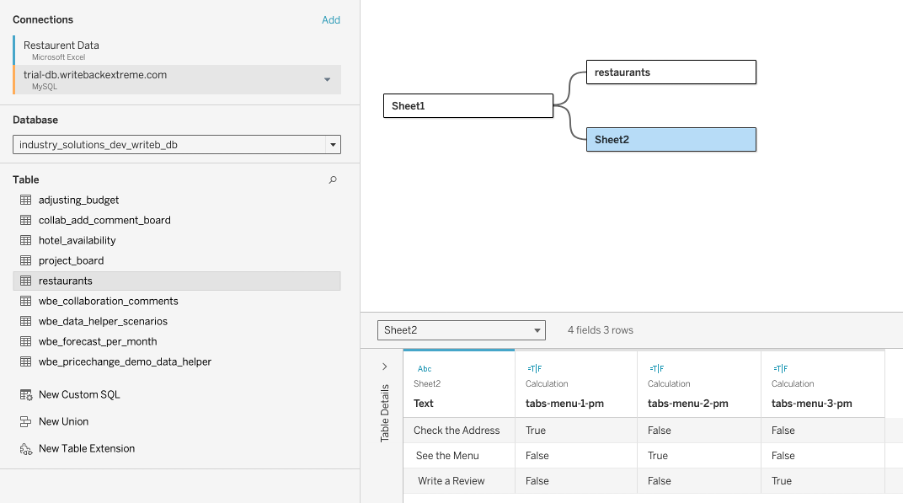
2. Bring in the schema data into Tableau and relate the tables.
3. The WriteBackExtreme set up looks like the following:
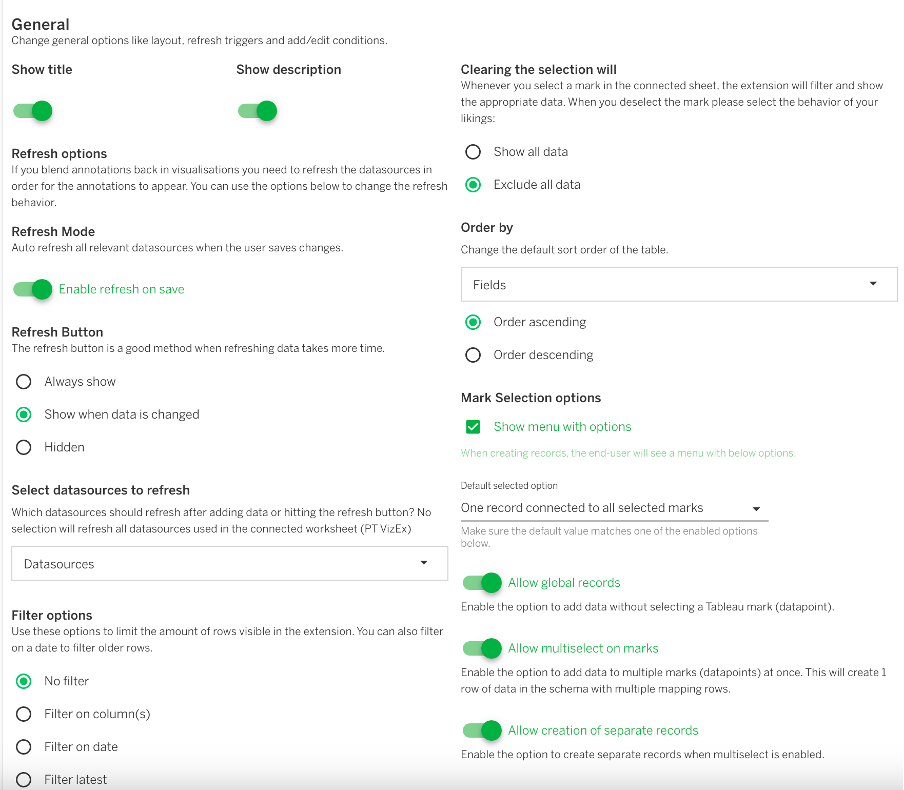
3.1 The WriteBackExtreme set up looks like the following:
4. For the Authentication section you can select the Username sheet and field.
5. In order for the parameter actions to work with the Extension, go to the Tabs option and enable Show tabs.
6. Go to the Mapping configuration option and enable to option to include the worksheet in mapping when selecting a data point.
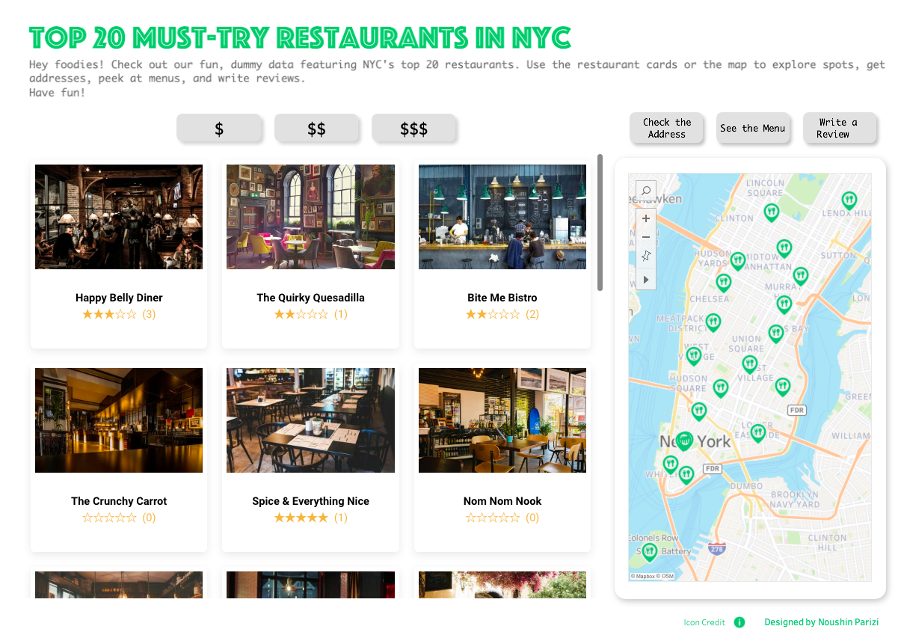
Filters
To tie the dashboard together: The PictureThis sheet and map has been used as a filter.
Parameters
The tab functionality on the right is enabled using dynamic zone visibility (https://help.tableau.com/current/online/en-us/dynamic_zone_visibility.htm) with parameter actions.
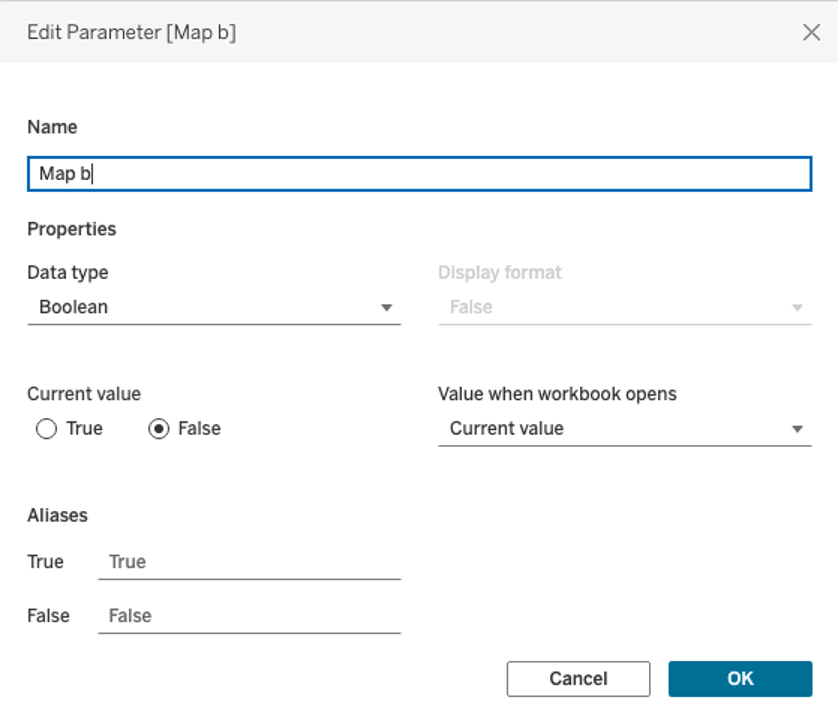
First, a Boolean parameter should be created for each tab followed by a separate calculation for each option that looks like the following:

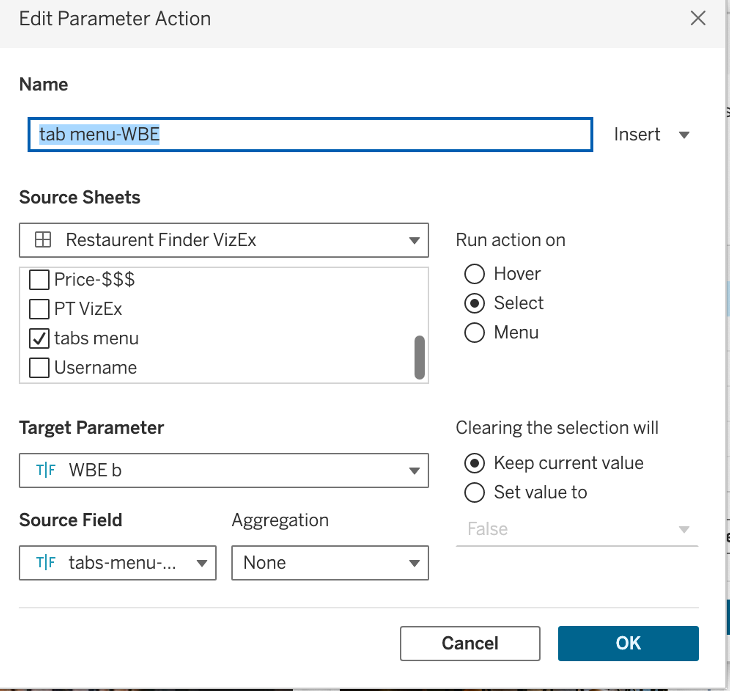
The 3 parameter actions are configured as follows:
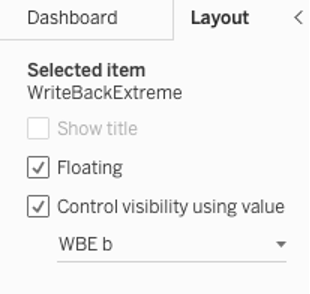
Then by selecting each of the three tabs (map, menu, and WriteBackExtreme worksheet) and going to the layout tab, we select the parameter that controls the visibility of the worksheet.
And voila, you have created the completed dashboard now. We hope you enjoyed learning more about this use case and dashboard development. Download it now and explore this amazing dashboard for yourself.