SuperTables 4.2.0
This massive update for SuperTables reflects our ongoing commitment to customer-driven innovation.
With feedback at the forefront, we’ve redesigned and enhanced SuperTables to make your experience even better and intuitive. The 4.2.0 release introduces a host of improvements designed to meet your needs and streamline your workflow. From a new interface to smarter functionality, this update is all about enabling users to get the most out of data.
New Configuration Interface
The new configuration interface in SuperTables 4.2.0 has been designed with simplicity and clarity in mind. We’ve introduced a colored layout and clear headings to help you navigate settings faster and instantly see what’s configured. Additionally, a confirmation popup now appears when a configuration is successfully applied.
Group the columns in the sidebar on dimensions and measures
We’ve added the ability to group columns in the sidebar based on dimensions and measures. This new feature helps you organize and manage your data more efficiently, making it easier to find and work with specific columns. By visually separating dimensions from measures, the sidebar becomes more intuitive.
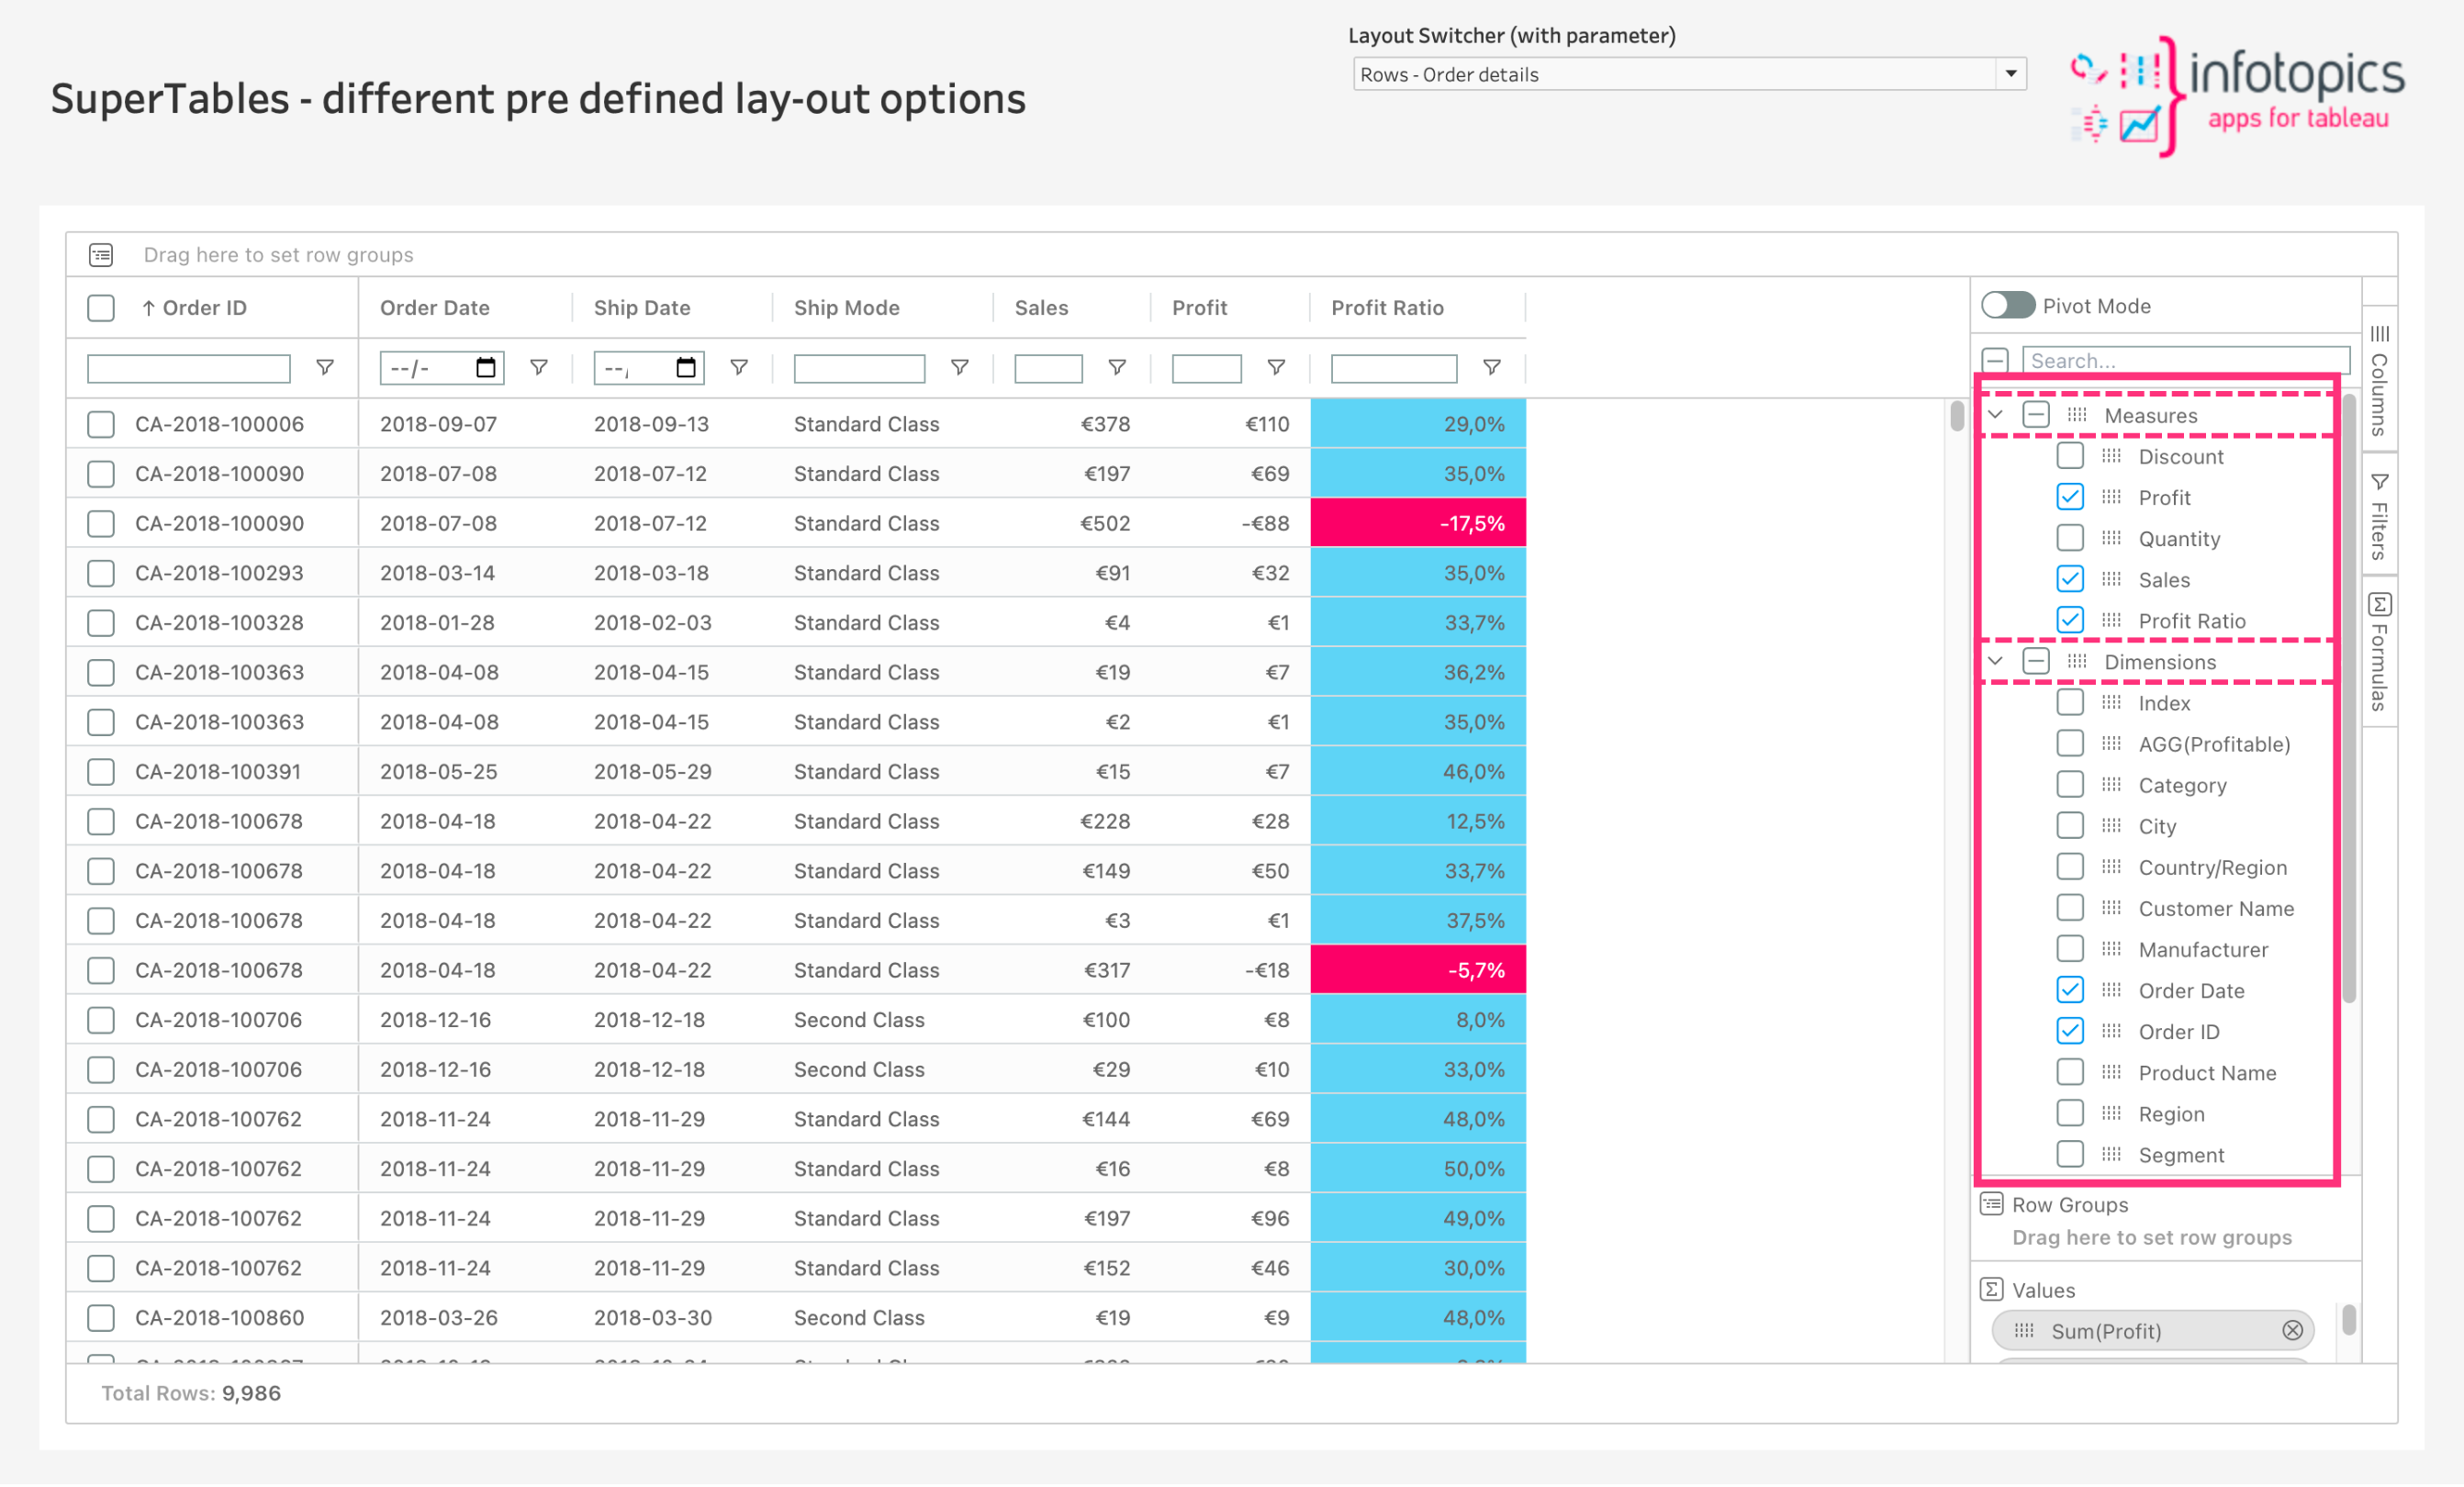
Option to switch datasheet (worksheet) based on a parameter value.
With SuperTables 4.2.0, you can now switch datasheets (worksheets) dynamically based on a parameter value. This new option offers greater flexibility by allowing you to toggle between different datasheets without manual intervention. It’s perfect for users managing multiple views or datasets.
Added option to make the tooltip interactive.
We’ve introduced an option to make tooltips interactive in SuperTables 4.2.0. This means users can now interact with custom-designed tooltips by copying and pasting text directly from them. It’s a great way to share key information or details without navigating away from the data.
Wait, there’s more!
Additions:
- Excel hyperlinked cells if they are hyperlinked in SuperTables.
- Option to group the columns in the sidebar on dimensions and measures.
- Option to hide new columns added to the datasheet.
- Conditional formatting of text color to entire row.
- The option to automatically set the minimum and maximum values for a bar chart.
- Option to change vertical alignment of text when using fixed row height.
- Aggregation options for formulas.
- Alignment, formatting, and color options for formulas.
- Option to expand or collapse pivot(s) using the context menu.
- A new aggregation function called ‘Selective Aggregation’ to conditionally aggregate values.
- Menu option to reorder the columns in pivot mode.
- Option to set the header font size separately from the font size of the cell per column.
- Option to import/export workbook settings.
- Option to fit columns to window.
- ABS(absolute) function in the calculations.
- Loading icon when columns are being fetched in the config screen.
Enterprise Only:
- Support for images in the Excel export.
- Added support for viz-extension trex files. (domain.com/trex)
Improvements:
- Header coloring for calculations.
- Grand totals in the top row.
- Suppress total not working in certain instances.
- An issue with calculation columns not being colored in tableau and excel.
- Aggregated values of calculated columns when the aggregation is set to Sum/Avg….
- Floating export button(s).
- Row hover behaviour.
- Conditional formatting behaviour.
- Made parameter data more compact.
- Disabled hover effect on rows with conditionally formatted background colors.