Infotopics | Apps for Tableau
Features ShowMeMore2026-03-23T12:14:48+01:00

ShowMeMore

Overview ‎ ‎ ‎ ‎ ‎ ‎ ‎ ‎ ‎ ‎ Features ‎ ‎ ‎ ‎ ‎ ‎ ‎ ‎ ‎ ‎ Pricing

ShowMeMore

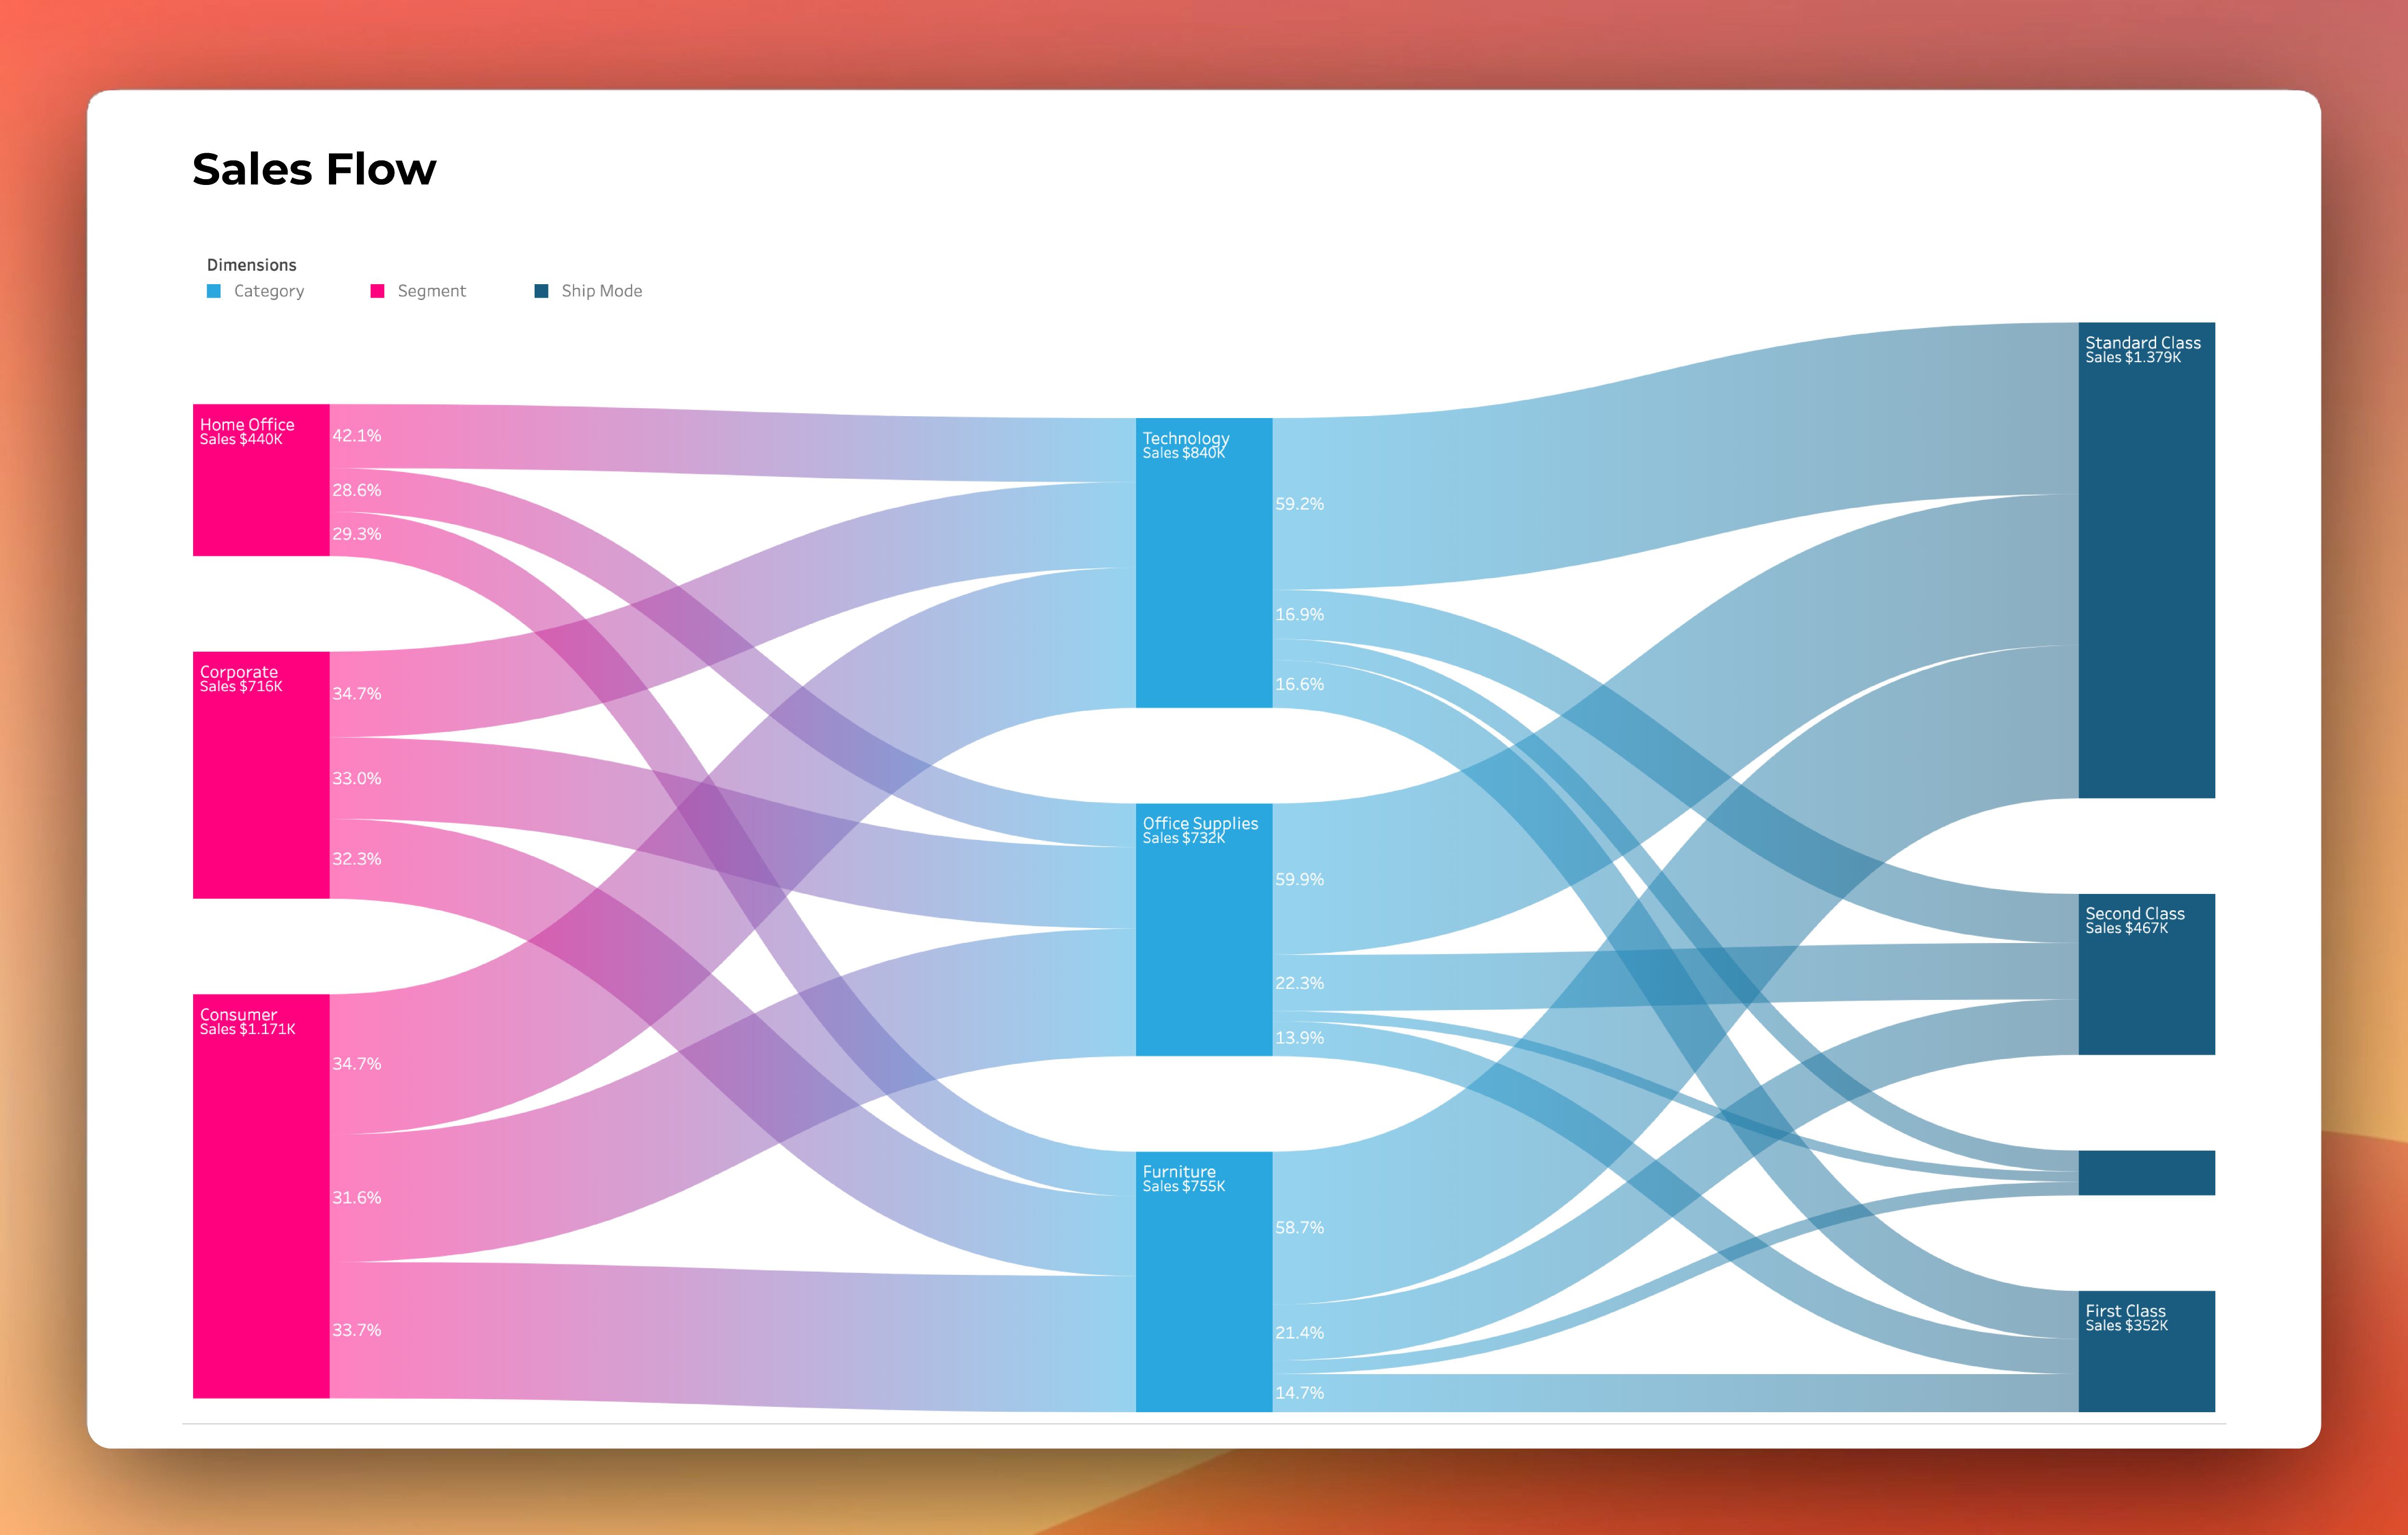
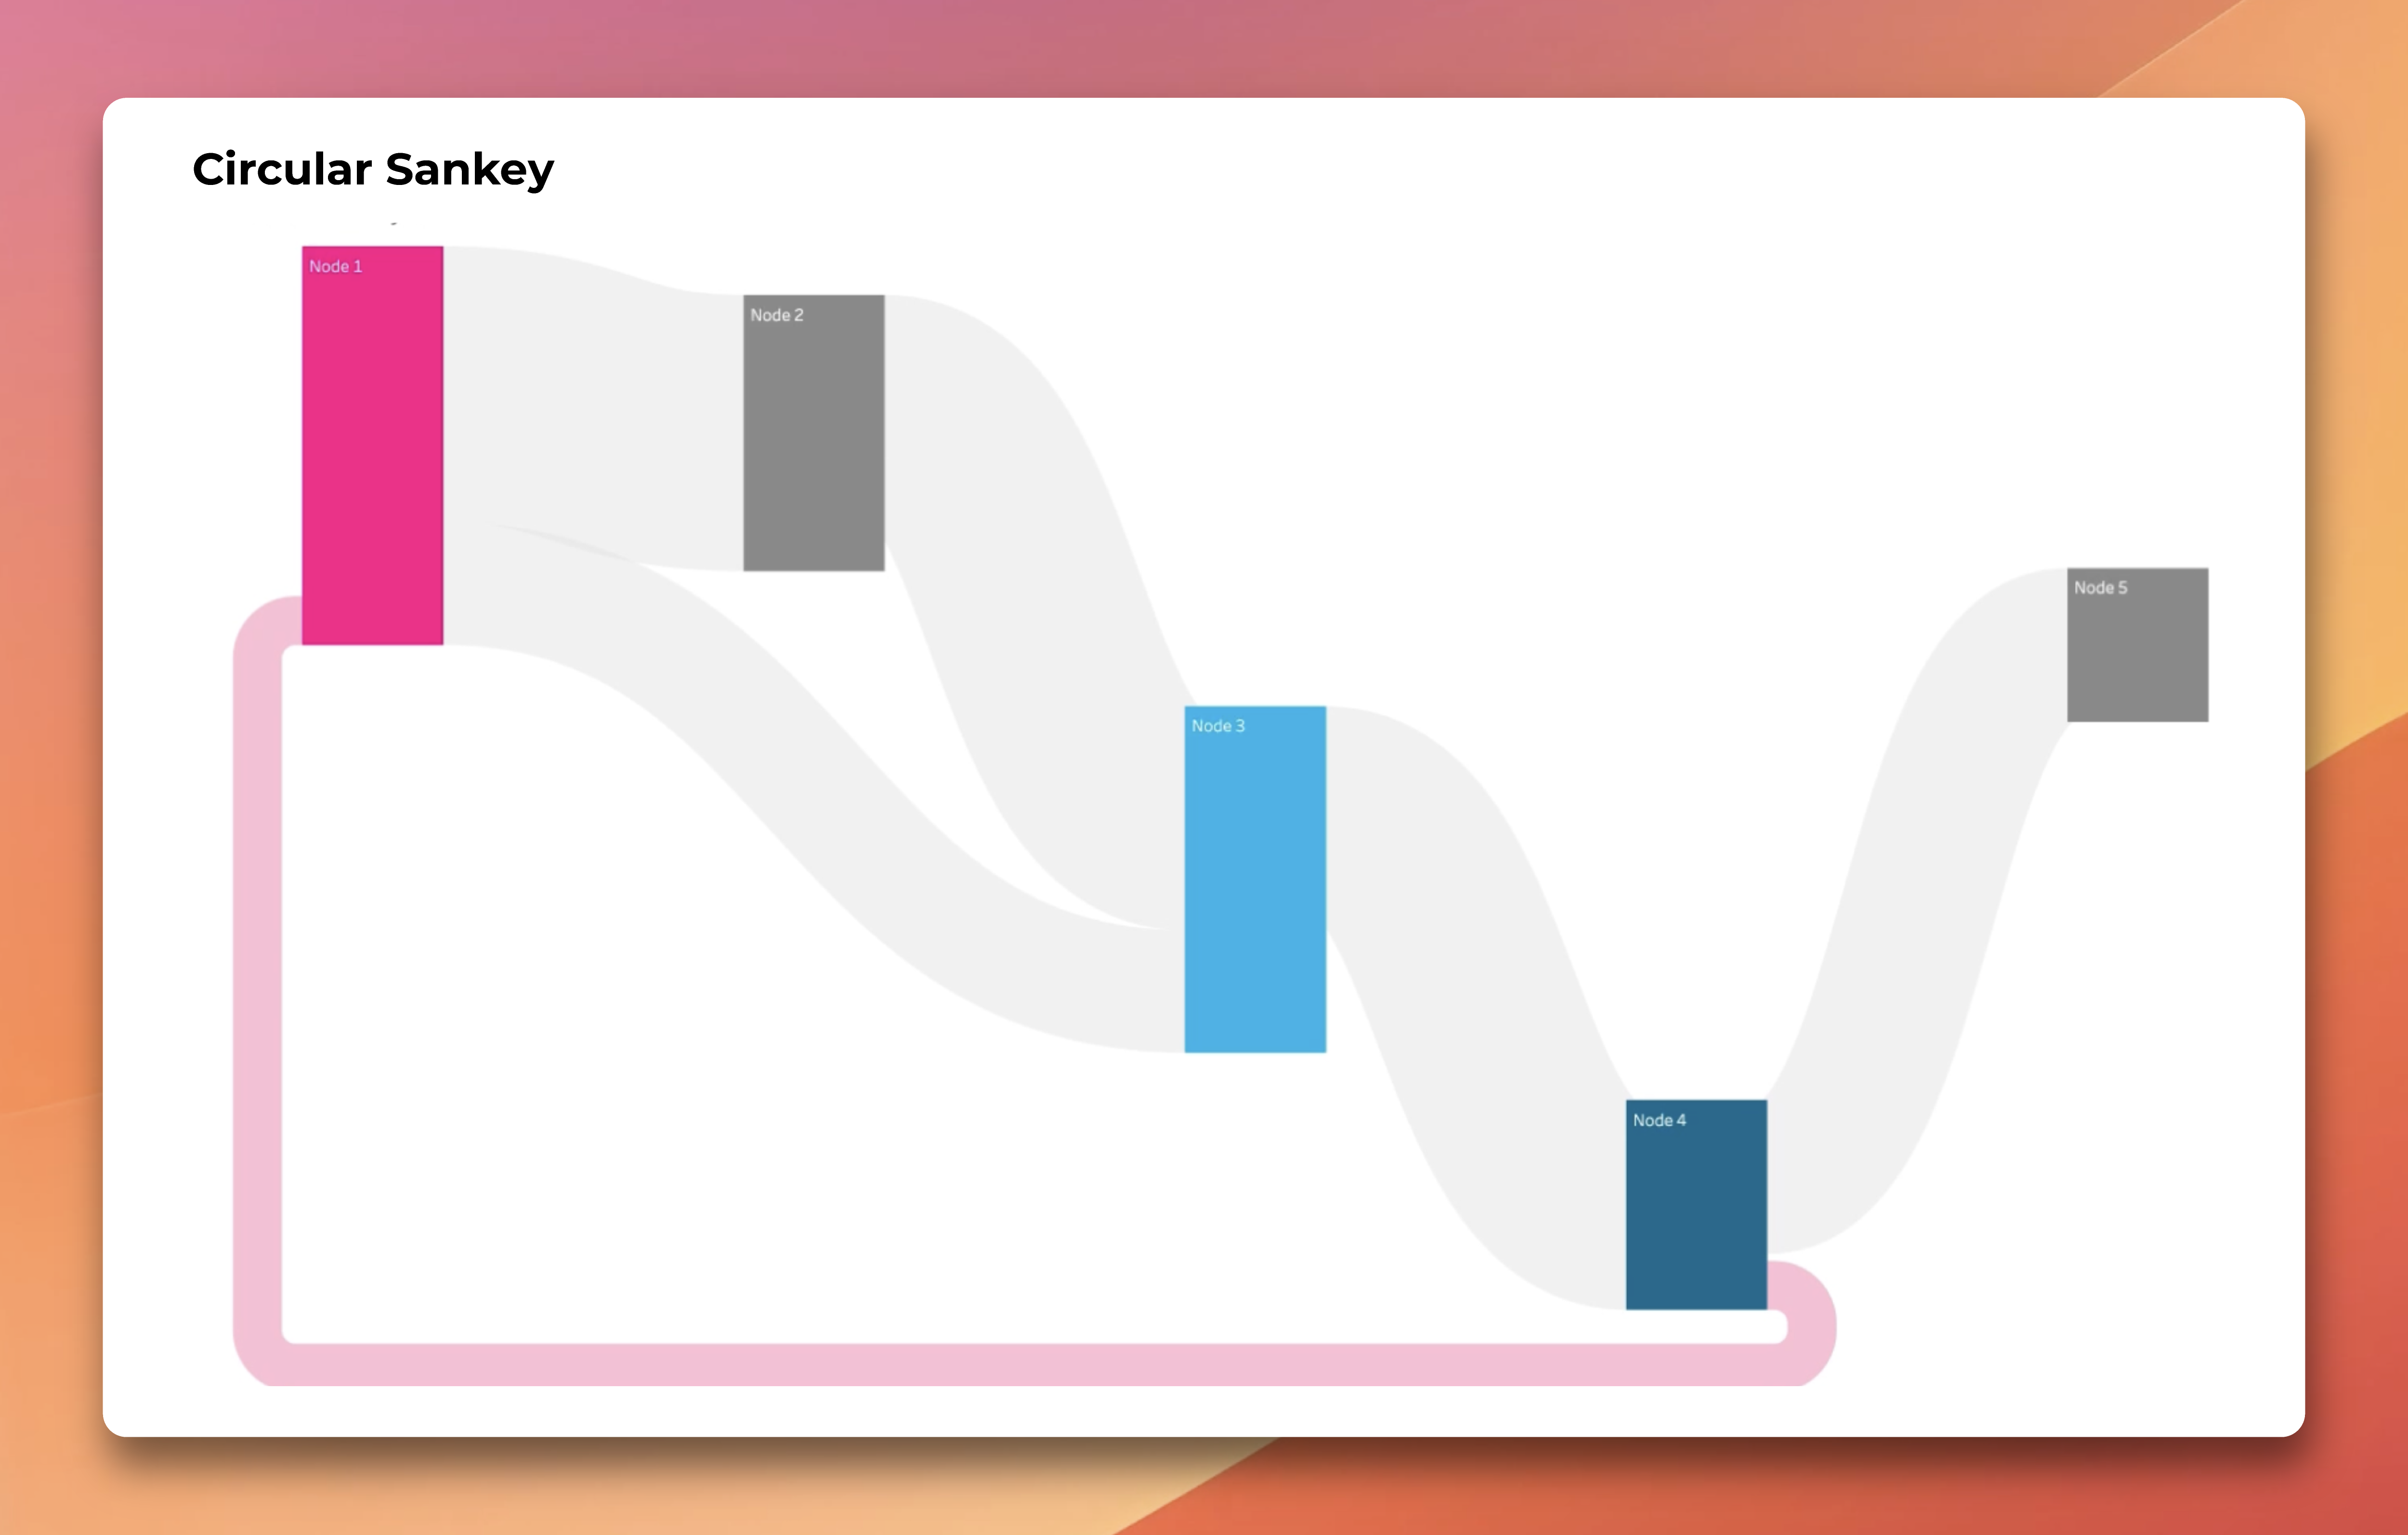
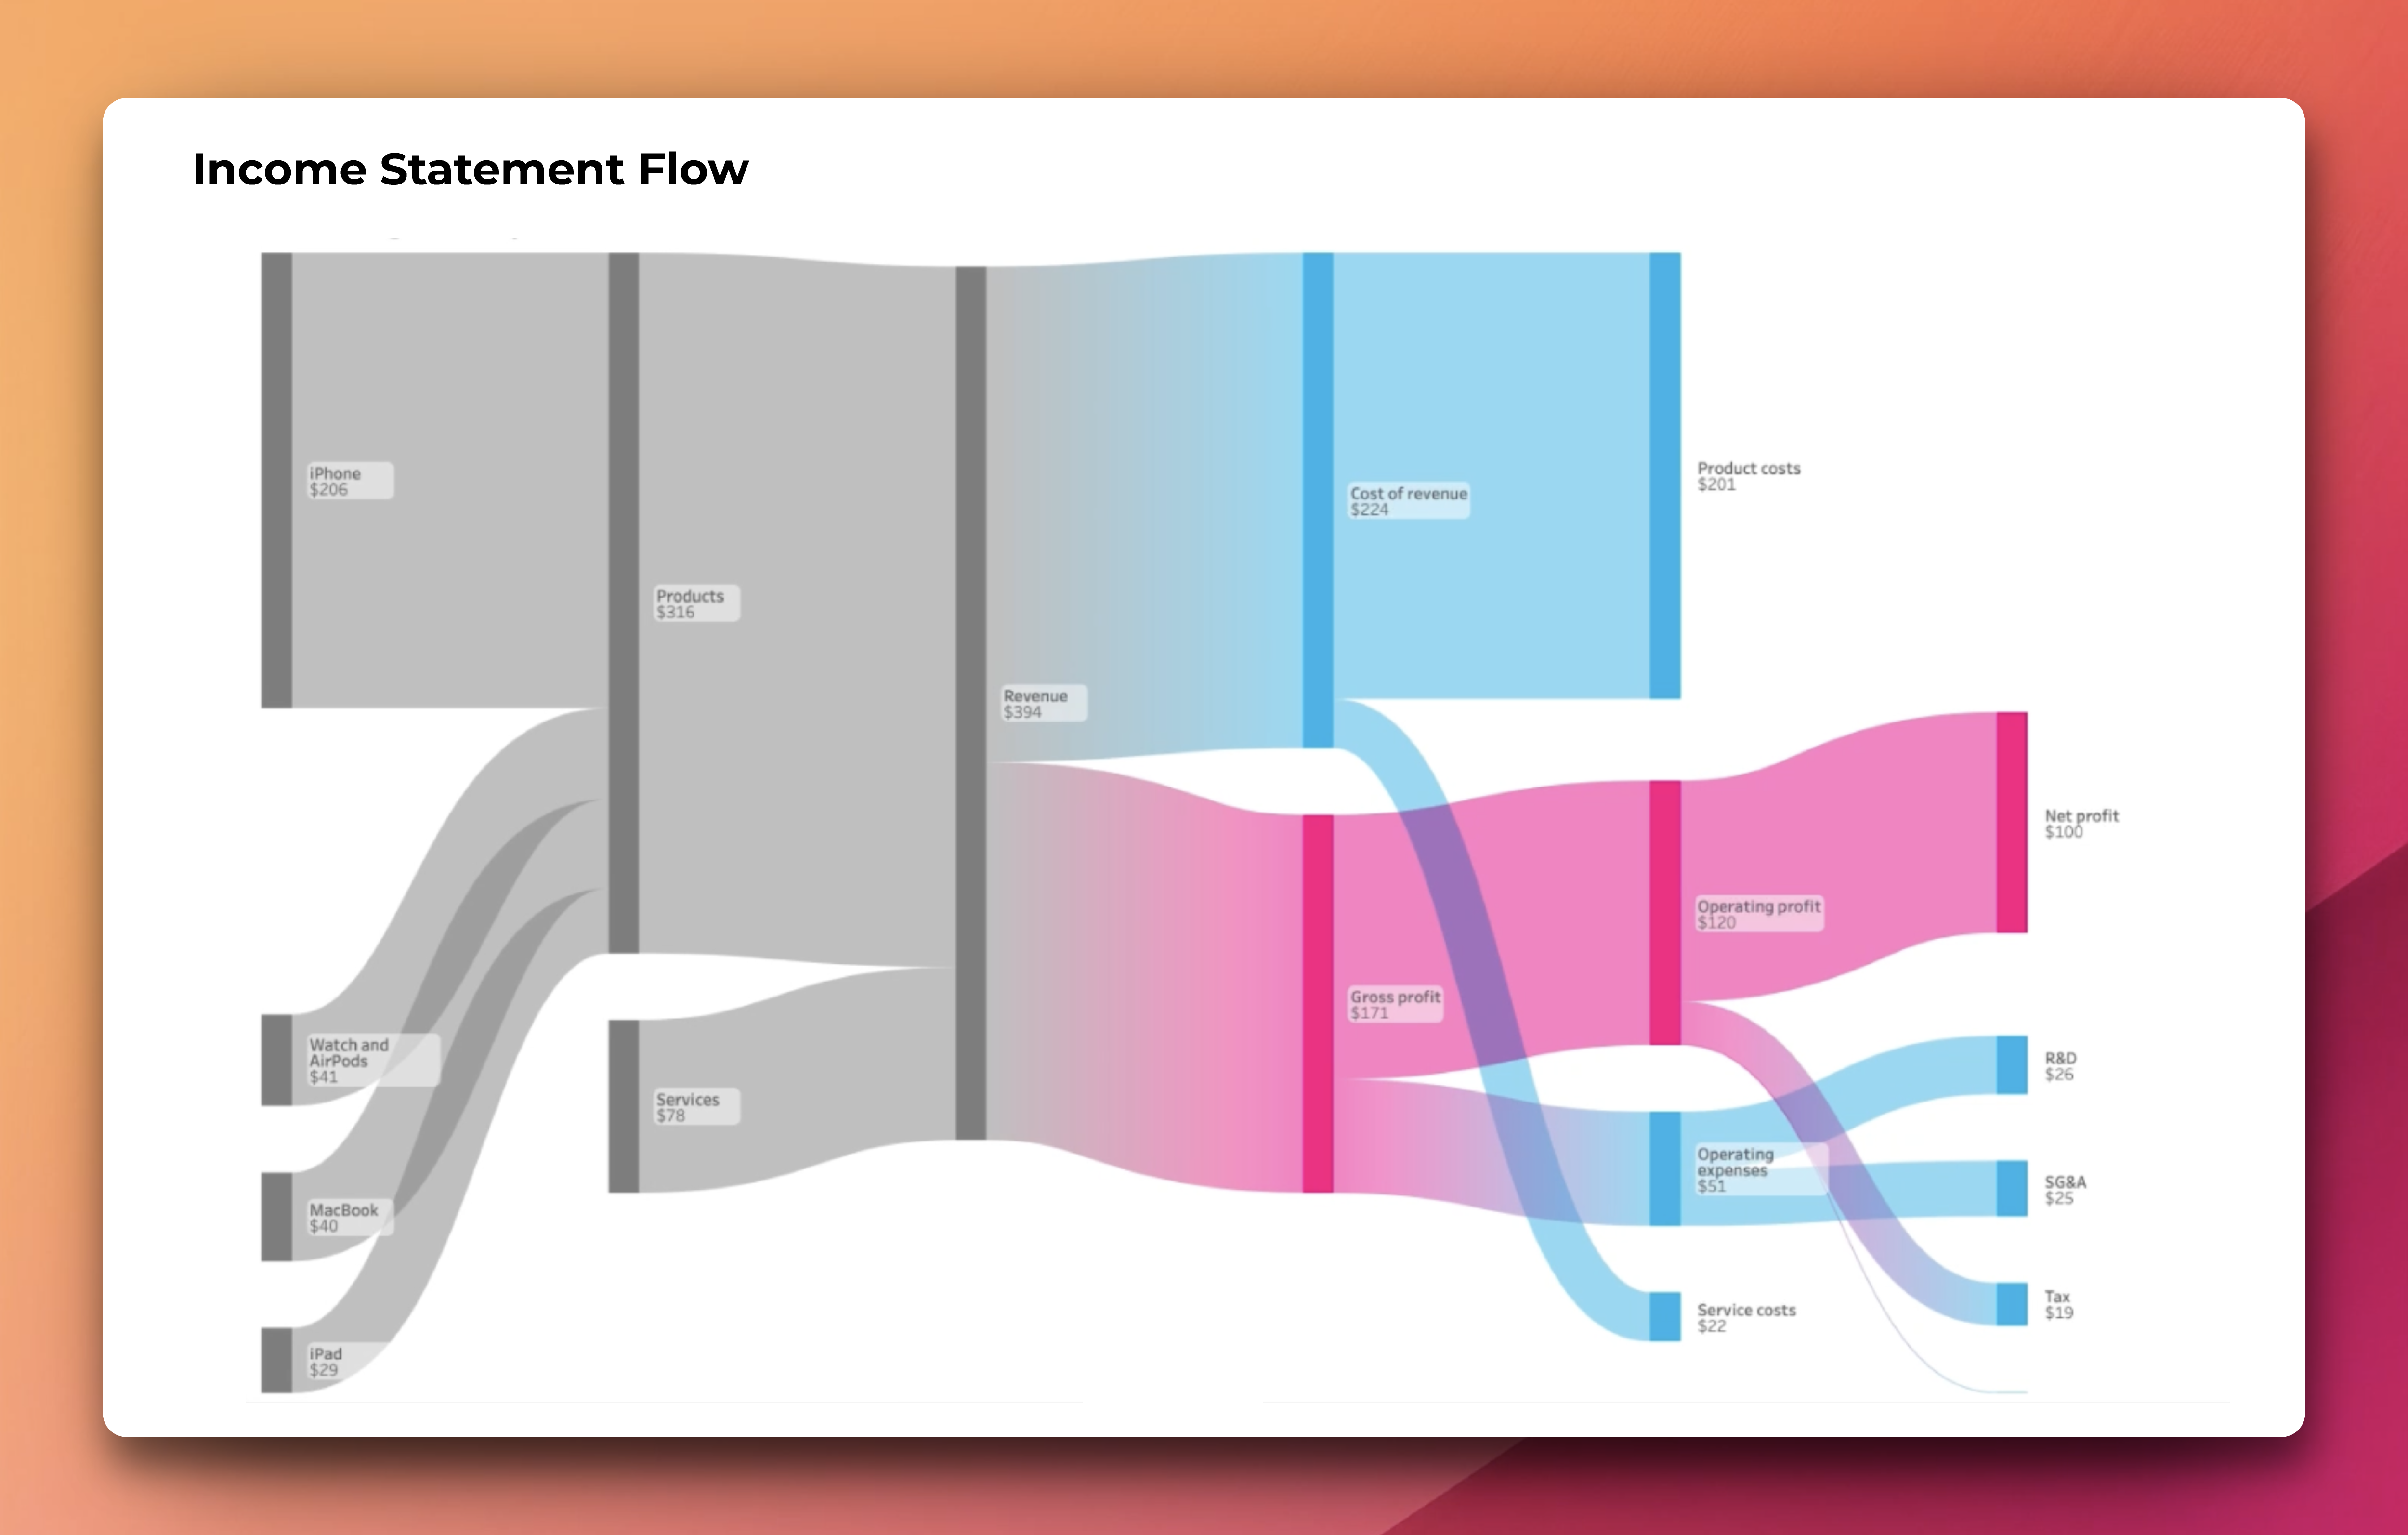
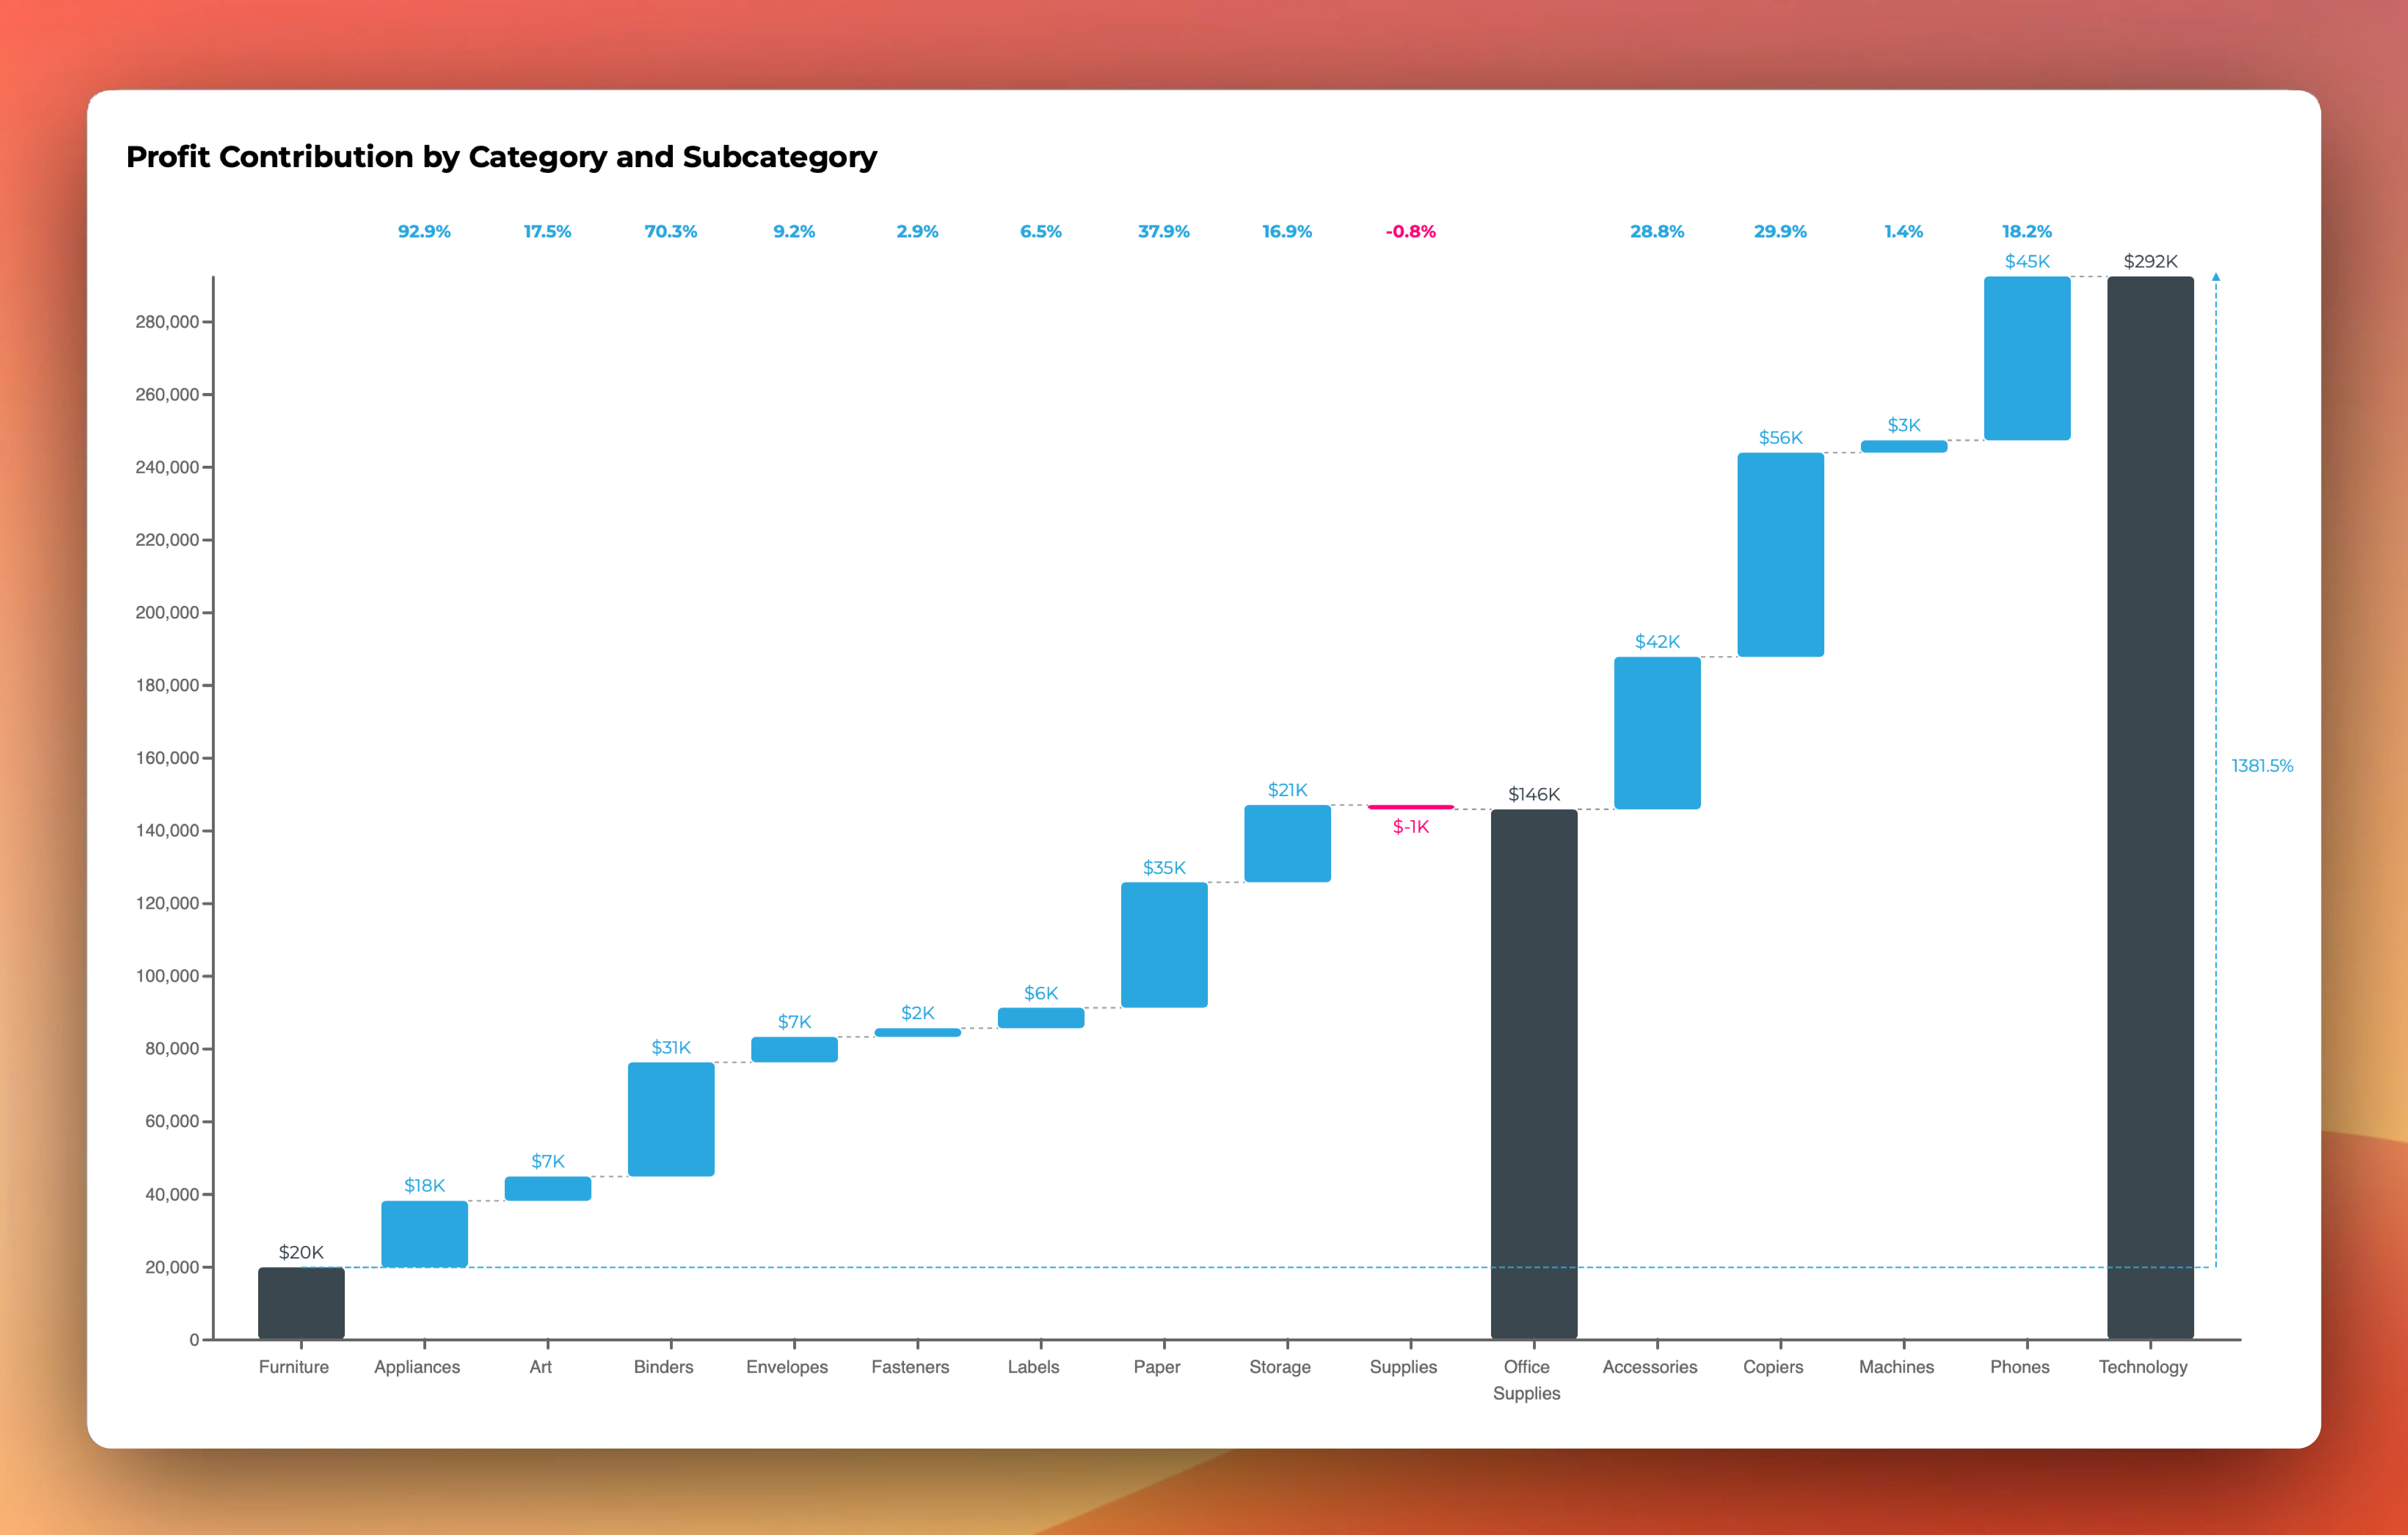
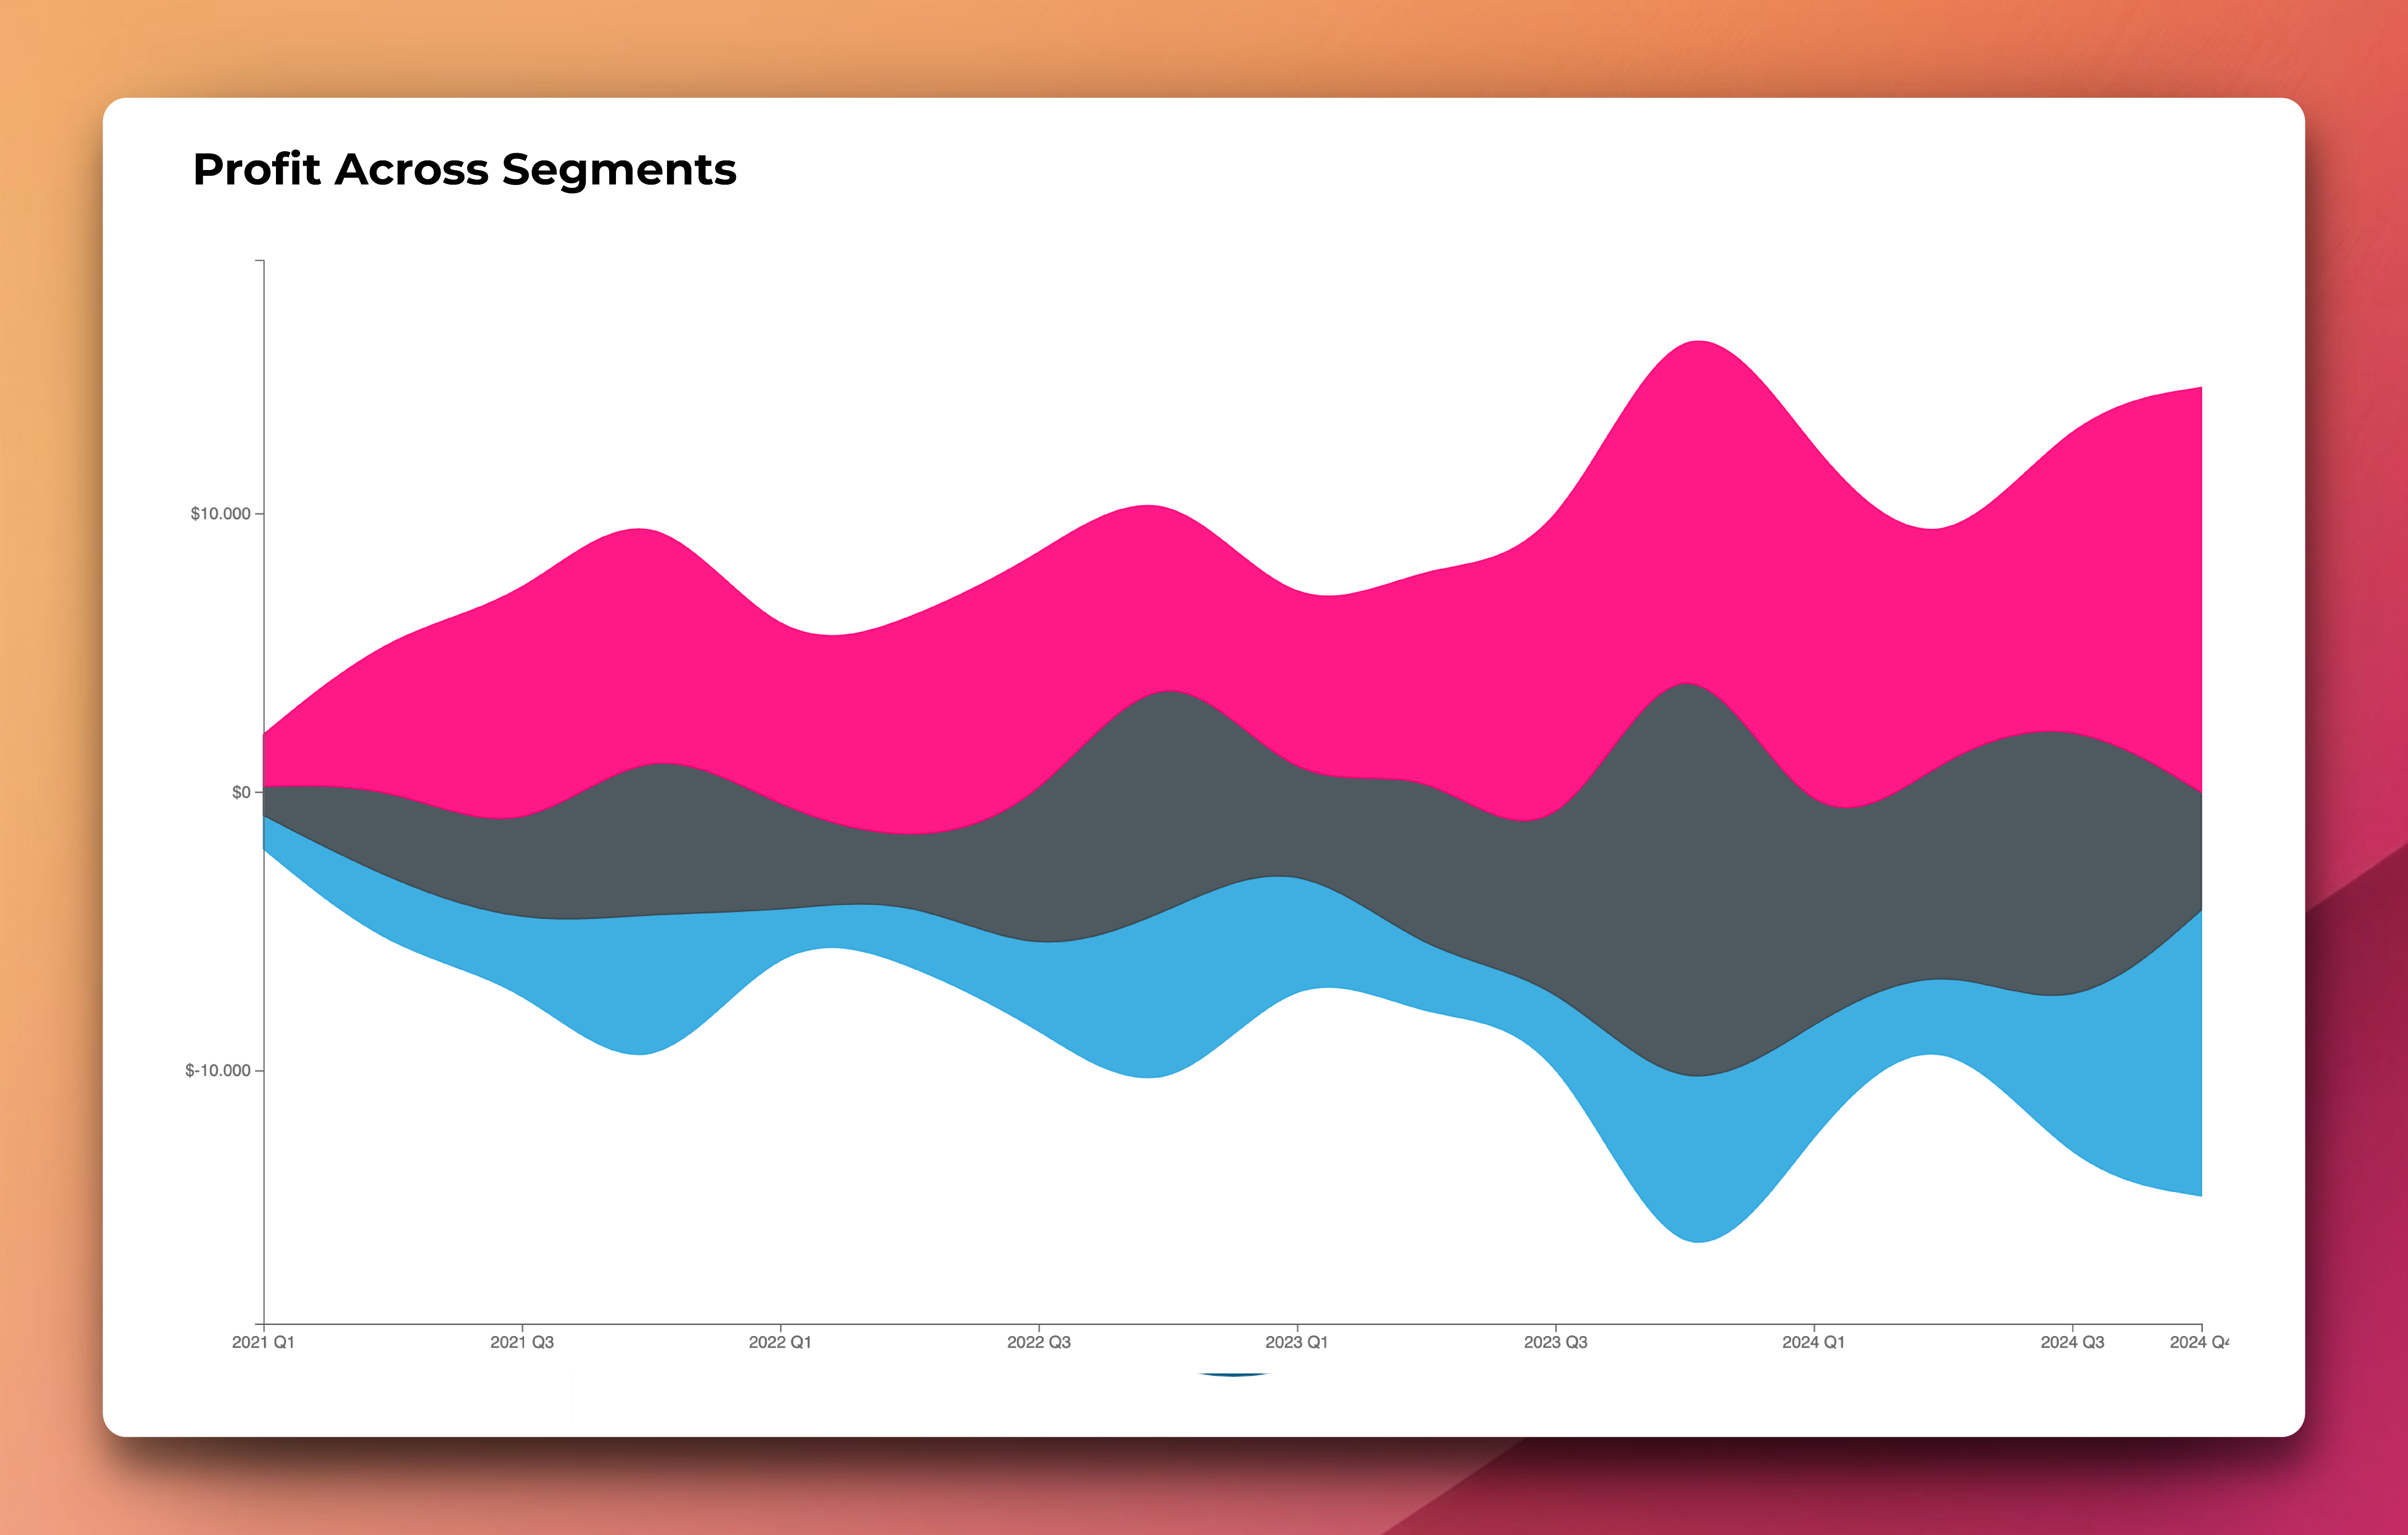
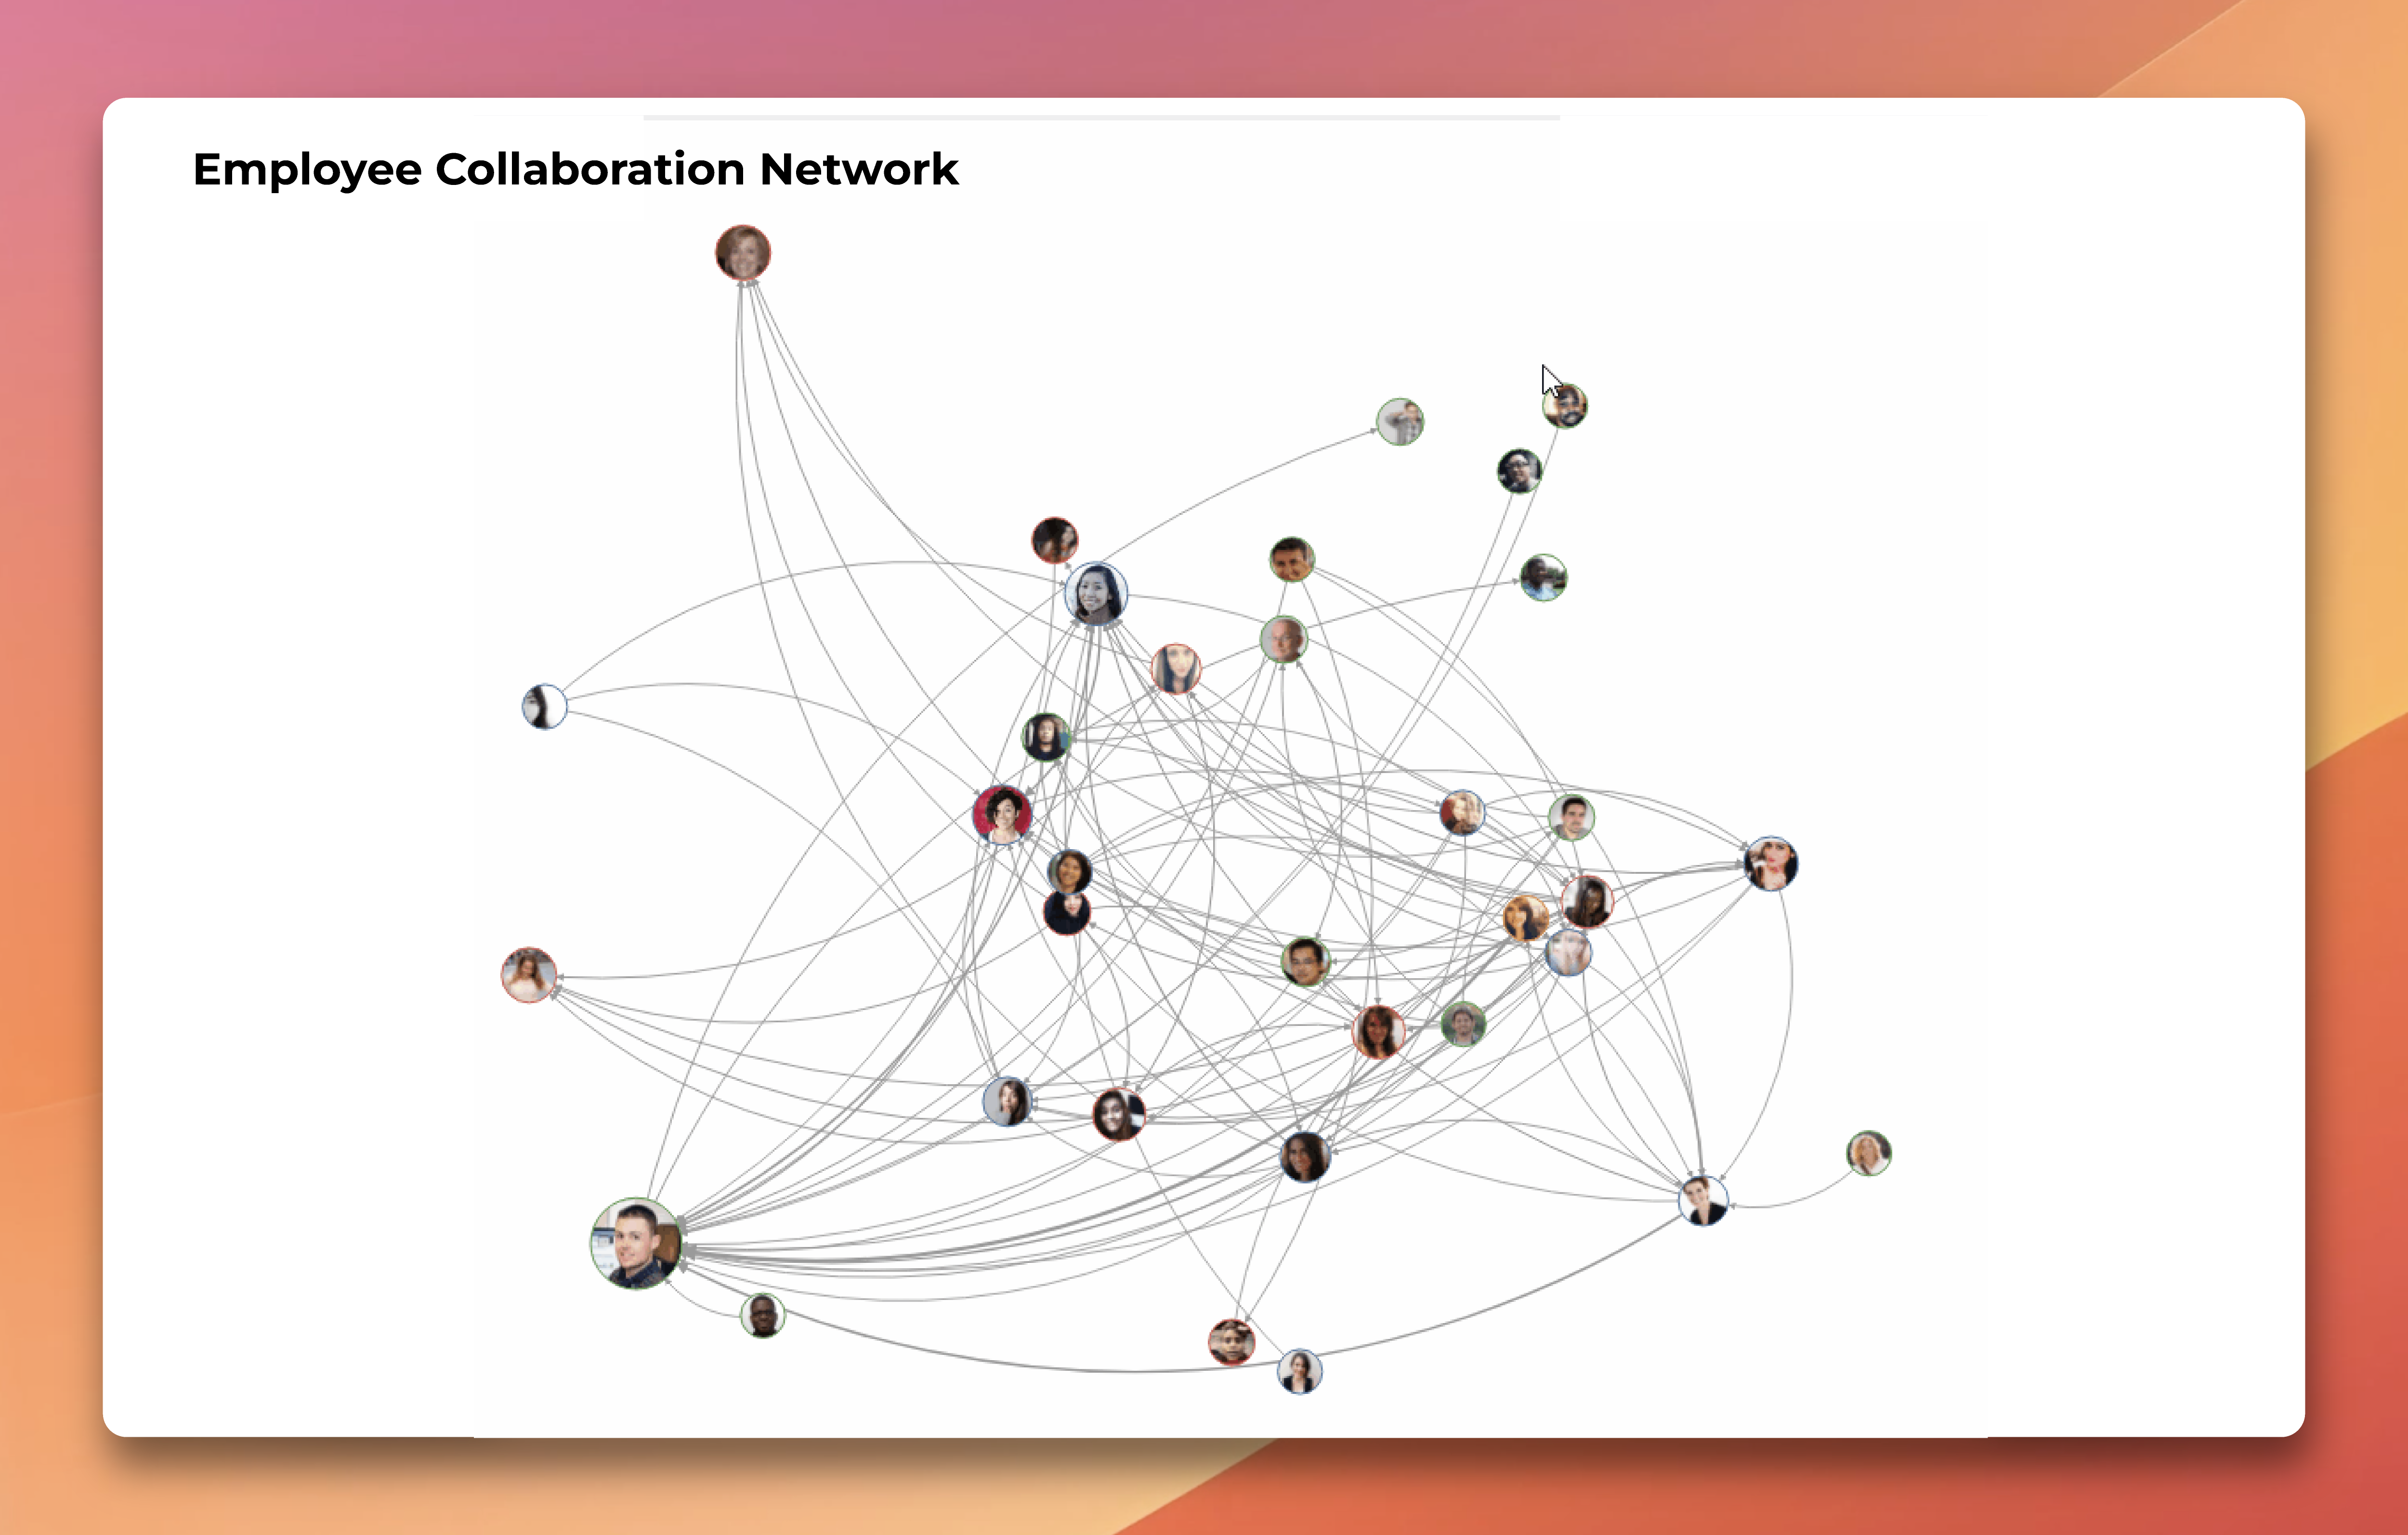
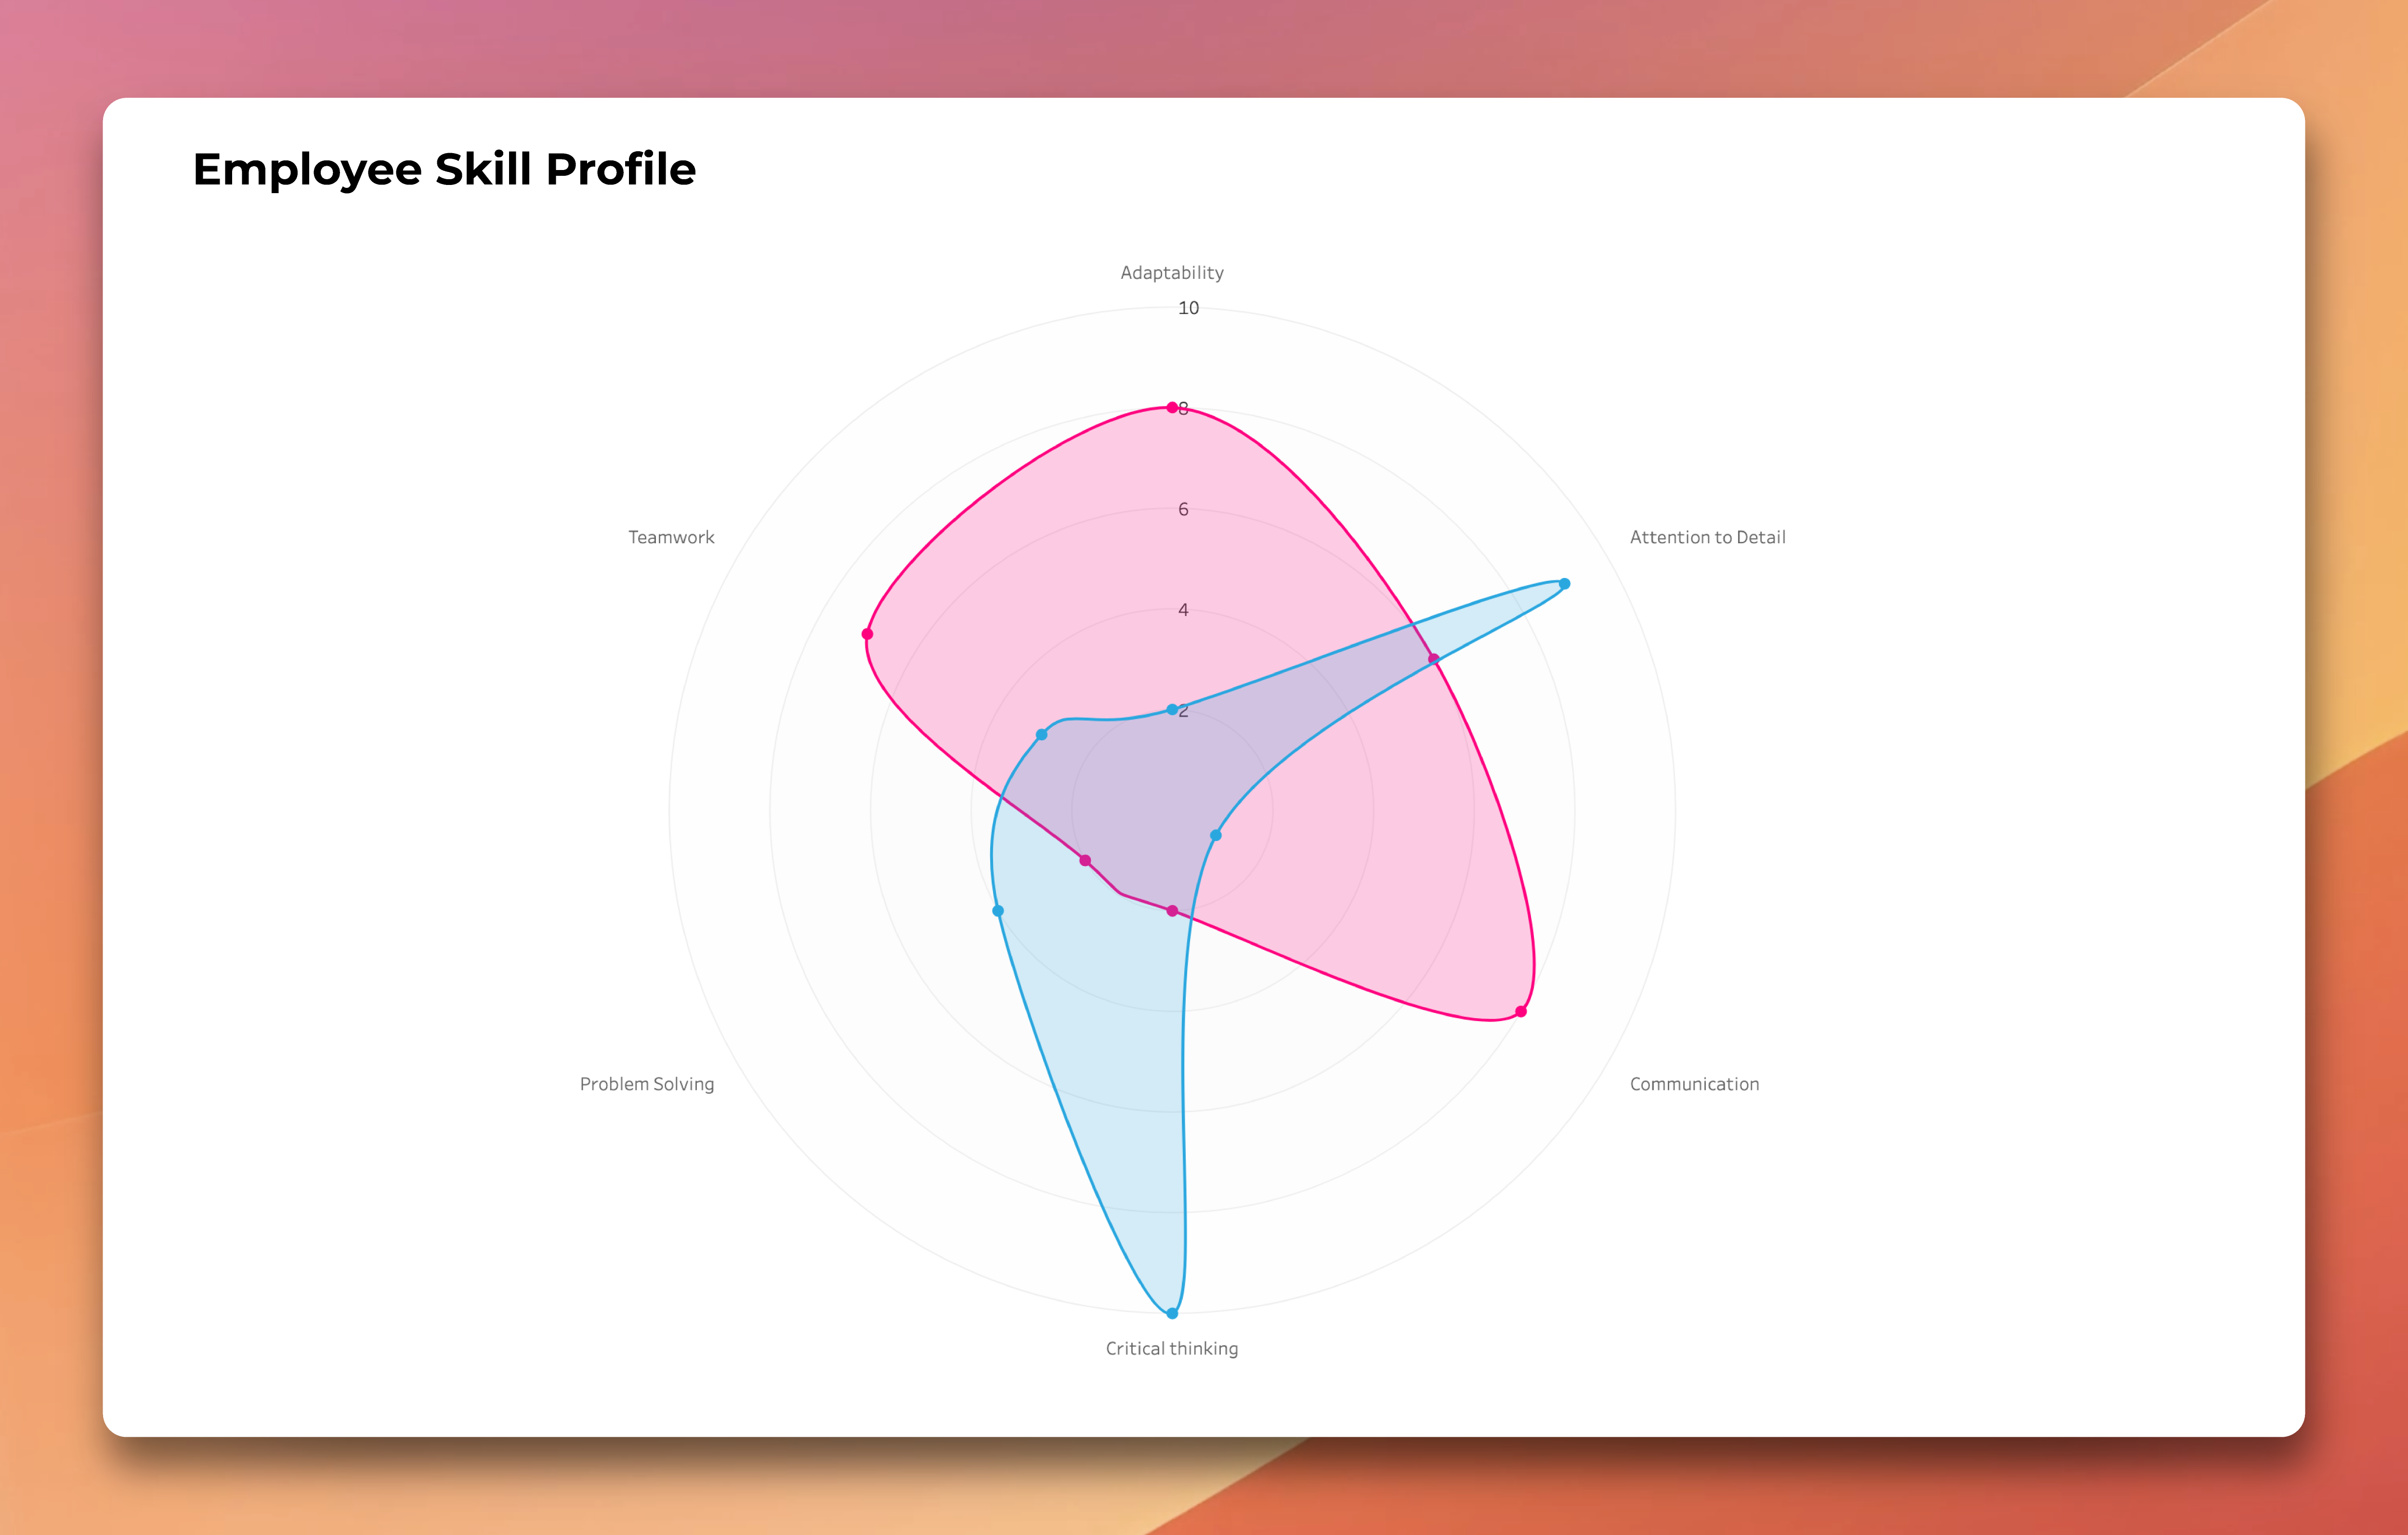
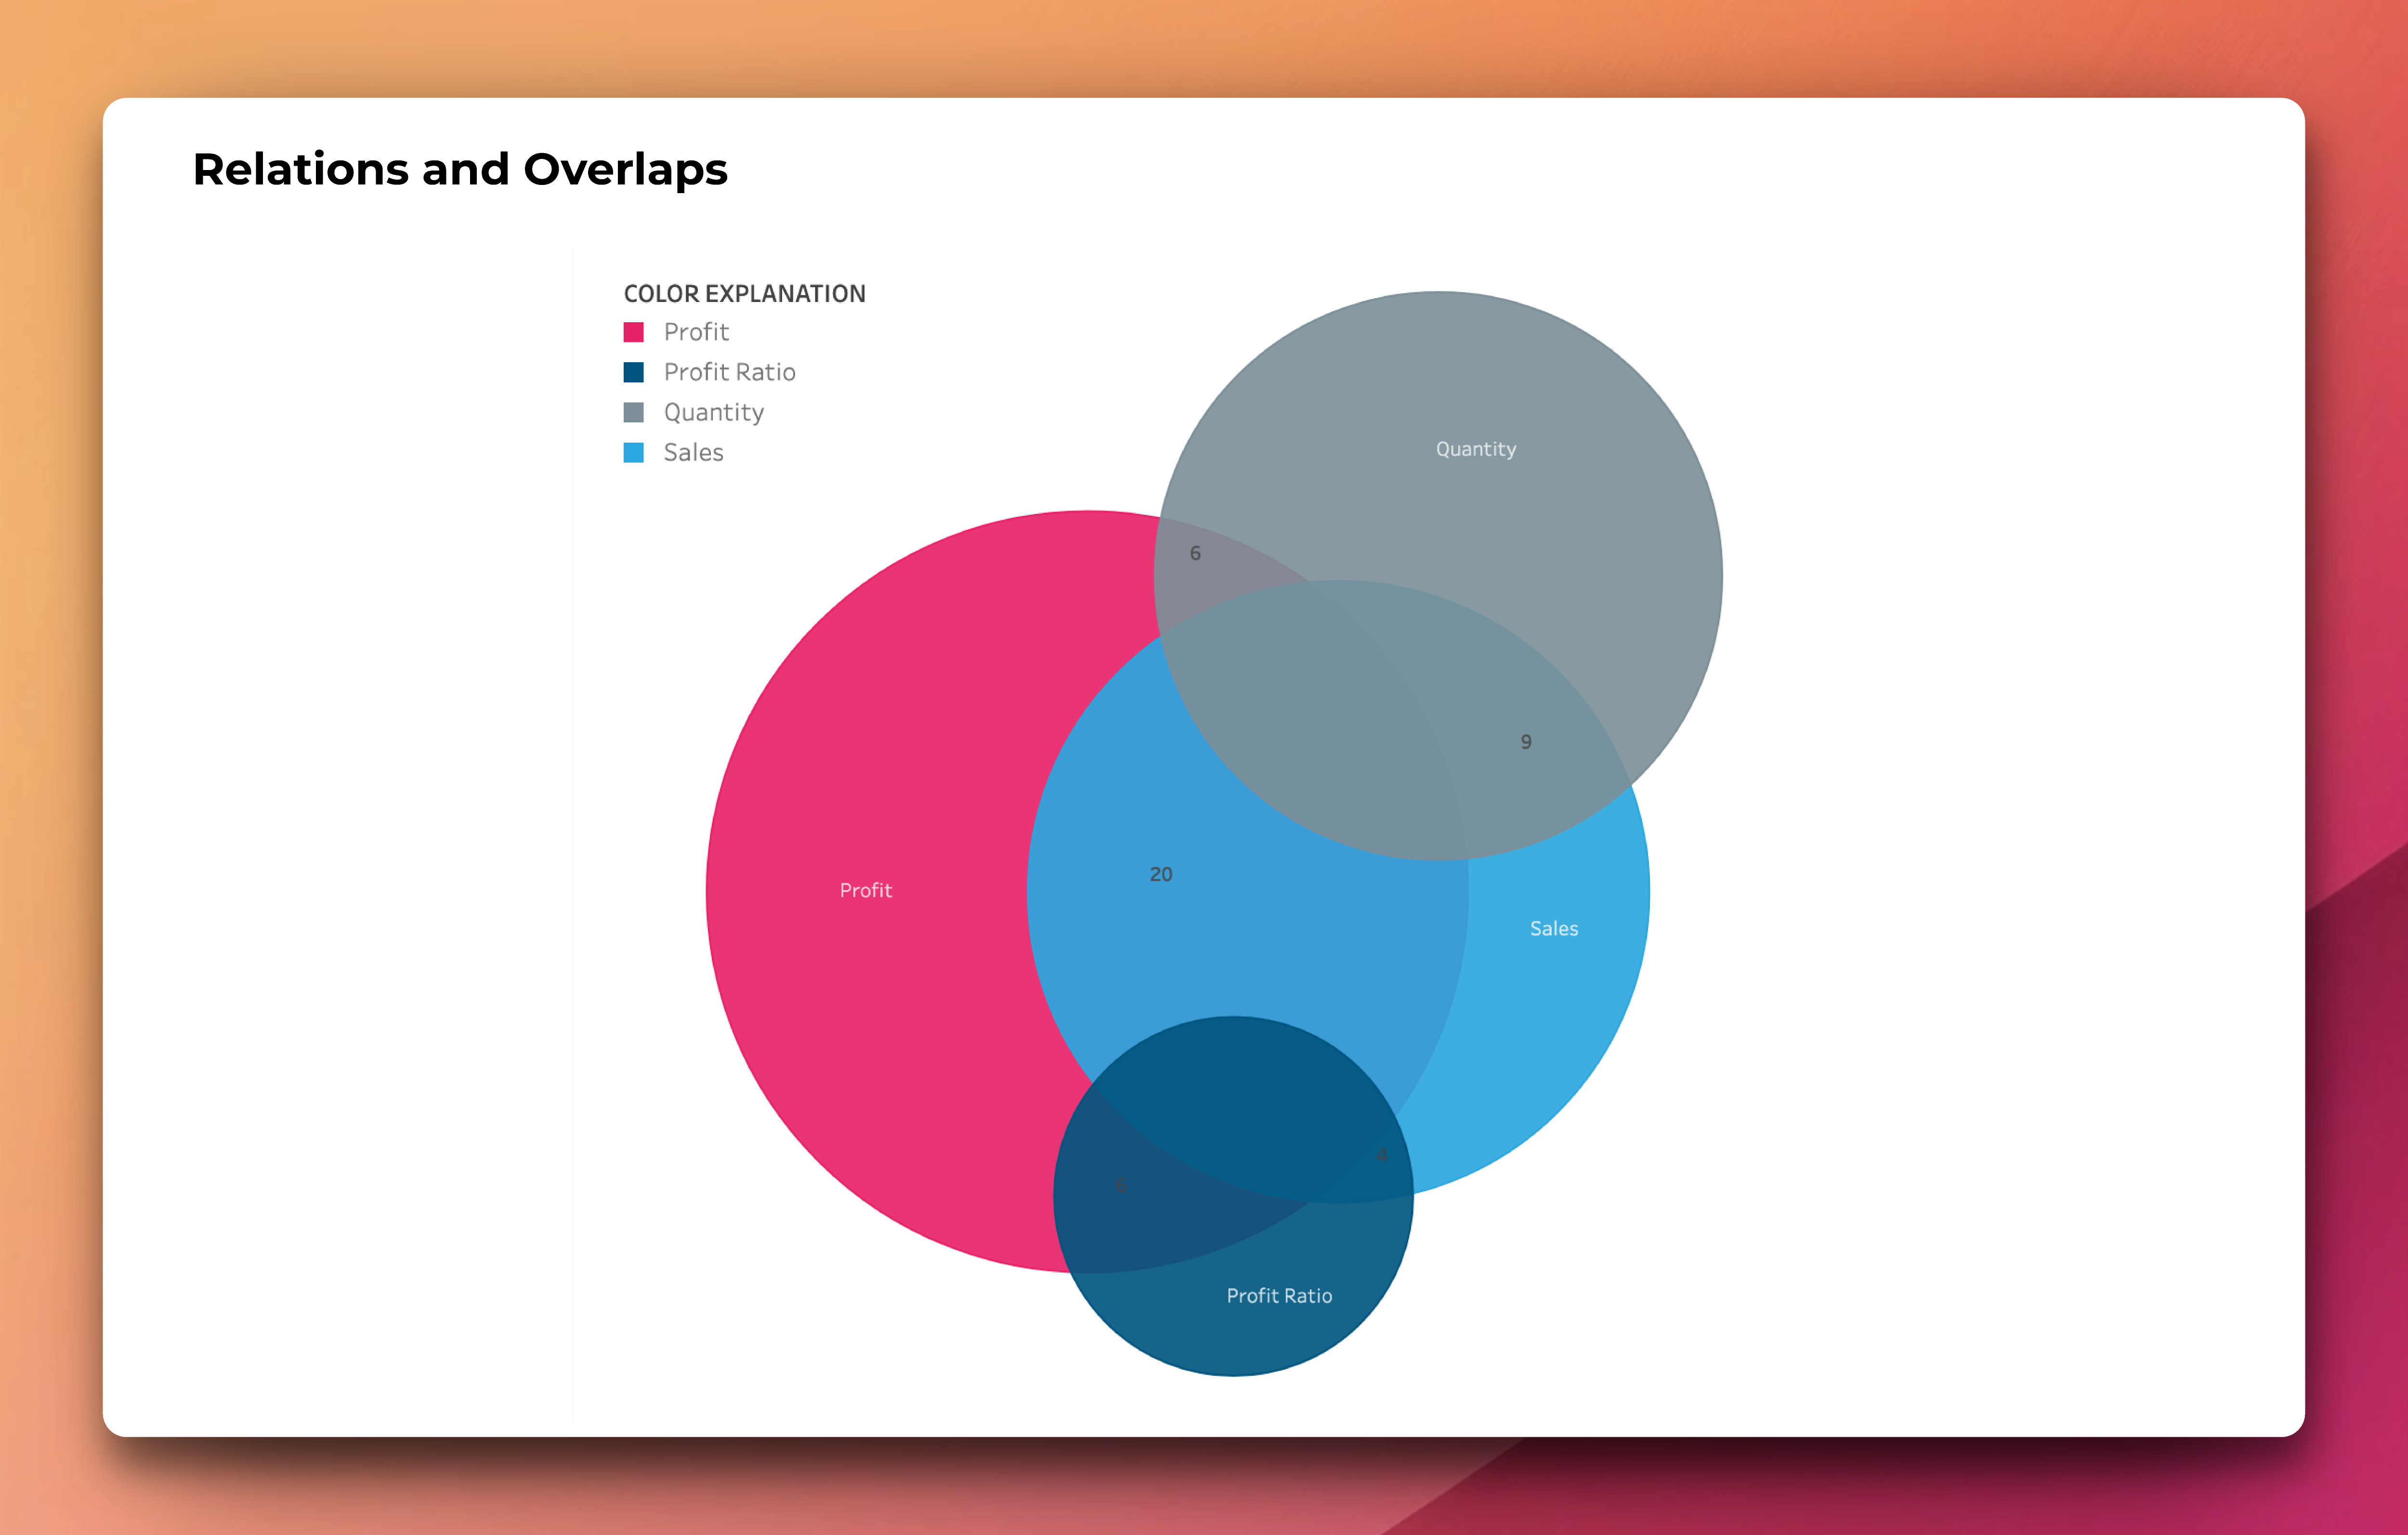
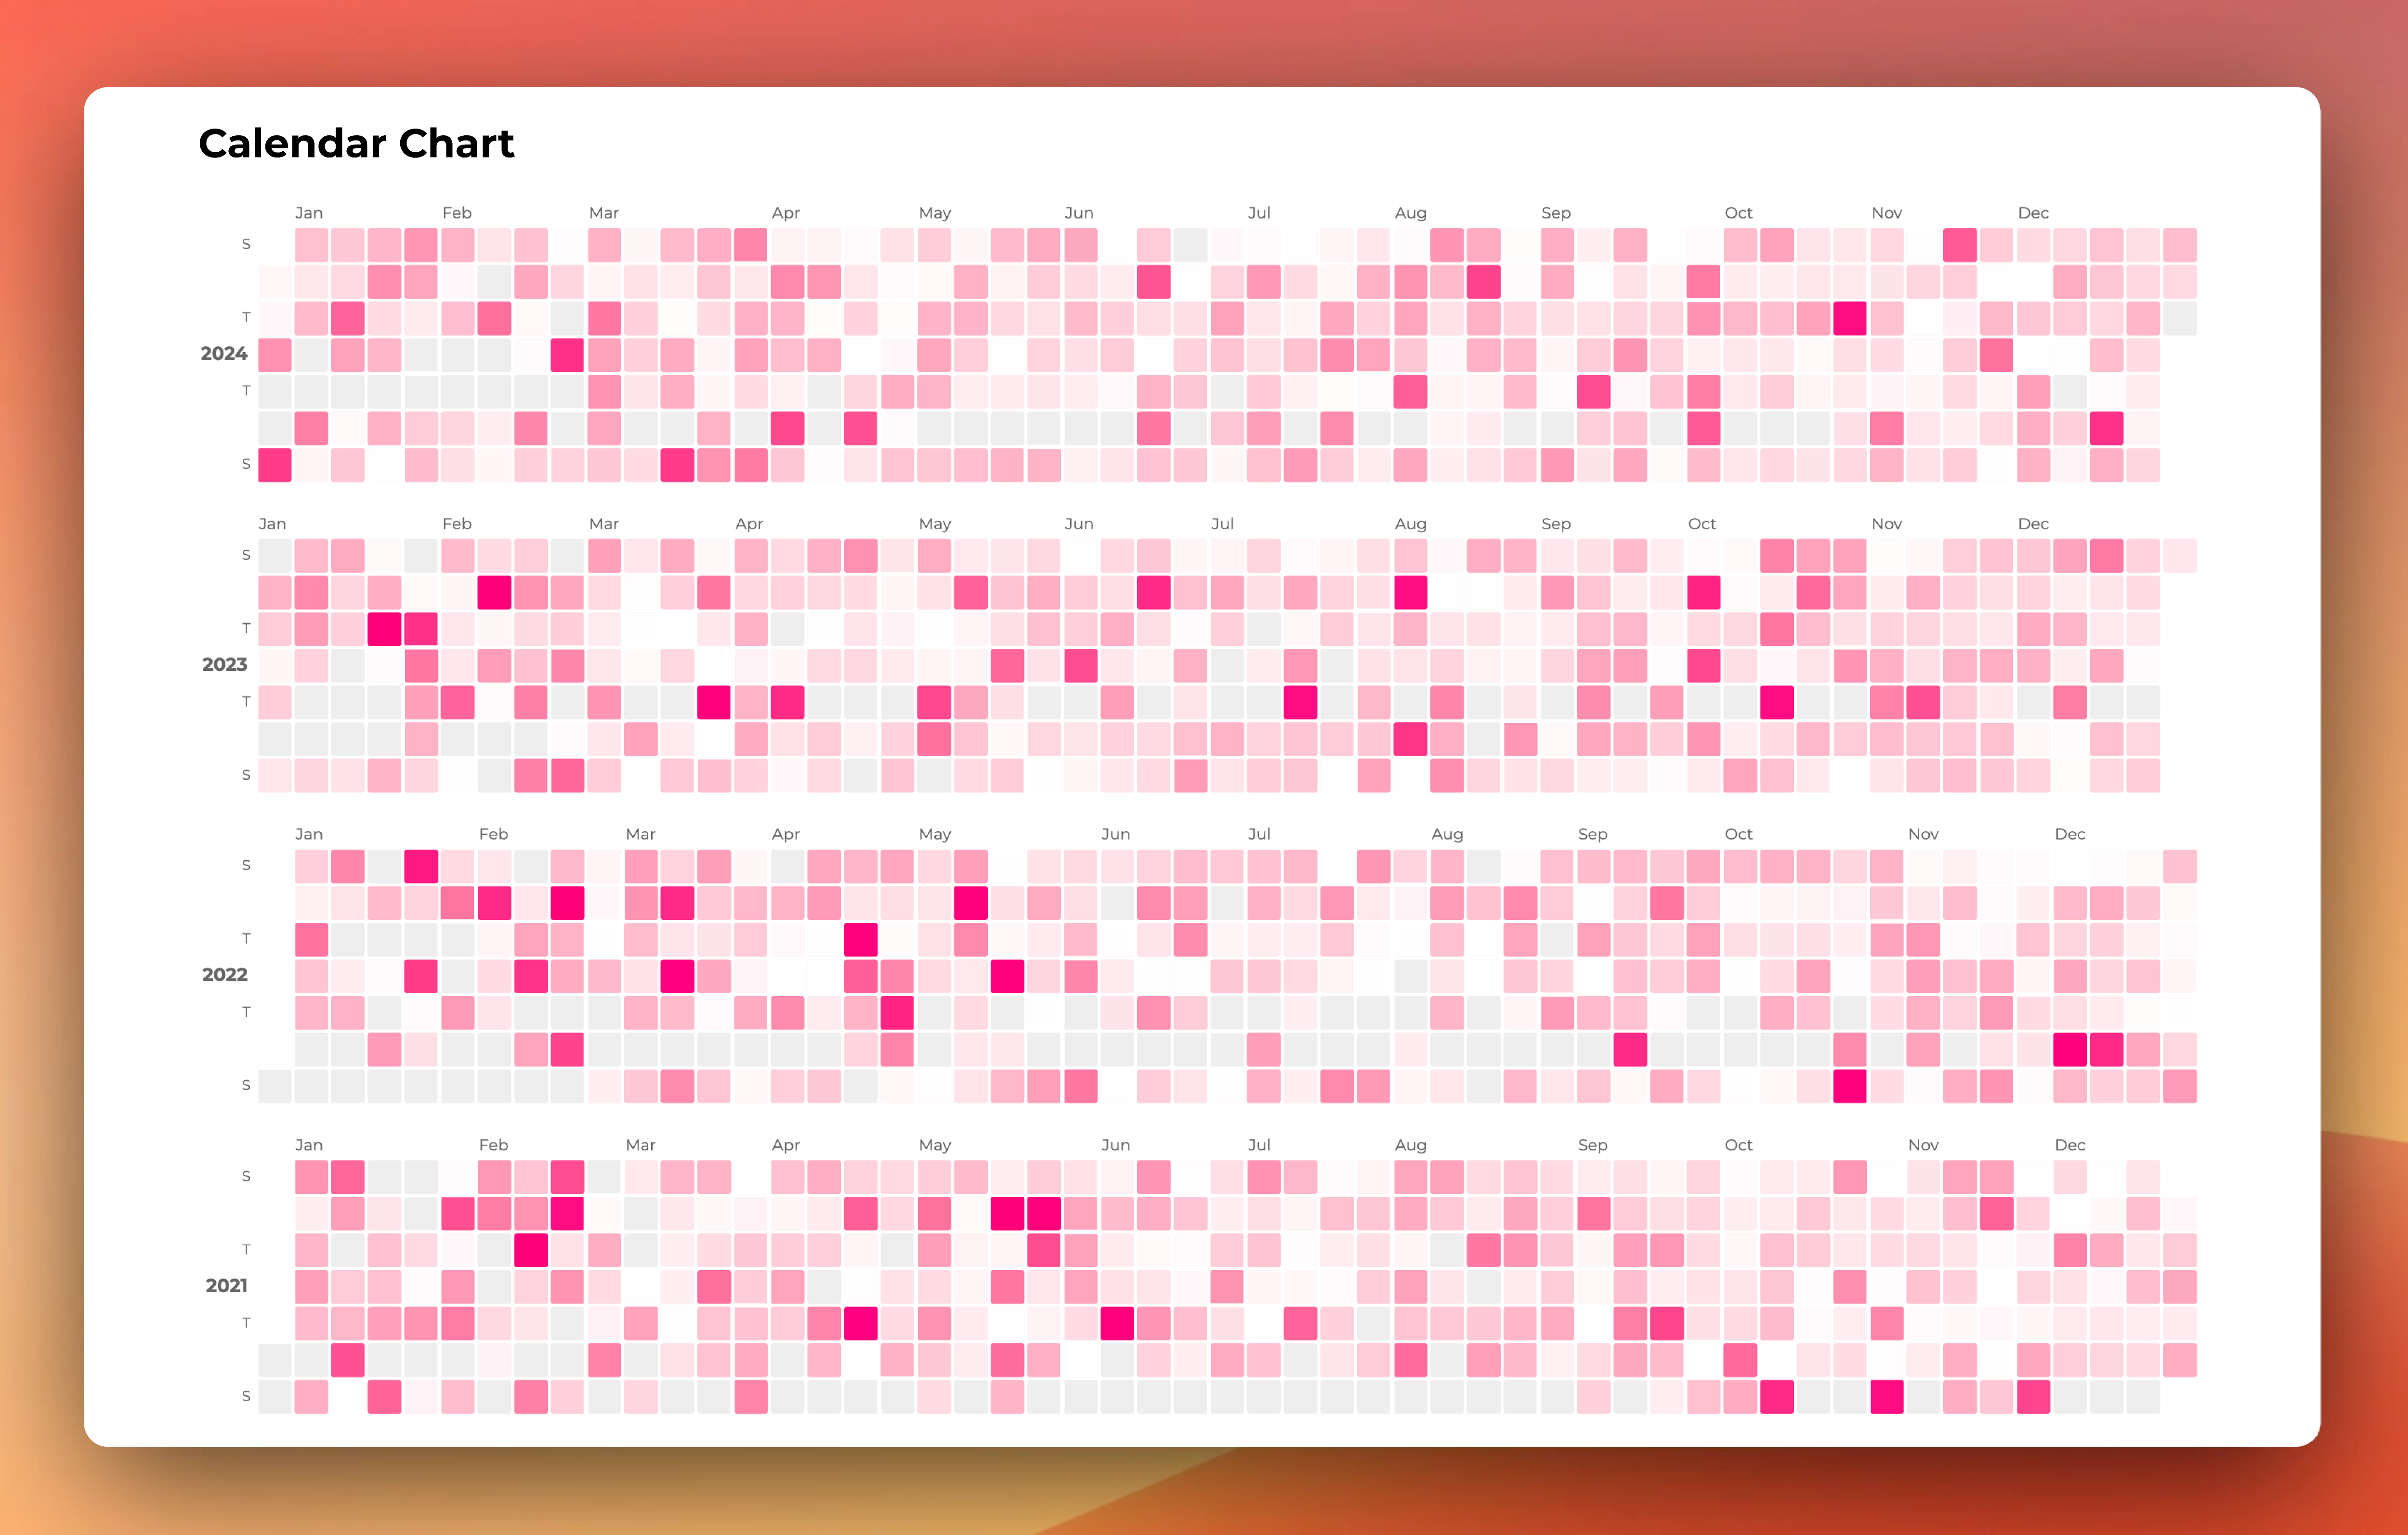
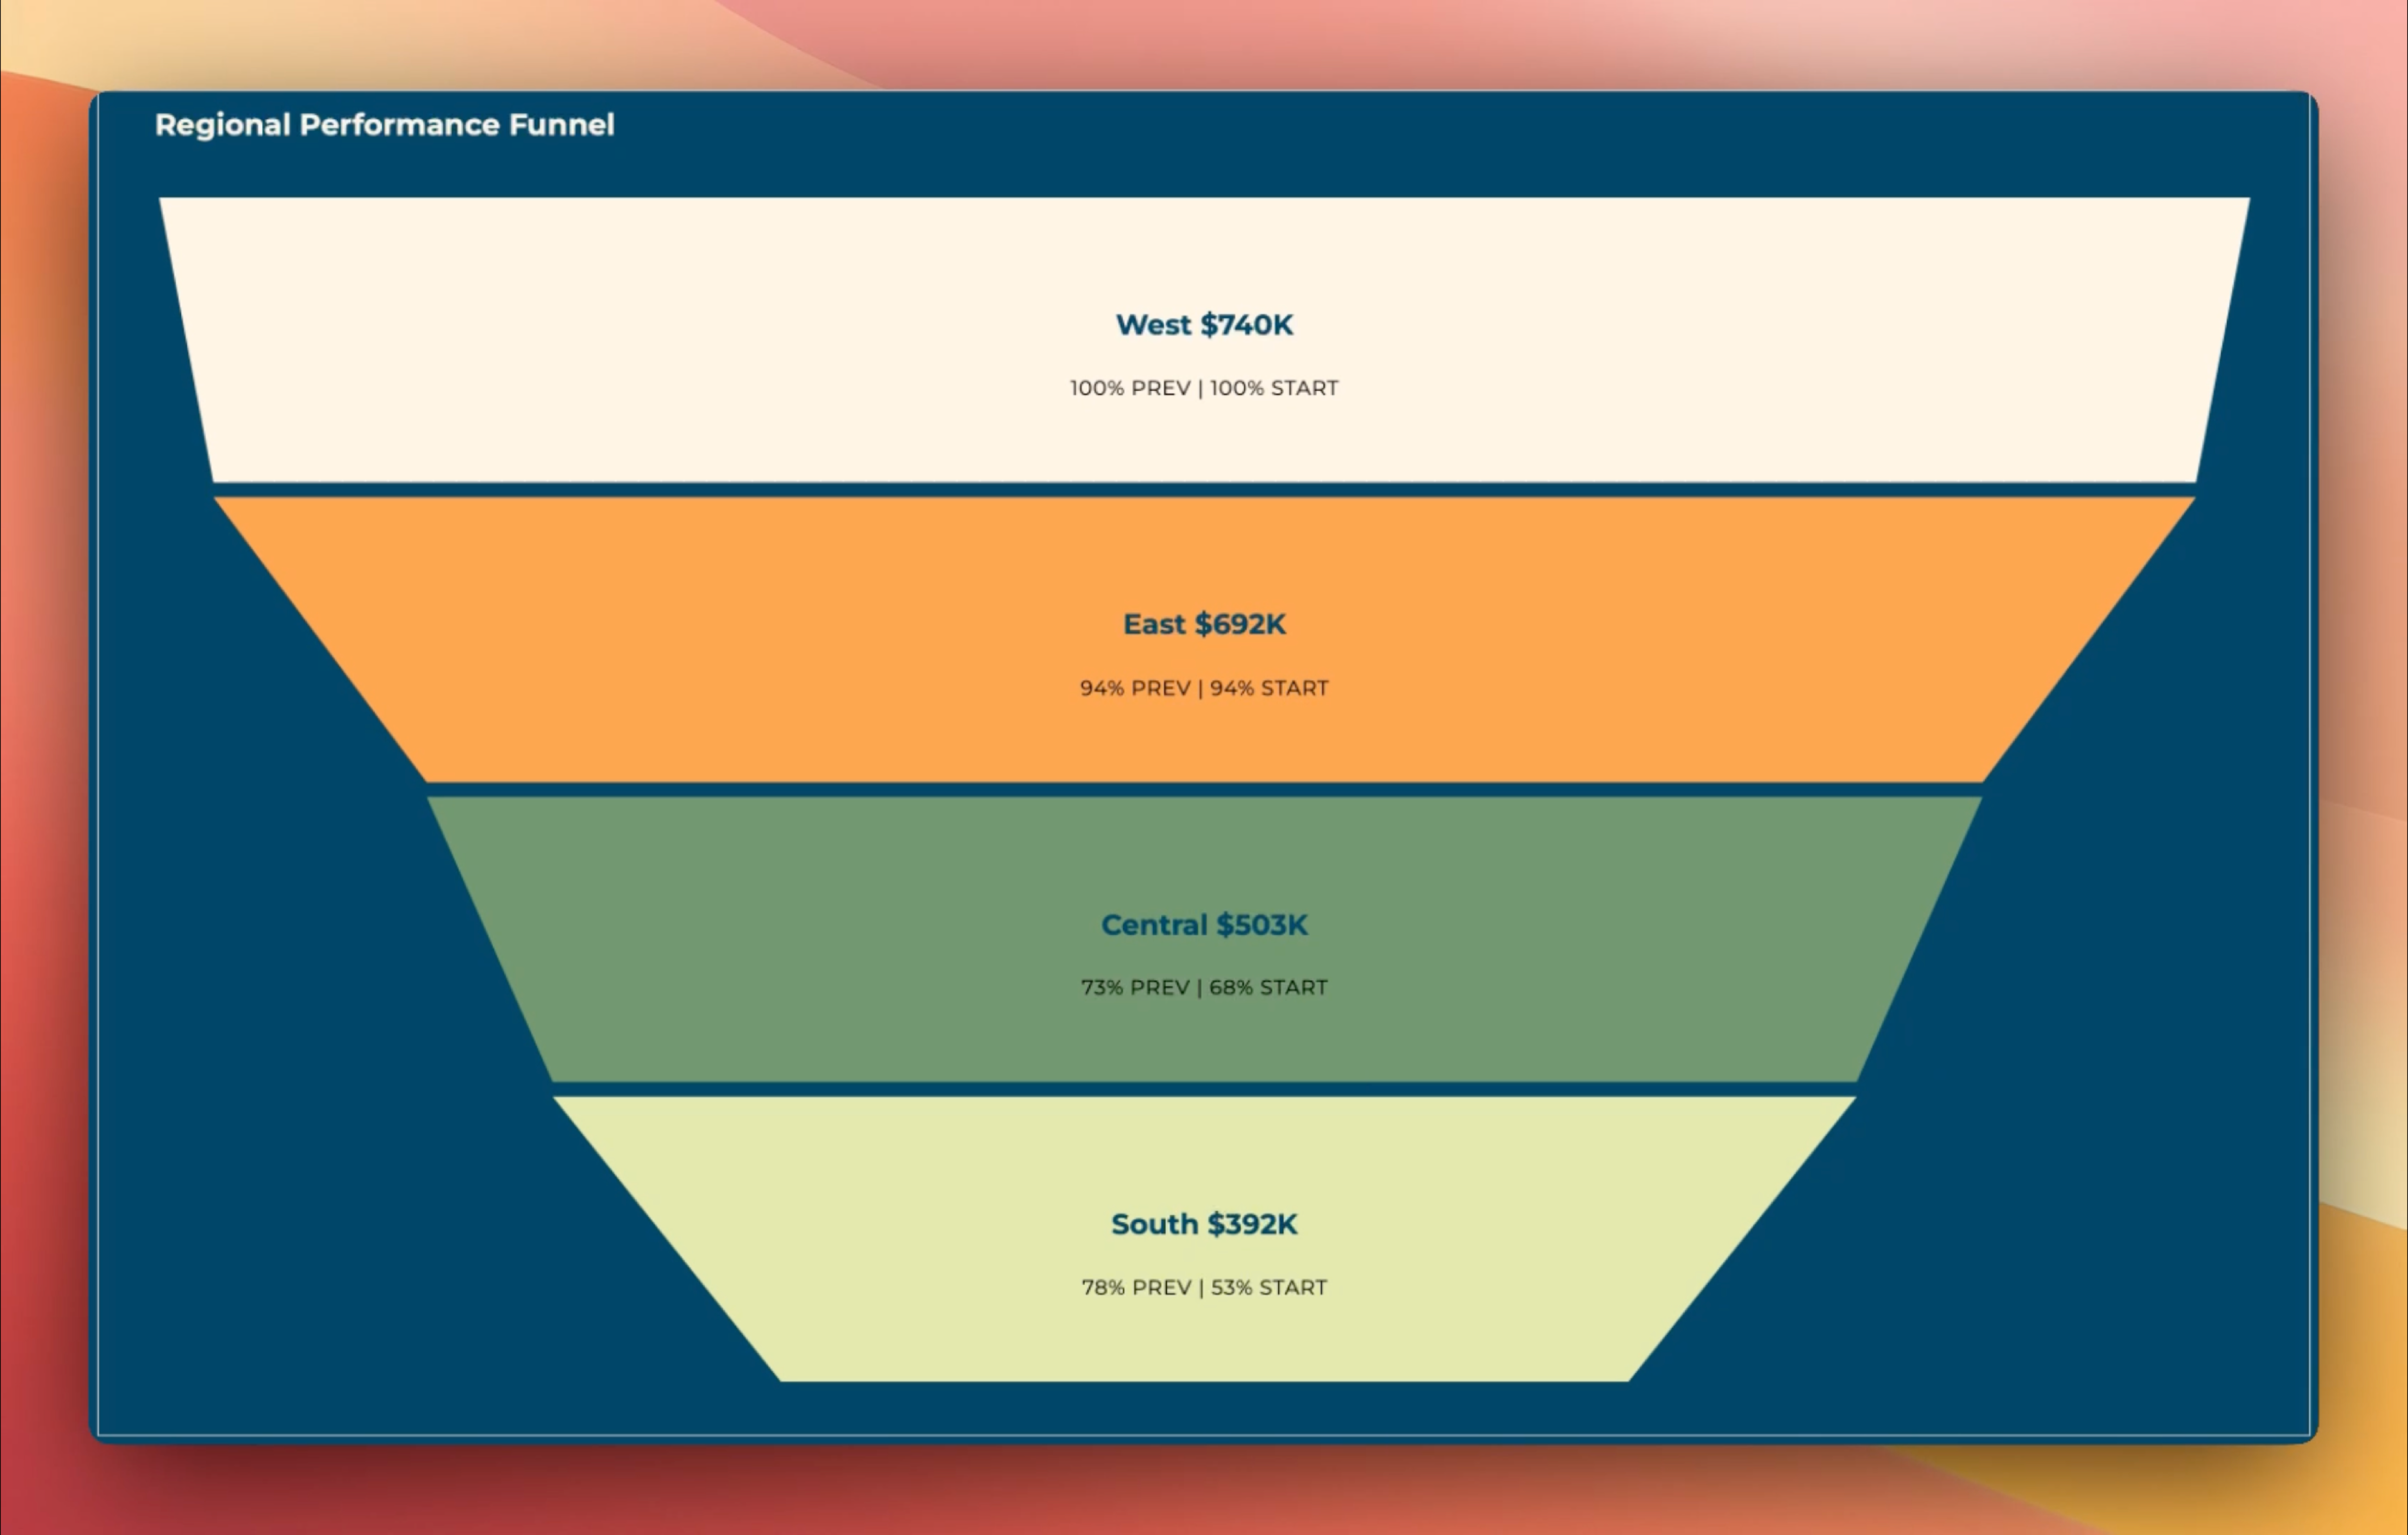
15+ stunning visuals

Inline filters standard in Supertables extension for Tableau Dashboards

Sankey Diagram

Visualize the flow of a measure over multiple dimensions. Start visualizing the flow of money through your organizations departments or see what paths your visitors enjoy on your website.

Inline filters standard in Supertables extension for Tableau Dashboards

Circular Sankey

Visualize the flow of a measure over multiple dimensions with internal loops. Sankey diagrams are a type of flow diagram in which the width/height of the arrows is proportional to the flow rate.

Inline filters standard in Supertables extension for Tableau Dashboards

Source Target Sankey

Display the flow of a particular set of data from its origin (source) to its destination (target).

Inline filters standard in Supertables extension for Tableau Dashboards

Waterfall Chart

Understanding the cumulative effect of sequentially introduced positive or negative values.

Inline filters standard in Supertables extension for Tableau Dashboards

Streamgraph

Highlight how category contributions evolve over time while preserving a strong visual rhythm. It is excellent for trend storytelling when the focus is relative movement and changing dominance across series.

Inline filters standard in Supertables extension for Tableau Dashboards

Network Diagram

Allows users to understand relationships in data easily. Network diagrams are composed of nodes, which are singular data points that are connected to other nodes through paths.

Inline filters standard in Supertables extension for Tableau Dashboards

Radar Chart

Visualize a persons characteristics or plot your department security assesment results in the characteristic spider web plot. Display multivariate data in the form of a two-dimensional chart of three or more quantitative variables represented on axes starting from the same point.

Inline filters standard in Supertables extension for Tableau Dashboards

Venn Diagram

Visually display all the possible logical relationships between a collection of sets (typically presented as a )circle. Within each set is a collection of objects or entities that all have something in common and when these sets overlap, it’s known as the intersection area.

Inline filters standard in Supertables extension for Tableau Dashboards

Chord Diagram

Visualizes the inter-relationships between entities and compare the similarities within a dataset or between different groups of data. The connections between entities are used to display that they share something in common.

Inline filters standard in Supertables extension for Tableau Dashboards

Sunburst Diagram

Show hierarchy through a series of rings, that are sliced for each category node. Each ring corresponds to a level in the hierarchy, with the central circle.

Inline filters standard in Supertables extension for Tableau Dashboards

Zoomable Sunburst

Show hierarchy through a series of rings, that are sliced for each category node. Each ring corresponds to a level in the hierarchy, with the central circle.

Inline filters standard in Supertables extension for Tableau Dashboards

Horizon chart

Horizon charts are alternatives to ridgeline plots and small-multiple area charts that allow greater precision for a given vertical space by using colored bands. These charts can also be used with diverging color scales to differentiate positive and negative values.

Inline filters standard in Supertables extension for Tableau Dashboards

Tree Diagram

maps parent-child hierarchies in a format users instantly understand. It is useful for organizational design, role mapping, ownership structures, and any tree-like governance model.

Inline filters standard in Supertables extension for Tableau Dashboards

Calendar Chart

Map daily values into month and weekday structure, making cyclical patterns visible immediately. It is ideal for activity monitoring, such as support demand, revenue cadence, or campaign response.

Inline filters standard in Supertables extension for Tableau Dashboards

Small Multiples

Split data into a grid of comparable mini-charts. Each panel keeps the same visual grammar, so users can scan differences in shape, turning points, volatility, and performance across segments. They’re ideal for executive dashboards where clarity and comparability matter.

Inline filters standard in Supertables extension for Tableau Dashboards

Funnel Chart

Turn stage-based data into a bold conversion narrative. A presentation-ready Funnel Chart built for stage comparison. Show values, retention, conversion, and target performance, while keeping flexible controls to match any dashboard style.

Key Features.

  • Coloring for labels, marks, borders and background

  • Advanced visual customization options
  • Dashboard Actions
  • Advanced formatting

  • Color Legends

  • Choose from ready-to-use themes

  • Export Viz to SVG

  • Auto suggest visuals for your selected data
  • Change between visuals at any time
  • Tooltips

  • Number formatting
  • No programming skills – just drag and drop

Data security klaus iso

Secure on-premises solutions.

Governance and Security are among the top priorities in developing Apps for Tableau Products. All products are available as on-premises solutions, and your data and user access is secured under Tableau’s governance.

Apps for Tableau is ISO 27001:2022 certified

FAQ.

Is Apps for Tableau ISO certified?2025-10-02T14:52:12+01:00

Yes! Apps for Tableau has officially achieved ISO/IEC 27001:2022 certification.
You can find the information about our data security here.

Does this product work on phone and tablet?2023-10-13T12:44:55+01:00

Yes!

How do I upgrade or install ShowMeMore?2023-09-14T09:27:15+01:00

We have an extensive installation guide provided here and you can find the ShowMeMore product guide here

How safe is the product?2024-02-28T16:59:47+01:00

Apps for Tableau products are safe and secure. Our products are penetration tested by an independent company every year, you can request the pentest report by contacting sales. Besides that, our on-premises subscriptions can run fully without the need of a internet connection. You can find more about data security here.

Does ShowMeMore work offline?2023-09-14T09:22:08+01:00

Yes, the on-premises version does not require an internet connection to work.

Can I request new features?2023-10-13T10:30:10+01:00

Of course! Our products thrive on customer feedback, feel free to contact us with your feature requests.

How often are updates released in the Extension?2023-09-14T09:24:03+01:00

Our release cycle is monthly, we do release hot fixes in between. You can find our changelogs here.