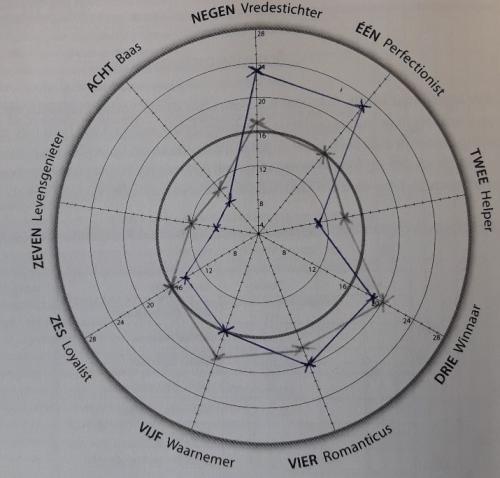
A lot of questions from the HR Department are difficult to answer with standard reports and sometimes even harder to visualize with standard Graphs. Visualizing competences, development of personal skills or the ability to perform certain roles can be pretty hard. You probably know the Radar Chart, a well suited Graph Type for the HR Department. In this blog Merlijn will share his experiences in creating a Radar Chart in Tableau to visualize his Personal Development. After reading this blog you will be able to use a flexible interactive Radar Chart in your Tableau Dashboards!

Visualizing my personal development in Tableau
Create the Radar Chart in out-of-the-box Tableau
Tableau Dashboard Extensions
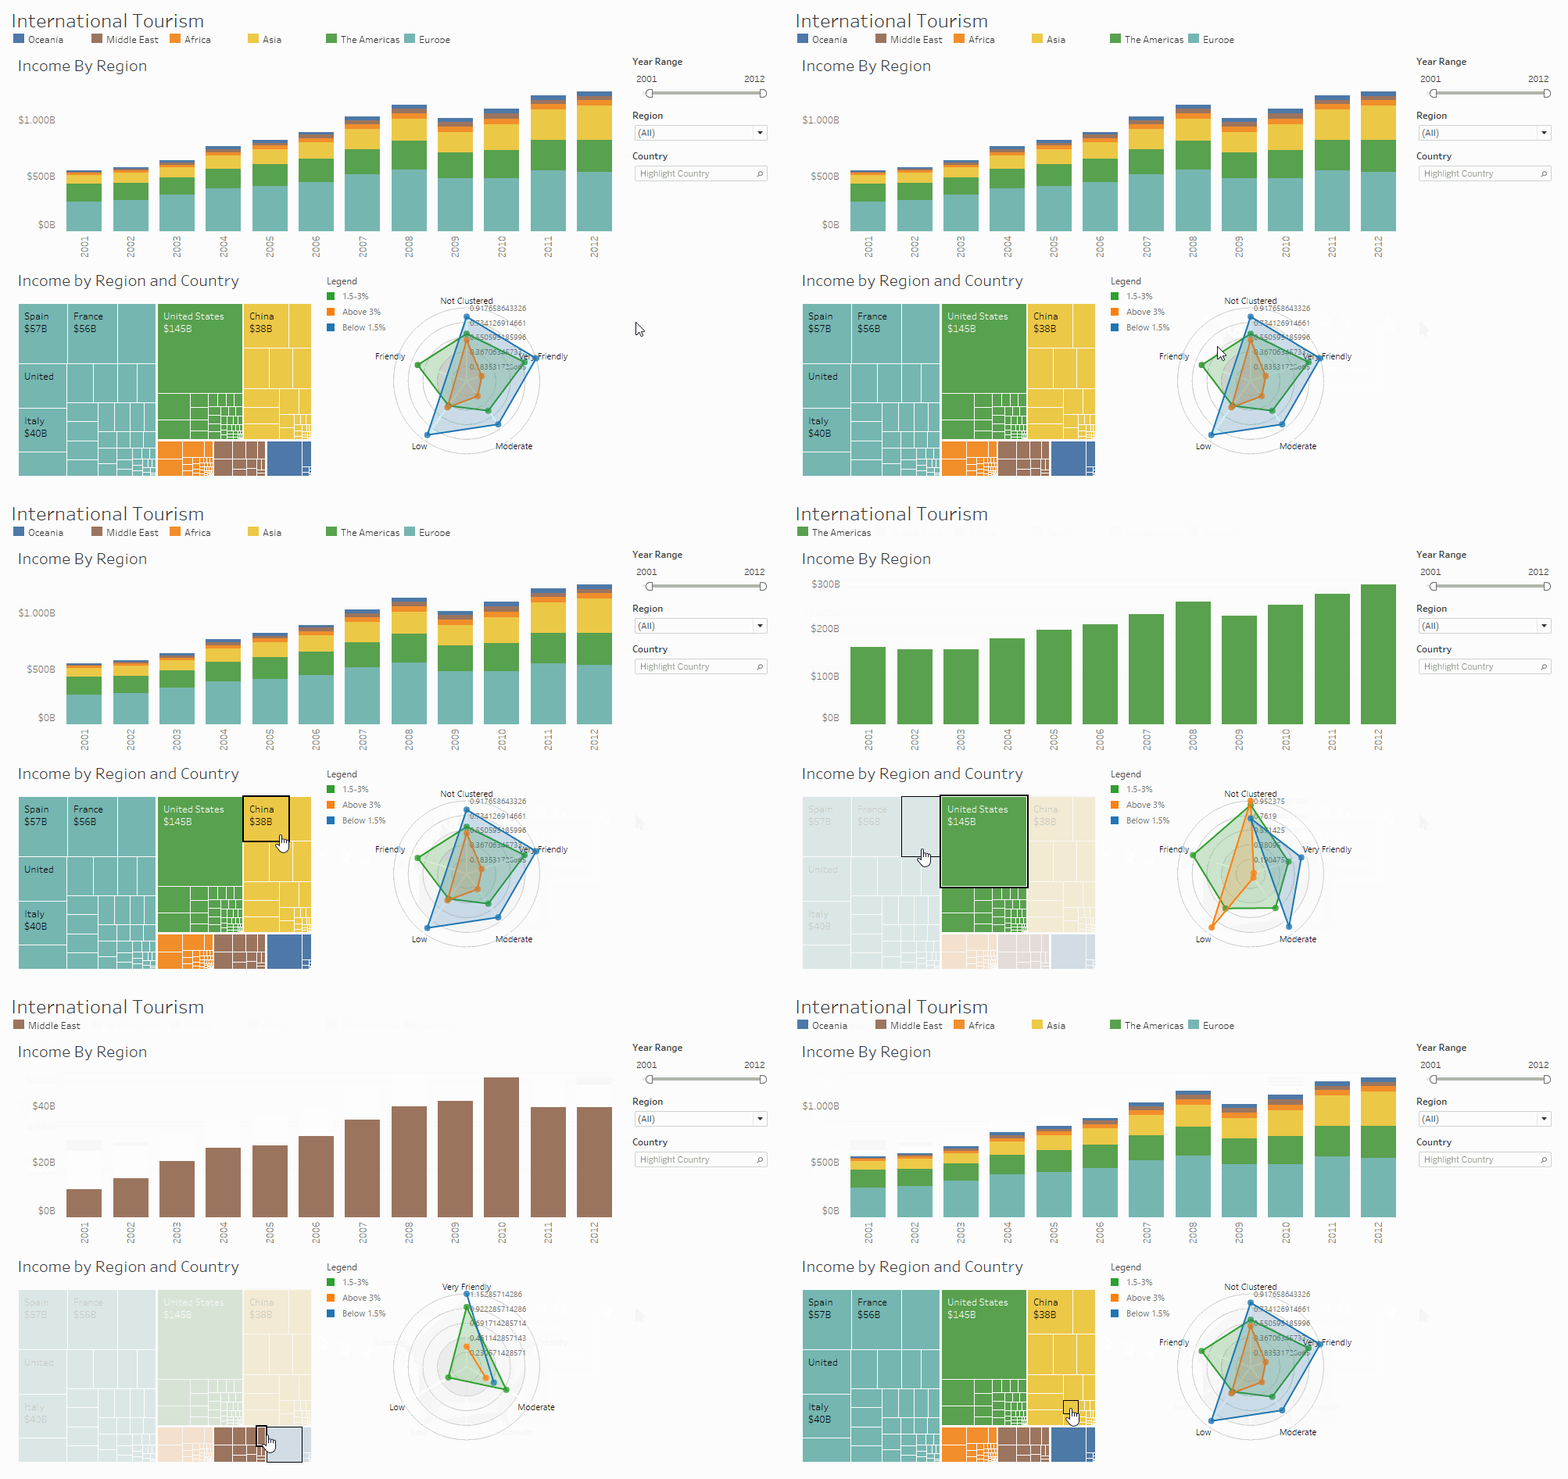
With the Tableau Extensions API one can interact with datasources and add new visualization types to your dashboards while still maintaining high rates of interactivity. With Tableau Extensions the ability arises to use web applications and data interactions from your Tableau Dashboards! The developers of Infotopics | Apps for Tableau created a new Extension to add more graph types to Tableau! We all know the “Show me” button in Tableau Desktop, this Tableau Extension Shows you More!
Show me More – Radar Chart in Tableau
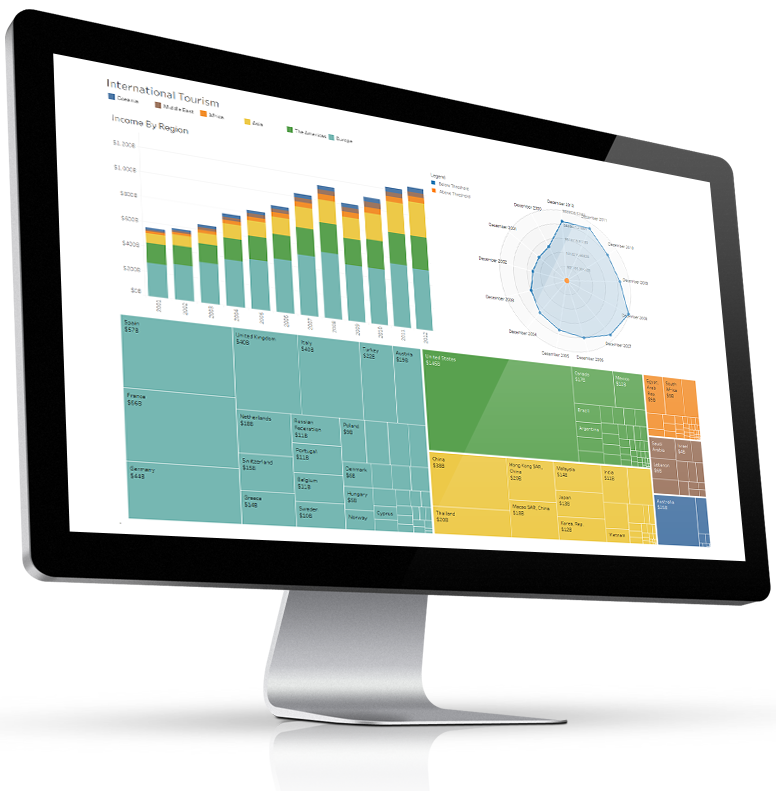
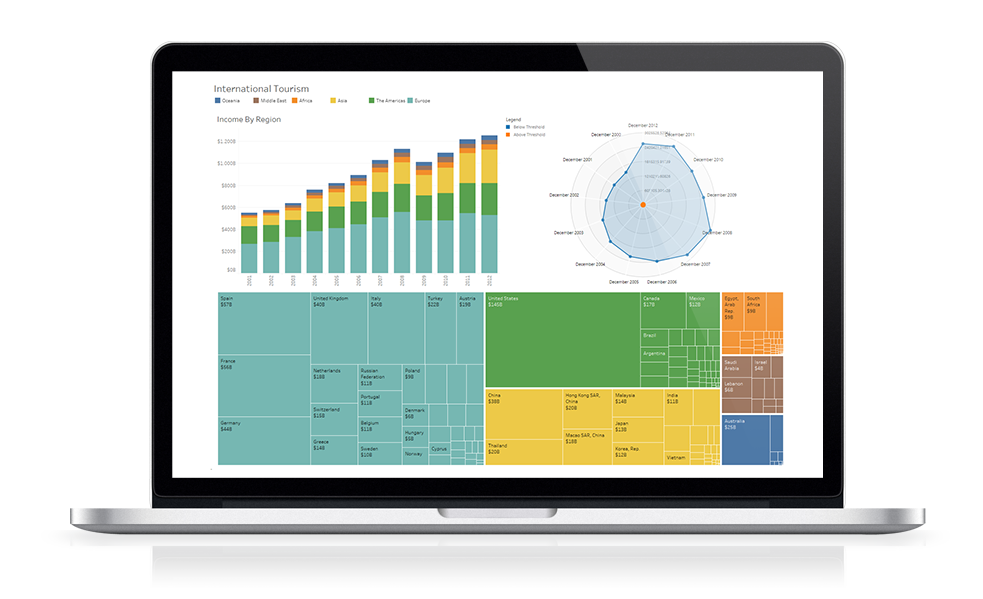
With the “Show me More” extension, adding a Radar Chart to a Tableau Dashboard is as simple as adding a Bar Chart. Beside the Radar Chart, you can also add a Sankey Diagram and several other graph types to your Tableau dashboards!
Radar Chart – Use Cases
I think everyone is familiar with a Radar Chart but not everybody knows when it’s best to use it. With this Graph type you can answer questions based on roles, responsibilities, skills and personal development. In one Radar Chart you can visualize:
- Who to trust responsibilities based on his/her natural role;
- Who to address responsibilities to grow in a role;
- What roles are missing in your team;
- What roles are overrepresented in our team.
Every Tableau user is familiar with the “Show me” button. As stated before, the Radar Chart is not incorporated as a visualization type within “Show me”. The use of Tableau Extensions enabled us to create a “Show me More” extension that incorporates new visualization types in Tableau that are not present in the standard “Show me” palet. With this Show me More extension in Tableau you only need a few clicks to embed a Radar Chart or Sankey Diagram in your Tableau Dashboard. It almost feels like cheating! It really is that easy. Are you interested in this solution or have some great ideas of your own? Make sure to Contact us!
We love to make solutions and help Tableau users to do things more efficiently. If you have feedback, ideas, questions or need support, please make sure to share it with us! Also, don’t forget to follow us on social media for our latest news and updates.


