In-Depth Analysis of Financial Performance in Government Institutions
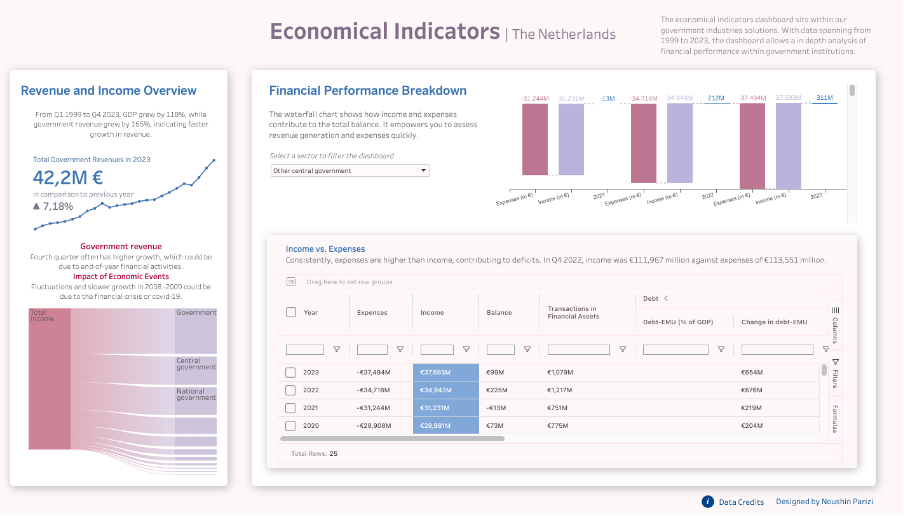
The economical indicators dashboard sits within our government industries solutions page. With data spanning from 1999 to 2023, the dashboard allows a in depth analysis of financial performance within government institutions.

Insights of Government Revenues
The dashboard gives an overview of total government revenues over the years and how much income is generated for different institutional sectors.
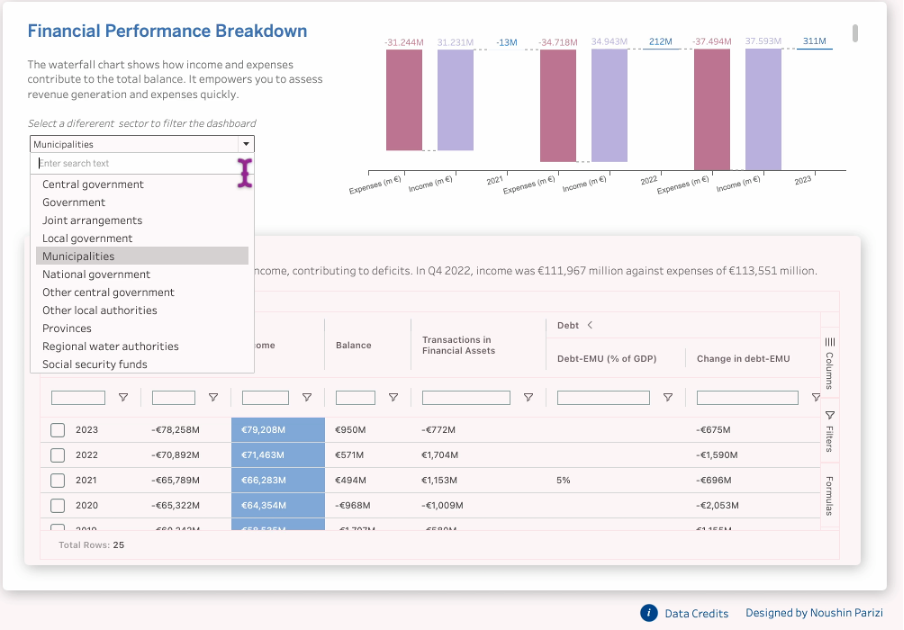
In the financial performance breakdown section, you can filter by government sector to view the expenses and income breakdown over the years with the waterfall chart and view detailed measures related to balance, debt and transactions in SuperTables.
• Total government revenues were 42.2M in 2023, which was a 7.18% increase from the previous year.
• From Q1 1999 to Q4 2023, GDP grew by 118%, while government revenue grew by 165%.
• Consistently, expenses are higher than income, contributing to deficits. In Q4 2022, income was €111,967 million against expenses of €113,551 million.
Extensions Used for Insights:

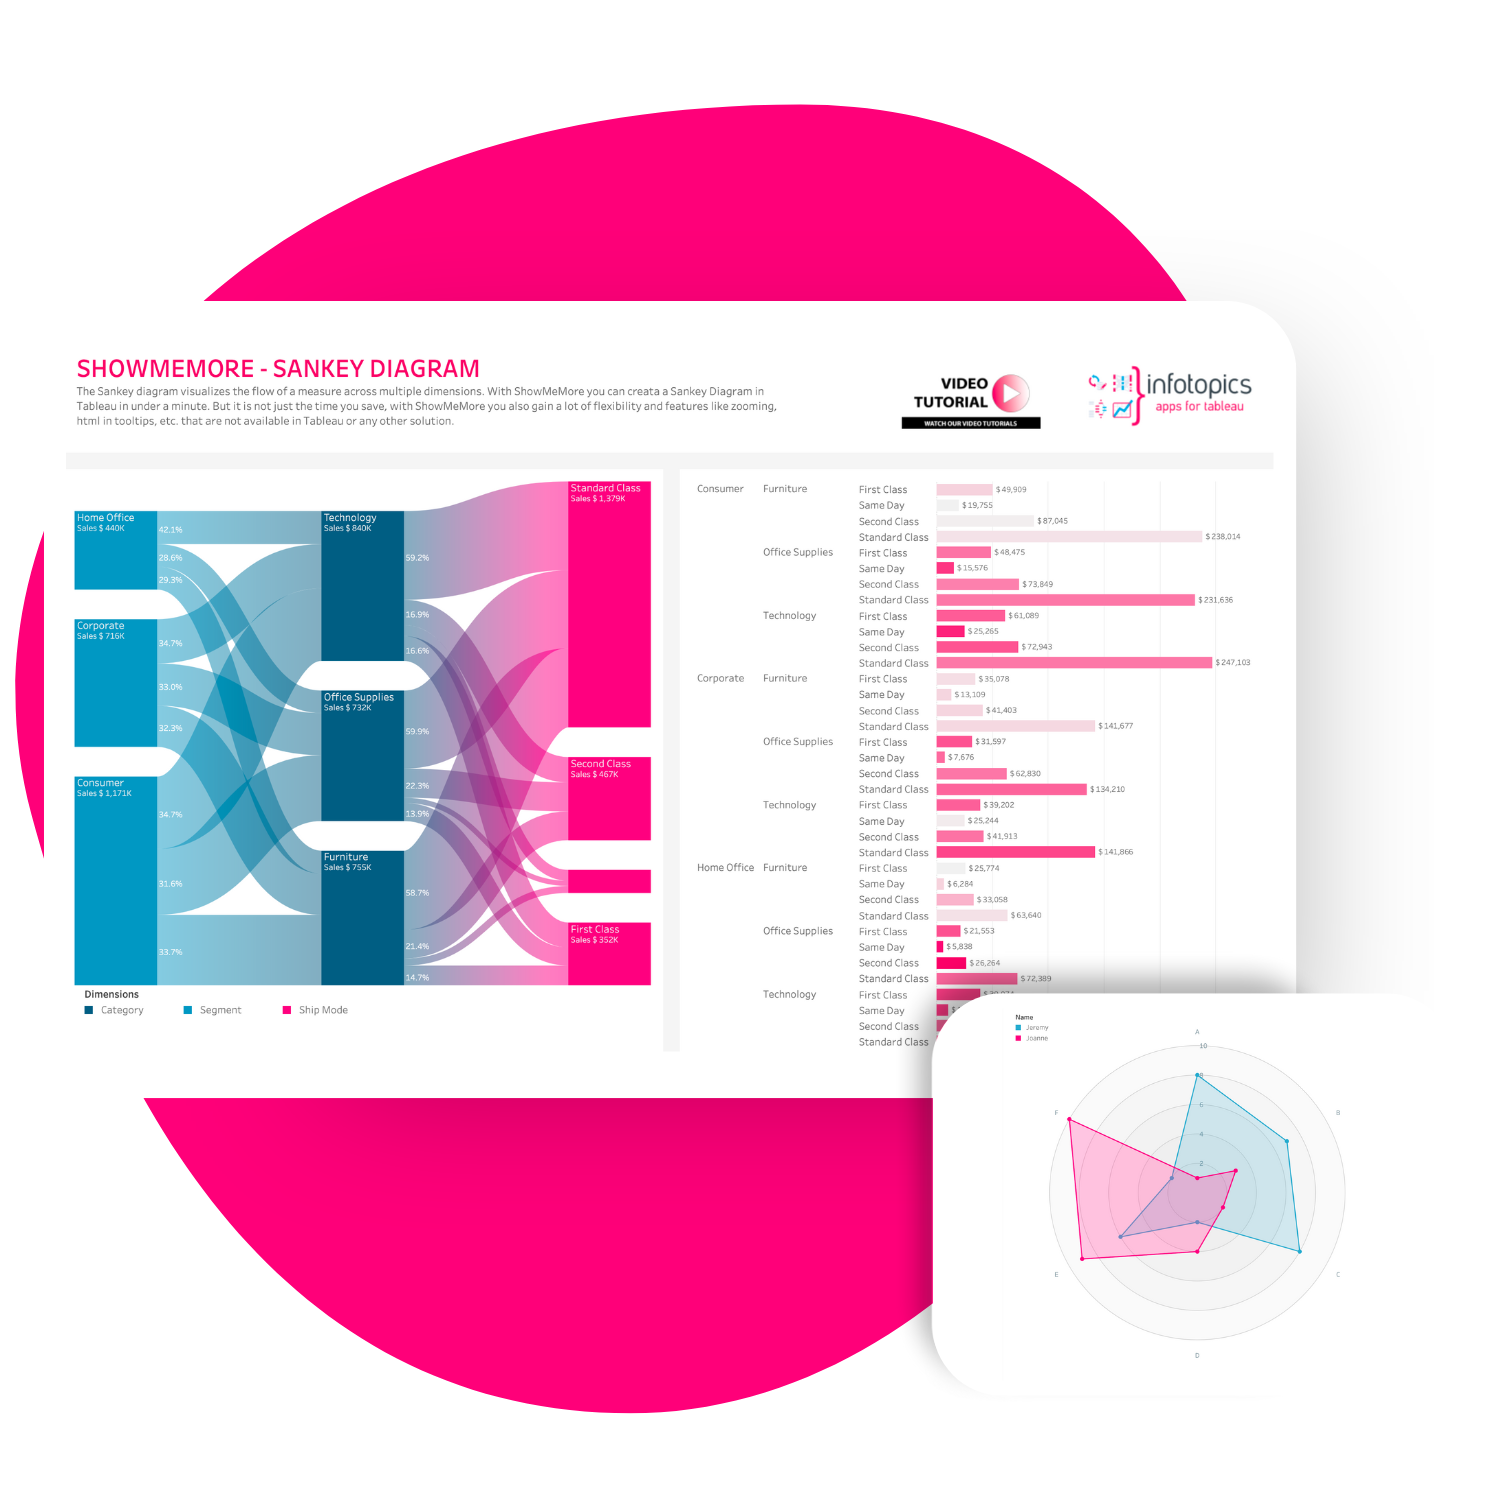
ShowMeMore – Proportion Analysis using Sankey Chart
The Sankey chart has been used to segment the different institutional sectors within the government and shows the proportion of income per sector. This has been incorporated into the dashboard very easily with the use of Extensions.

ShowMeMore – Expense and Income Analysis using a Waterfall Chart
The Waterfall chart allows you to view the financial information in a visual and hierarchical way. Here we can see the deduction of expenses and addition of income overtime.

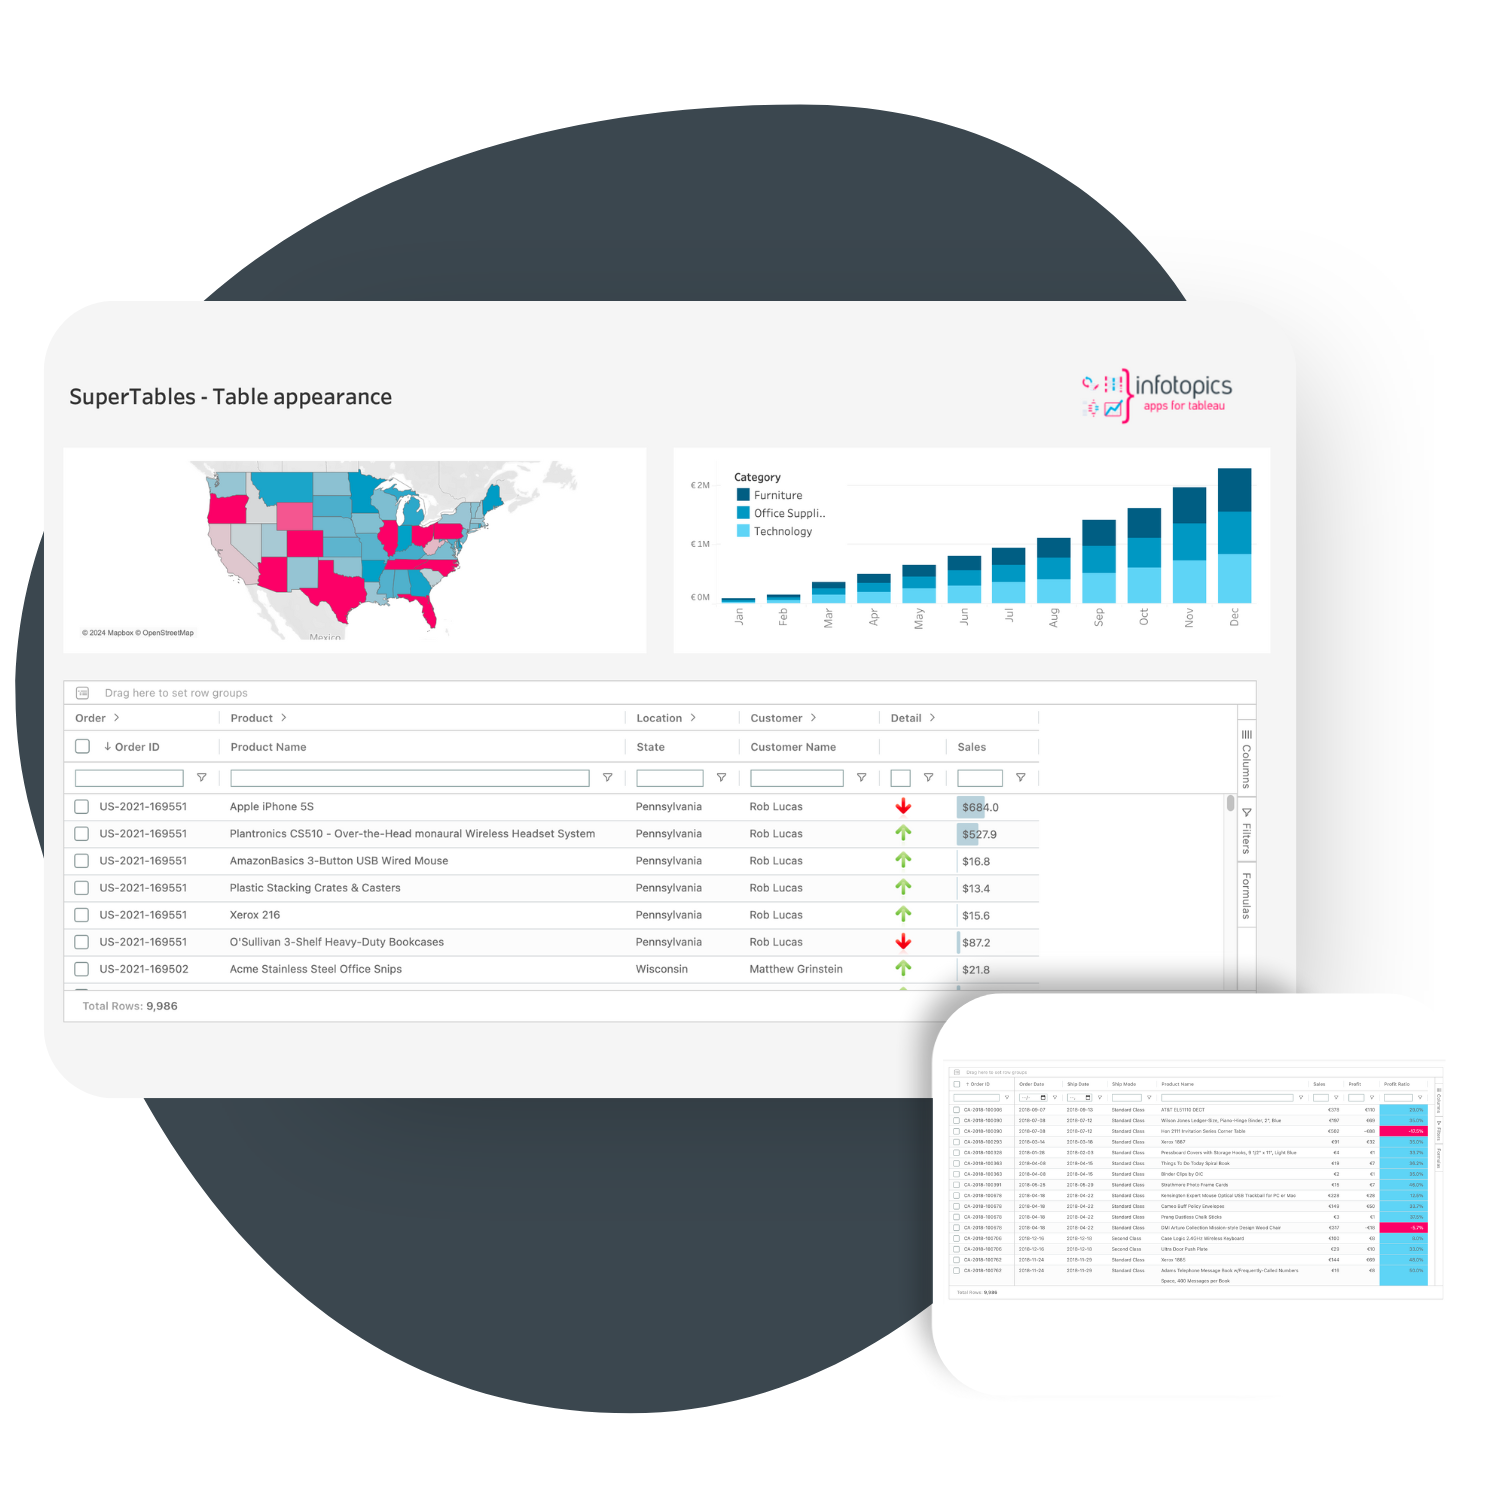
SuperTables – Crosstab Analysis using SuperTables
The crosstab section, shows metrics such as income, expenses, balance, transactions in financial assets, debt, changes in debt, and transactions in liabilities. You can filter based on a government institution and view a detailed information of the financial status.

