Next-level visualizations in Tableau and insights for more than 8k clients in just minutes.
Recon Analytics faced challenges in efficiently managing and delivering valuable insights to their clients. Their existing tools, primarily basic native charts in Tableau, proved insufficient for their needs. They realized they required a solution that could manage their various types of data and turn them into engaging visualisation in Tableau.
About Recon Analytics
Recon Analytics is a full-service research and consultancy group that serves the wireless and broadband industries. The Recon Analytics Pulse line of products is the fastest and most agile research tools available, allowing clients to generate actionable insights at-scale, within a fraction of the time required by traditional market research.
They are focused on managing and visualising extensive consumer survey data collected from 4000 wireless customers, 4000 home Internet customers, and 300 businesses on a weekly basis.
Discovering ShowMeMore
Recon Analytics’ goal was to create interactive and detailed dashboards that showcased the journey of their respondents. ShowMeMore provided the flexibility and depth they needed to visualize these complex customer pathways effectively.
Recon Analytics leveraged ShowMeMore’s Sankey flows, Radar chart, and Venn diagram to create visually impressive dashboards that captured the intricate nuances of their survey data. They combine and present data points from their diverse customer segments, enabling them to identify patterns, trends, and preferences. ShowMeMore empowered them to ask specific questions, dive deep into the responses, and present the findings in a visually appealing manner.

Saving time while creating scalable dashboards
ShowMeMore’s performance capabilities and on-premises data security met Recon Analytics’ high standards. Using this extension their data remained within their controlled environment, addressing concerns about data governance. The incorporation of the ShowMeMore Extension transformed the data visualisation capabilities, Radar chart and Venn diagram, they were able to create detailed and interactive dashboards that showcased the complex customer journeys. This enhancement in visualization capabilities allowed Recon Analytics to tell compelling data-driven stories, impressing both internal stakeholders and clients.
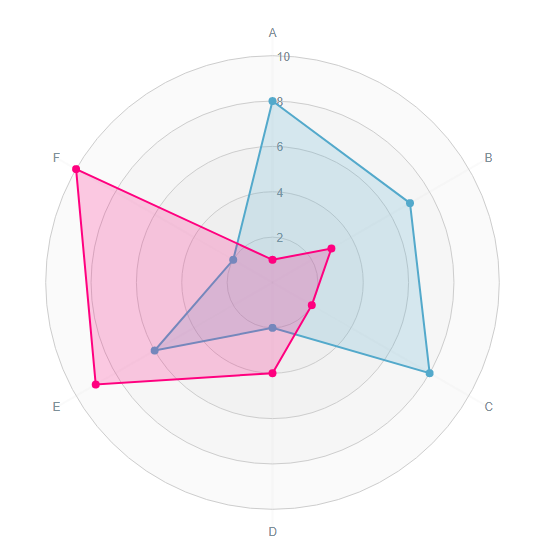
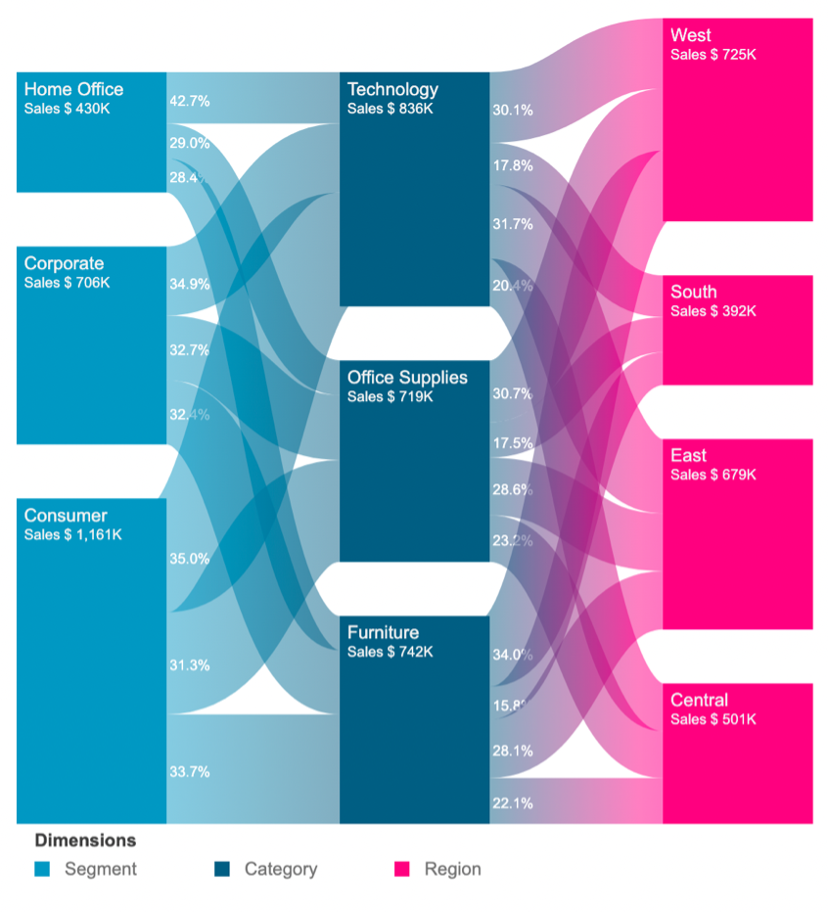
*This is an example of the Radar and Sankey Charts

“We showed some dashboards with the ShowMeMore Sankey Flows in it, and people said these are the best, most impressive dashboards that they have ever seen.”
– Roger Entner, Founder of Recon Analytics Inc.
A Seamless Experience
The ShowMeMore Extension not only met Recon Analytics’ specific use case but also opened doors to new possibilities in data visualisation in Tableau. The Extension’s flexibility, performance, and security features transformed how Recon Analytics approached their data analysis. ShowMeMore contributed significantly to their decision-making processes and reinforced their reputation as providers of cutting-edge consumer insights.