Making impact with dynamic images in Tableau Dashboards
PictureThis is a secured premium Tableau Extension. It enables users to create dynamic image tables from their data and use them to filter their dashboards. Desigual found huge value in the PictureThis Extension through visualizing their articles with images instead of text and through facilitating the data analytics process for end-users.
Desigual
Desigual is a Spanish fashion company, founded in 1984. It is a multi-category and multi-channel company. It designs, distributes, and sells 6 product categories through 10 channels in 107 countries and more than 428 stores. Desigual operates globally with offices in 15 countries and thousands of employees.
Visualizing Products
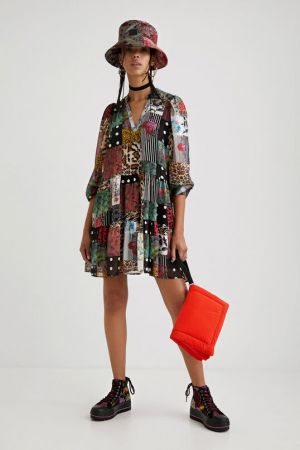
Every article in Desigual is different and can be identified with a unique code. However, to identify an article correctly, the end-users need to see a visual ID, as the codes can be difficult to interpret. For hundreds of users it is very time-consuming to find the right article. Finding a solution to this issue is what led Desigual to PictureThis.
Prior to PictureThis, Desigual used Excel Reports. To become a data-driven company, Desigual moved its data analytics to Tableau and needed to find a suitable solution to visualize its products.


Images of articles
With PictureThis, Desigual managed to create some really nice interactive dashboards with the images of the articles. One of the most used dashboards ranks the weekly and daily sales by article with the images of the articles included. Once the article is selected, a secondary table opens where users can see how this specific article is performing in each store. Furthermore, if they select the store, they can see what sizes are available in that store.
“PictureThis has helped many teams in Desigual to save time when analyzing data in Tableau. The customer journey we experienced at Infotopics | Apps for Tableau was really satisfying. We received all the help we needed to ensure the perfect perfomance of the Extension!”

