Documentation
SuperKPIs – Features, customization and optimization
SuperKPIs Features
Drill-Down / Slice & Dice
By default our templates are designed to have twelve independent KPI Cards.
But there will be use cases, where you want to drill-down one or several KPIs on one, two, or more dimensions.
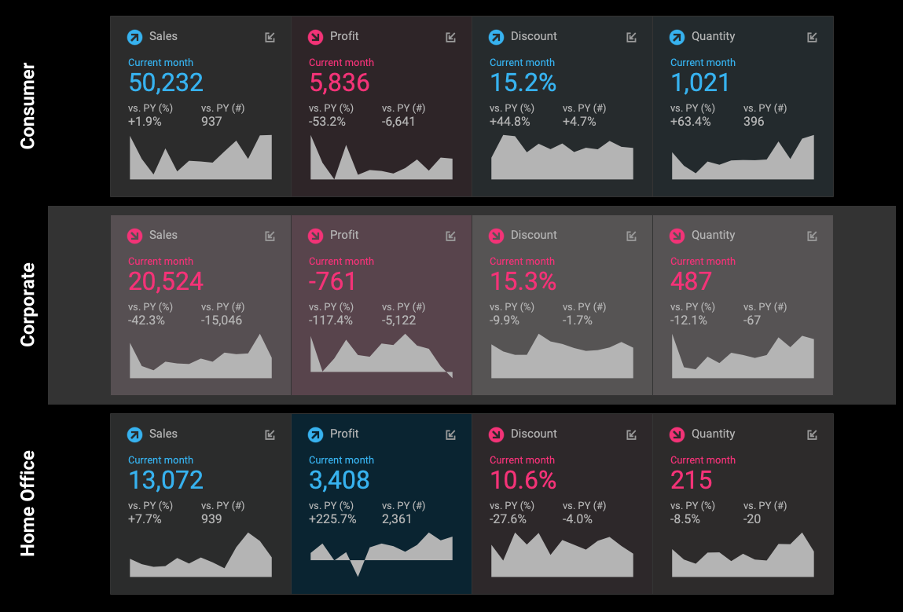
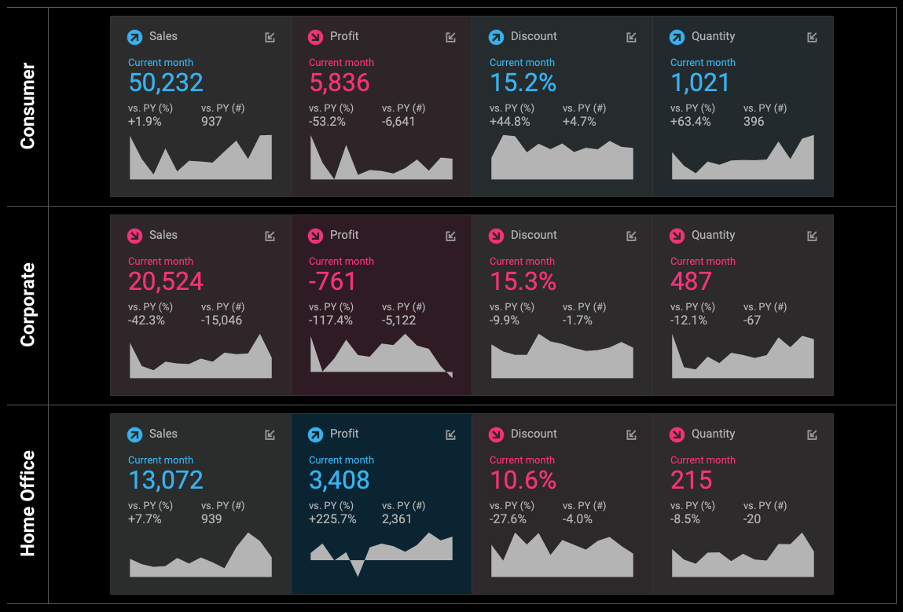
Drill Down one Dimension
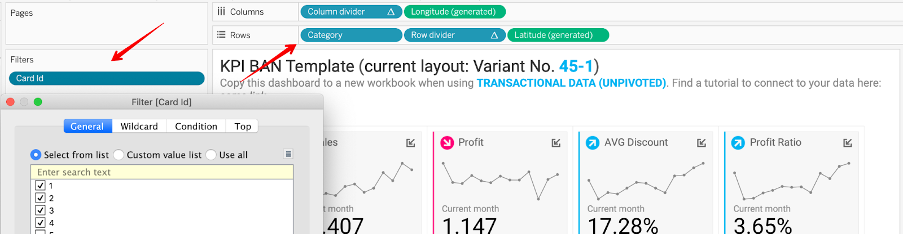
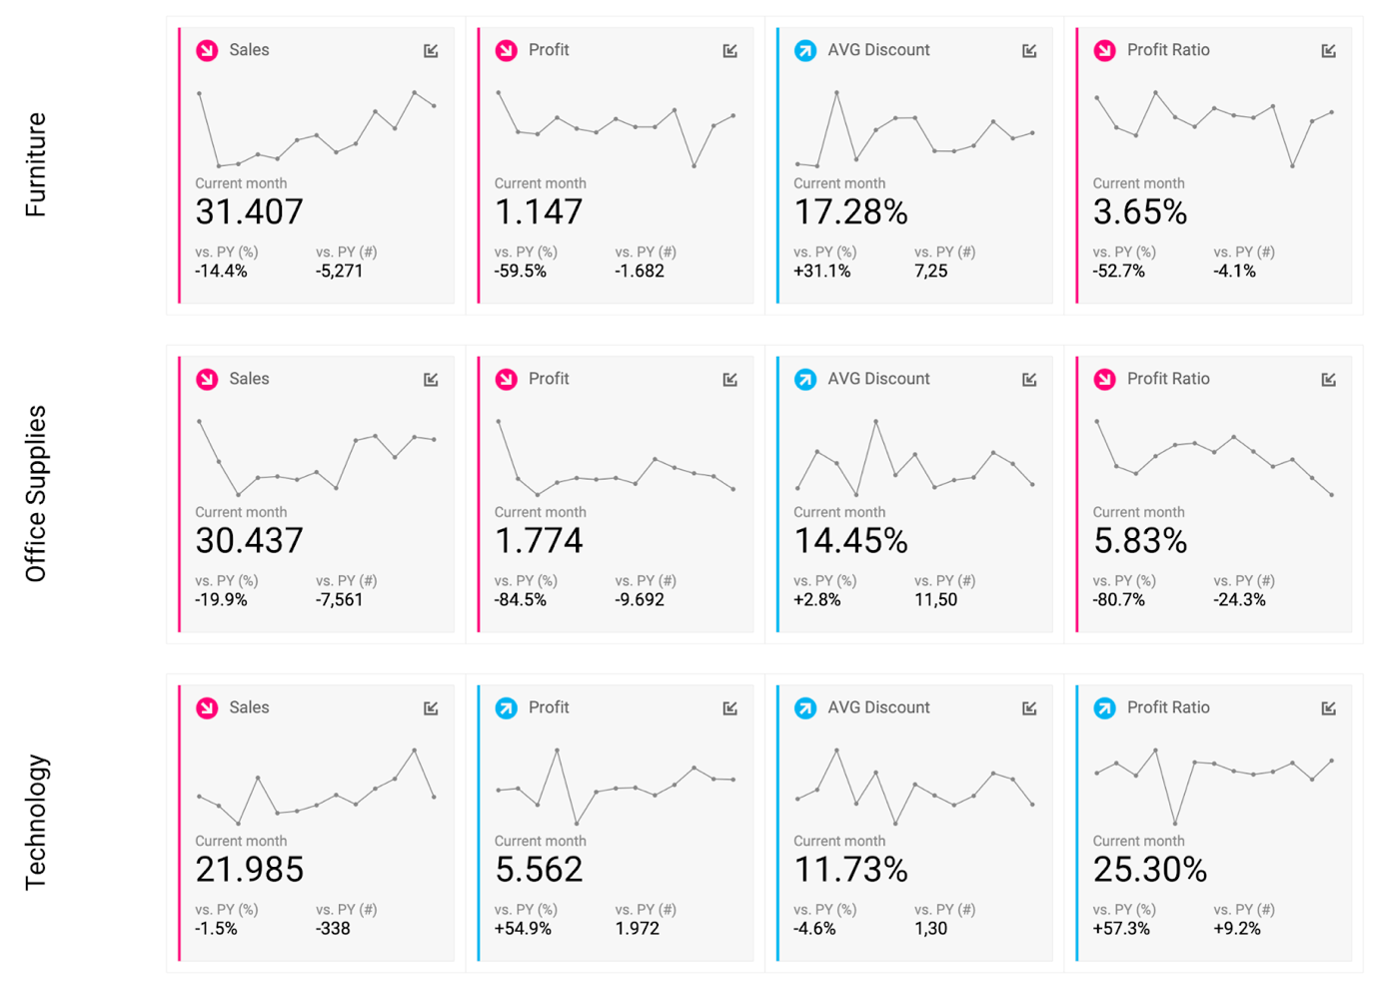
Add a dimension to columns or rows to break down your KPIs.
In this example, KPI Cards have been filtered down to cards 1-4 using the Card Id field and the four KPIs have been broken down by Category.
Drill Down two Dimensions
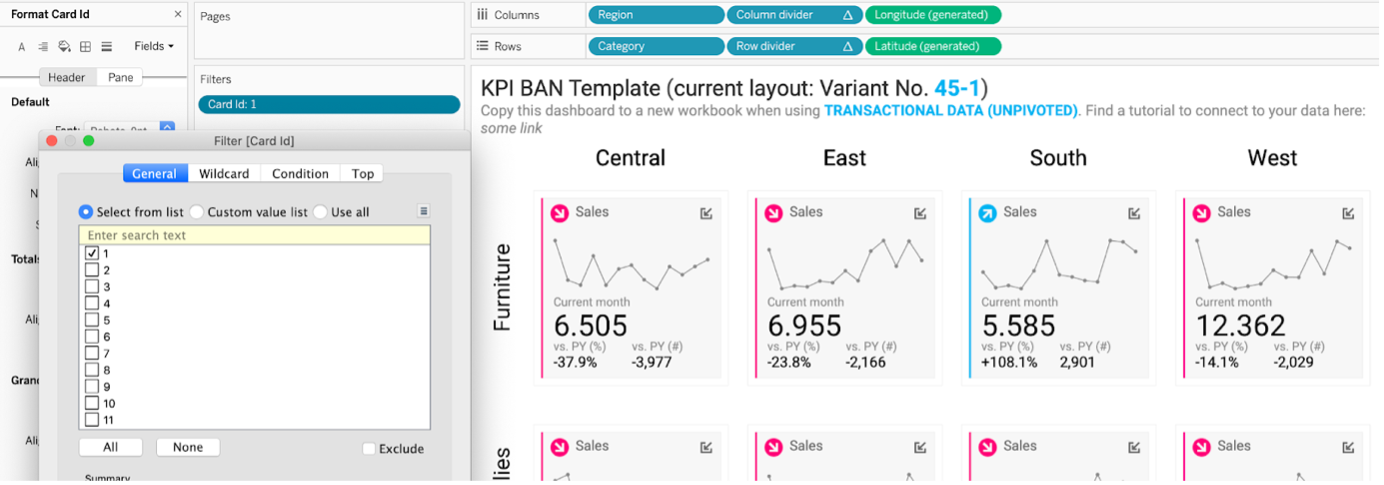
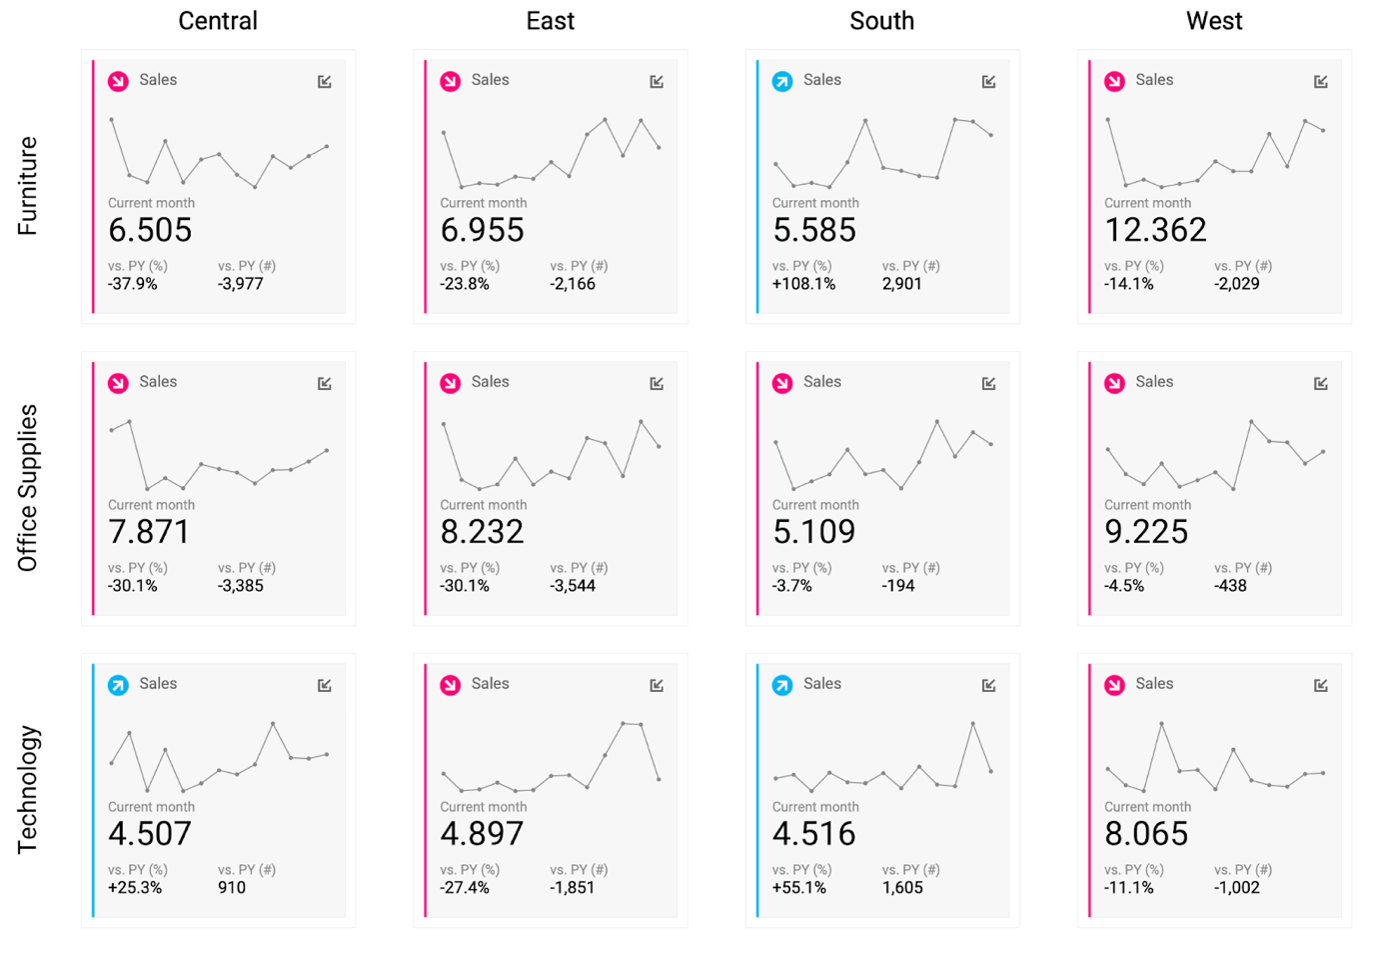
Add a dimension to columns and rows to break down your KPIs.
In this example, KPI Cards have been filtered down to Card Id 1 and the four KPIs have been broken down by Category and Region.
Tooltips
You can also add tooltips to every component/layer of the KPI cards.
By default, tooltips are only implemented for the tooltip icon at top right of each card. If you want to add tooltips for more components, enable selection for the respective layer first:
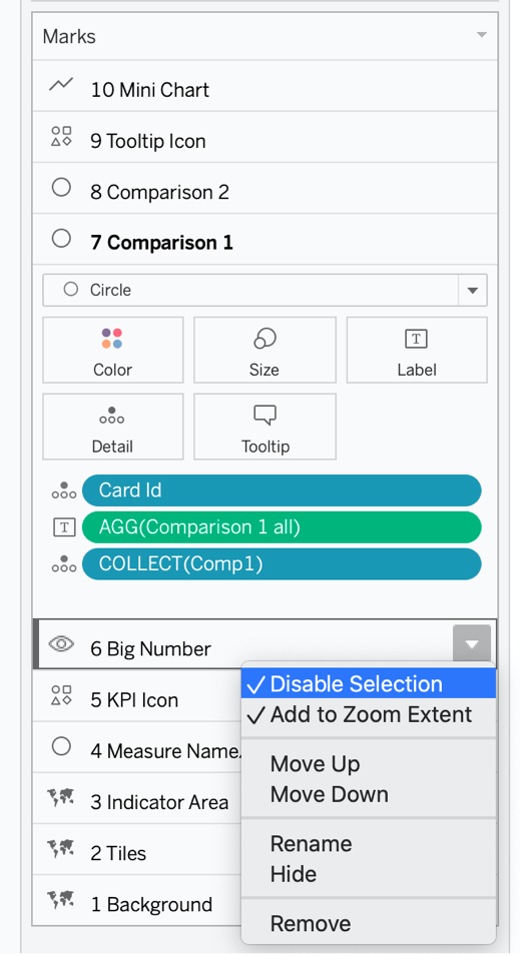
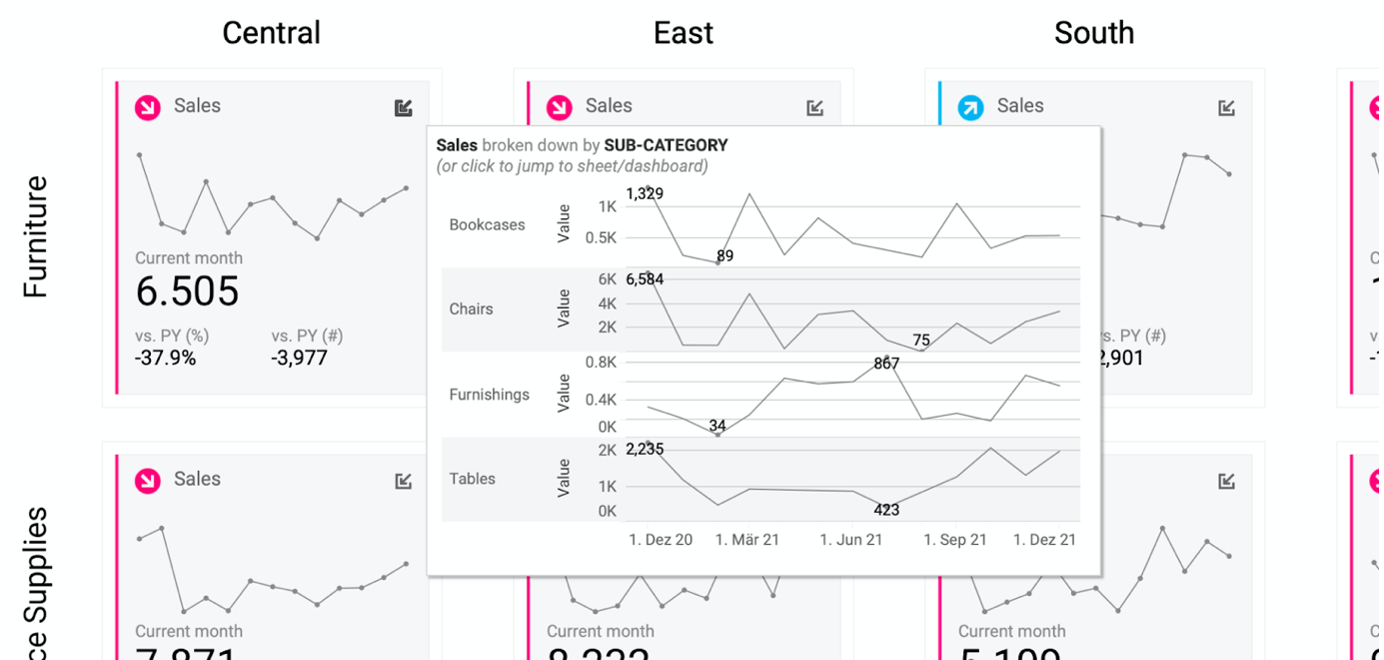
Then design tooltips to your preference, or add viz-in-tooltips to (further) break down the viz. Card Id (at minimum) has to be the variable to filter the visualization for the tooltip on. Add more fields in the viz-in-tooltip filter as needed.

Dashboard Actions
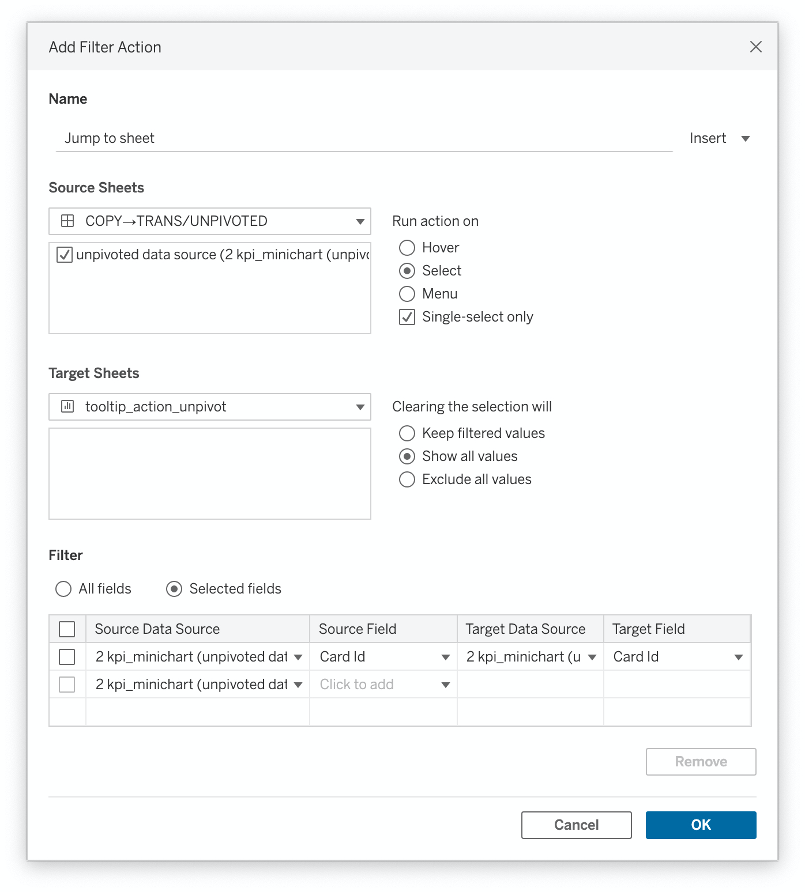
Instead of viz-in-tooltips, use Dashboard filter actions to jump to separate sheets or dashboards, to further drill into the KPI you’re looking at. Card Id (at minimum) again is the field that has to be implemented on all sheets/dashboards.
Filter SuperKPIs
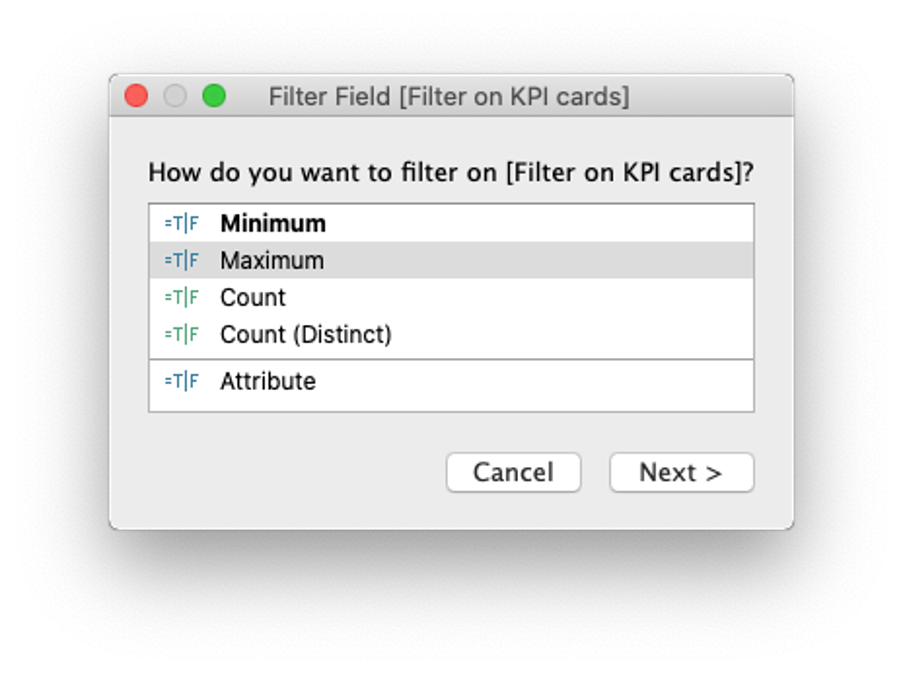
All templates are shipped with a pre-defined field to filter KPI cards on negative/positive deviations, to draw attention to where attention is needed.
The Filter on KPI cards field follows the business logic defined in the Color_any object field.
For the minichart templates, set Filter on KPI cards to “Maximum” when you drag it on the filters shelf.
Sort KPI cards
You might want to sort your KPI cards.
Choose one of the responsive variants (Grid Type = ‘flexible’) and set manual or variable sorting based on any field in the Card Id dimension.
User specific KPIs
Enable user specific KPI Cards
If you want to have different KPIs for different users, join your data table with a respective user table that includes the user’s Tableau Server/Tableau Online user name.

tIf you want to have different KPIs for different users, join your data table with a respective user table that includes the user’s Tableau Server/Tableau Online user name.
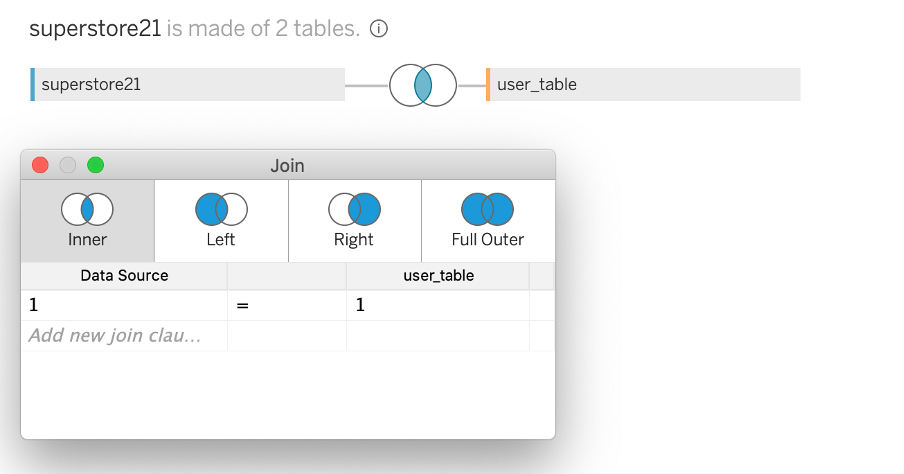
Then do the user specific mapping in the relationship calculation.
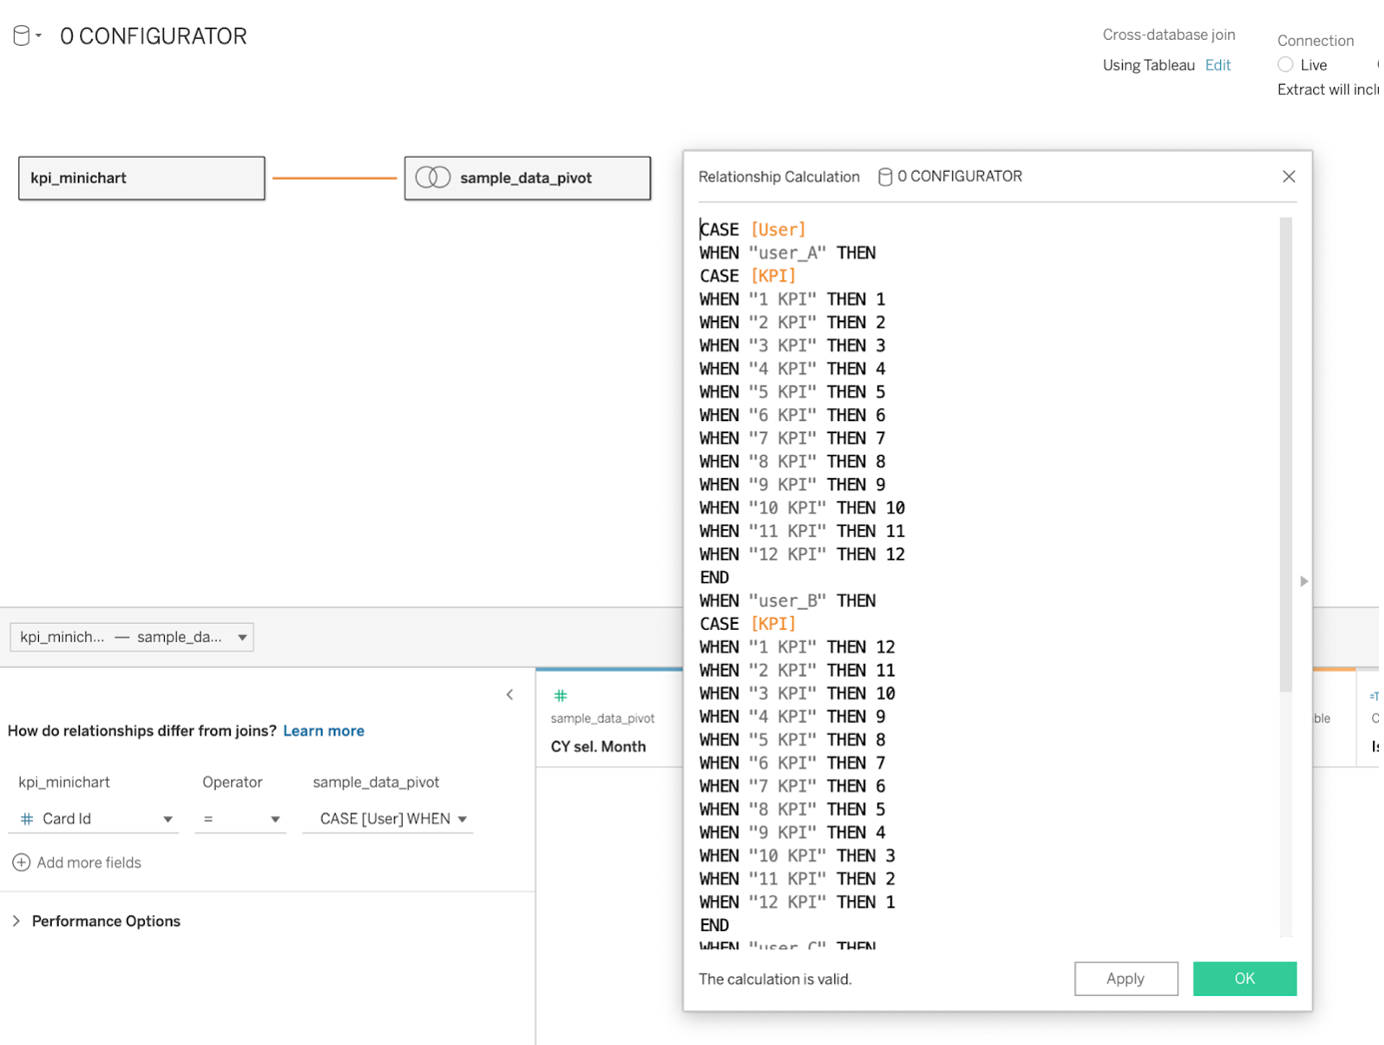
Make sure to implement a data source filter on user = username(). This way only data for the current user gets queried.
Implement user specific KPIs
When working with user specific KPIs in Template A, create consolidated fields first and then replace references from the sample data to these fields.
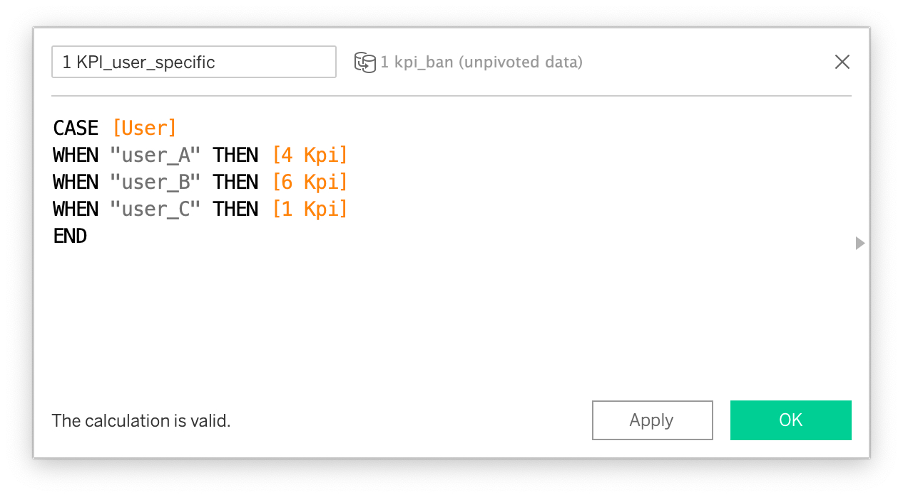
For Templates B&C user specific KPIs have already been implemented in the connection step.
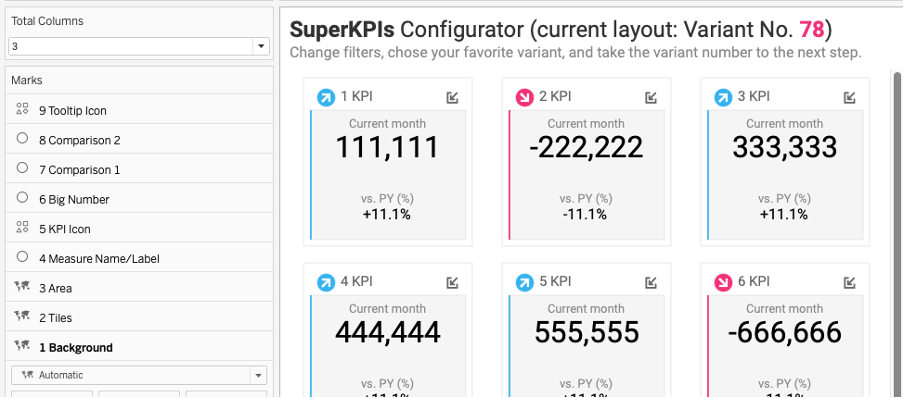
Mobile Layouts
SuperKPIs are not yet fully responsive. But it takes just a few steps to create mobile layouts.
- Choose one of the Responsive variants (Grid Type = ‘flexible’).
- Change the number of columns in the Total Columns Parameter.
- Use sheets on designed-for-mobile dashboards.
Three columns:
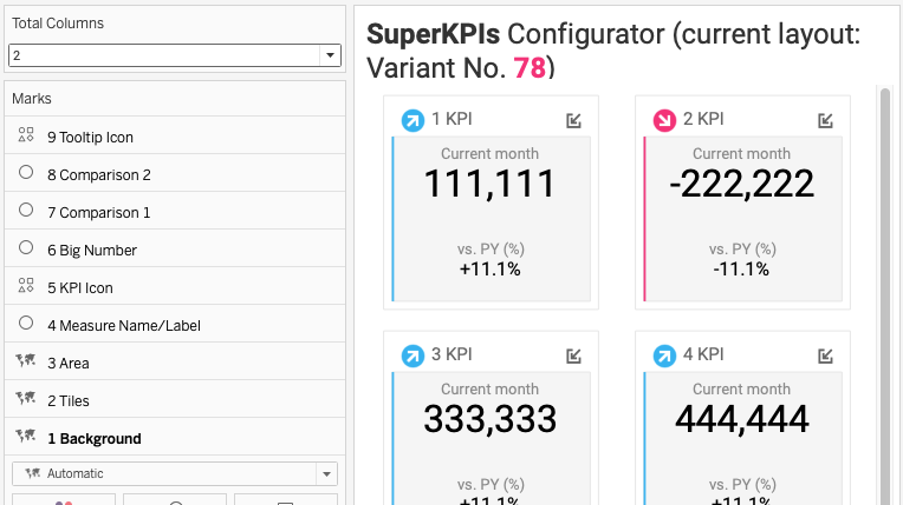
Two columns
CUSTOMIZE SuperKPIs
Color
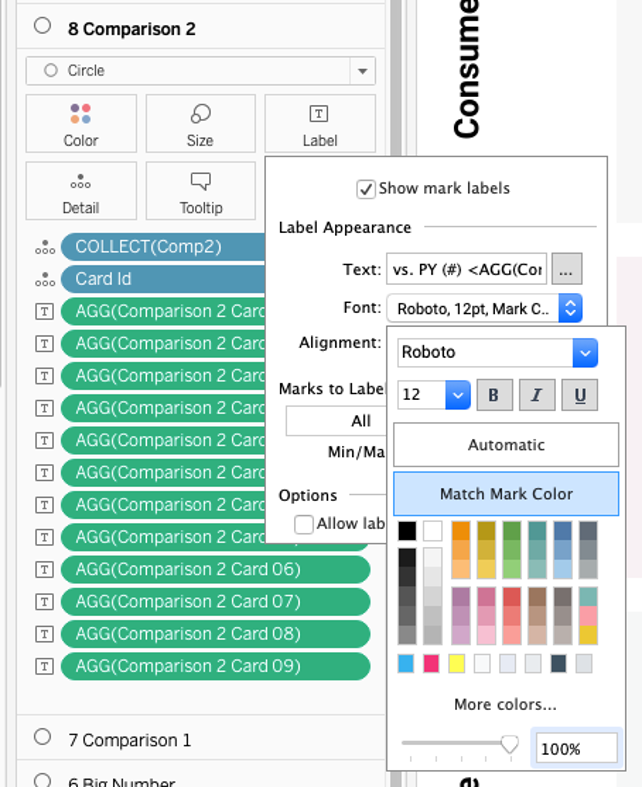
Go wild with colors! You can customize colors in SuperKPIs to your absolute will. Implement your organization’s color palette, and use color to encode further information.
- Use the Color_any object field to color any object in the view (hence the name :) ). When coloring numbers or labels that are used with a circle or shape mark, make sure that the font color is set to “Match Mark Color”.
- Put a measure (e. g. Comparison 1 all) on color for the background or the tiles layer.

- Use any dimension on color to highlight the cards belonging to the same dimension.
Borders
Go wild with borders! Use borders on the tile and on the background layer to create different designs of your KPI cards.


Format Options
Use all available Format options to create unique designs:
- Fonts
- Shadings/Background Color

- Row/Column Banding
- Borders
PERFORMANCE OPTIMIZATION
SuperKPIs run at a decent performance. If you feel the need to further improve query and load time, consider the following simple rules:
- Templates B&C > Template A (pivoted faster than unpivoted data sources)
- Extracts > Live connections
- BAN Template > Line Template > Bar Template > Progress Bar Template > Area Template
- Extract Filters > Data Source Filters > Quick Filters
- Limit the number of Quick Filters in the view
- Hide unused fields
Use the dashboard performance check in 2022.1
We love to make solutions and help Tableau users to do things more efficiently. If you have feedback, ideas, questions or need support, please share them with us! Also, don’t forget to follow us on social media for our latest news and updates.