VizSlides Product Guide
Integrate interactive Tableau dashboards in PowerPoint
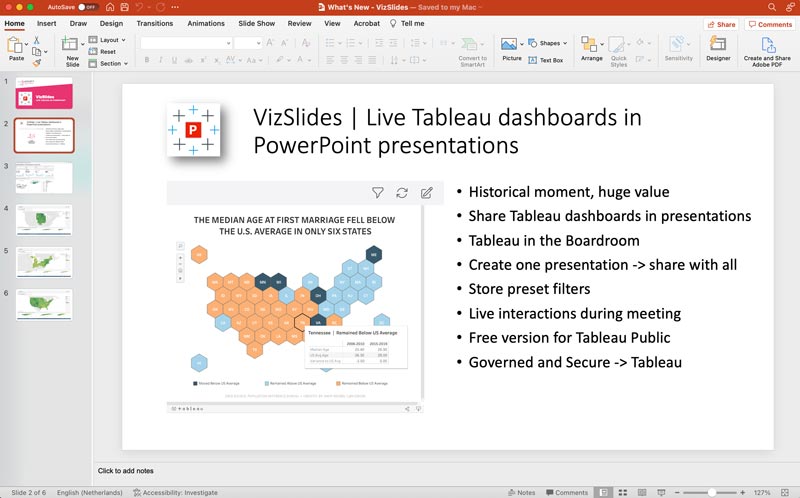
With VizSlides, a PowerPoint Add-In, Tableau dashboards in presentations are no longer just static images. VizSlides will allow you to include entire dashboards that allow for interactions through filtering, down drilling, or plain selections directly into your PowerPoint presentations. The data is real-time and always up-to-date, which allows your organization to become more data-driven and deploy Tableau in the Boardroom as well! Learn how to get started with this product guide.
If you want to know the installation process of VizSlides, click here.
Getting started with VizSlides
Open your PowerPoint application. The VizSlides plugin will work with the PowerPoint Desktop App as well as the PowerPoint Online version on both Windows and Mac Operating systems. This tutorial shows the use of VizSlides in PowerPoint Desktop on a Mac.
First start your PowerPoint application and open the presentation where you want to embed your live and interactive Tableau Dashboards. You can embed the VizSlides Add-in to an existing slide or create a new slide. For demonstration purposes I use a new blank slide.
Overview: Add VizSlides to your PowerPoint slide
Watch this video that will guide you through the process of adding your VizSldies add-in to your PowerPoint presentation. The steps shown in the video are:
- Add a slide to your presentation
- Goto the Insert menu
- Search for VizSlides, use the “Admin Managed” add-ins
- Add VizSlides to your presentation
Create a new sheet
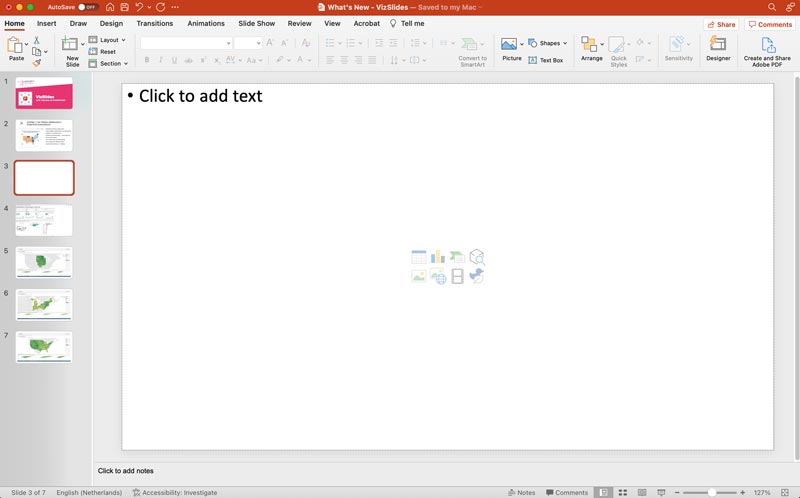
For demonstration purposes we start with an empty slide. In PowerPoint create a new slide and select the “Blank” layout or single content container format to avoid the interaction with pre-defined PowerPoint containers. Of course the VizSlides add-in will work in predefined containers as well and you can always change your settings once the slide is created.
Insert VizSlides add-in in your presentation
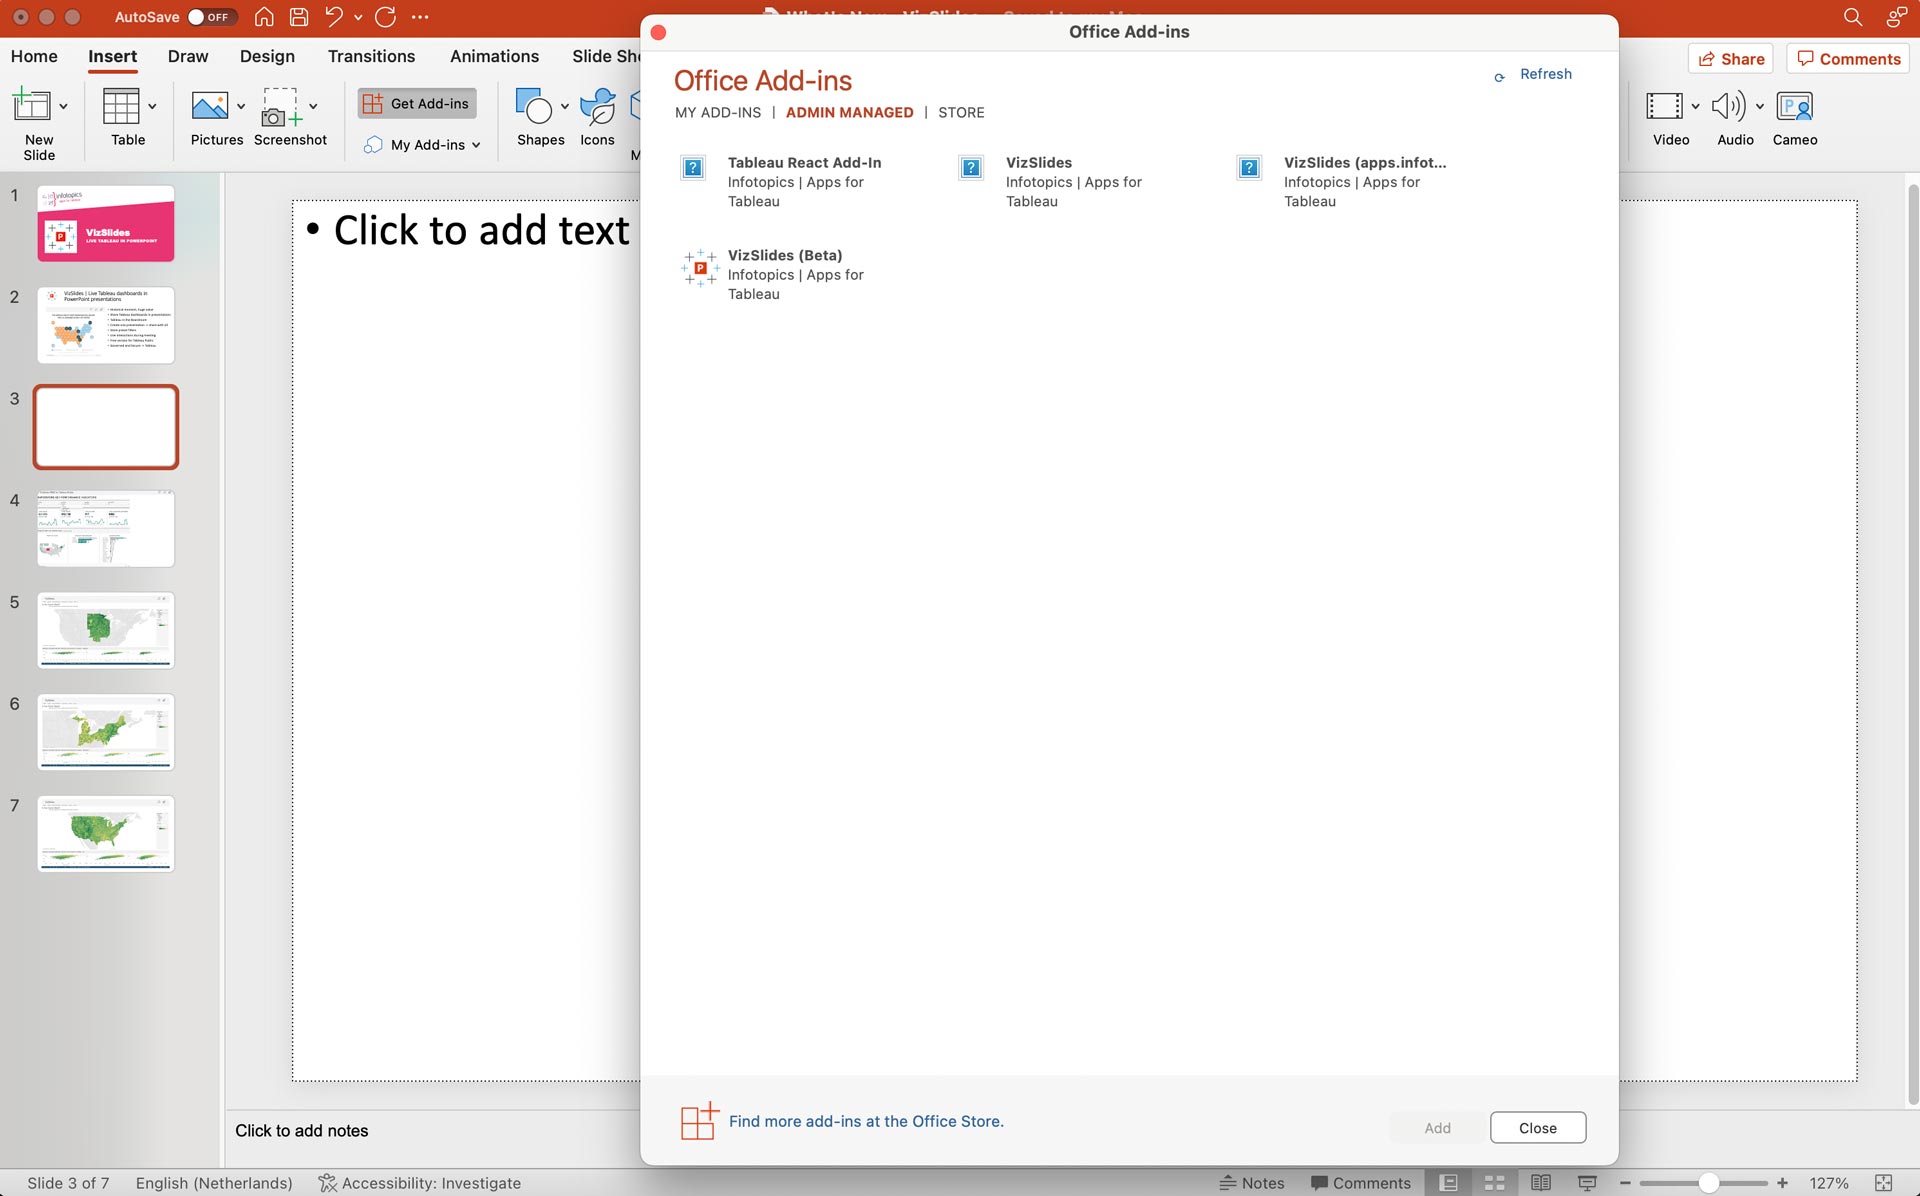
Once you created or selected the slide where the Tableau Dashboard needs to be embedded, select the “Insert” menu option of PowerPoint and click the “Add-in” option in the menu bar. Click on the image on the side to se an enlargement. The “Insert” menu and “Add-in” option are marked with a yellow rectangle.
The Add-in popup shows three tabs. If you want the free version of VizSlides start searching in the Store for “VizSlides” and use the fully functional free version of VizSlides that will allow you to embed dashboards from Tableau Public.
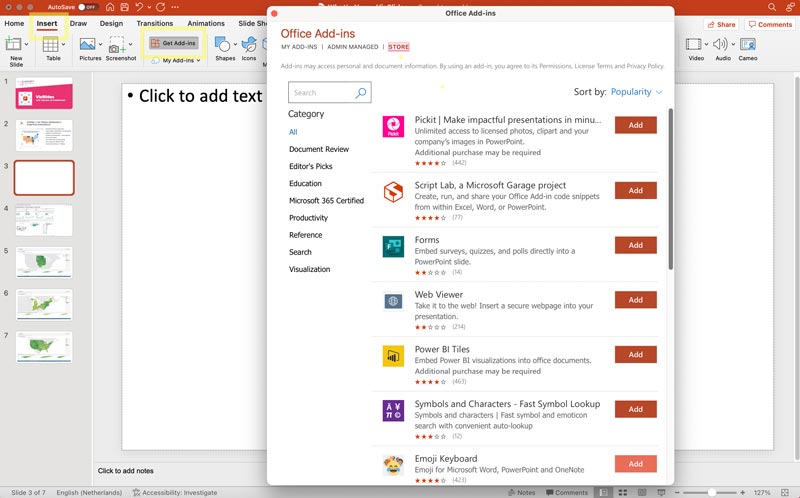
When your organization purchased a license and succesfully completed the installation, the middle tab “Admin Managed” will show all add-ins that are approved by your system admin. This will also include VizSlides. If VizSlides does not appear in this tab, please contact your system administrator and request the publication of VizSlides as described in the Installation manual.
Select the Add-In
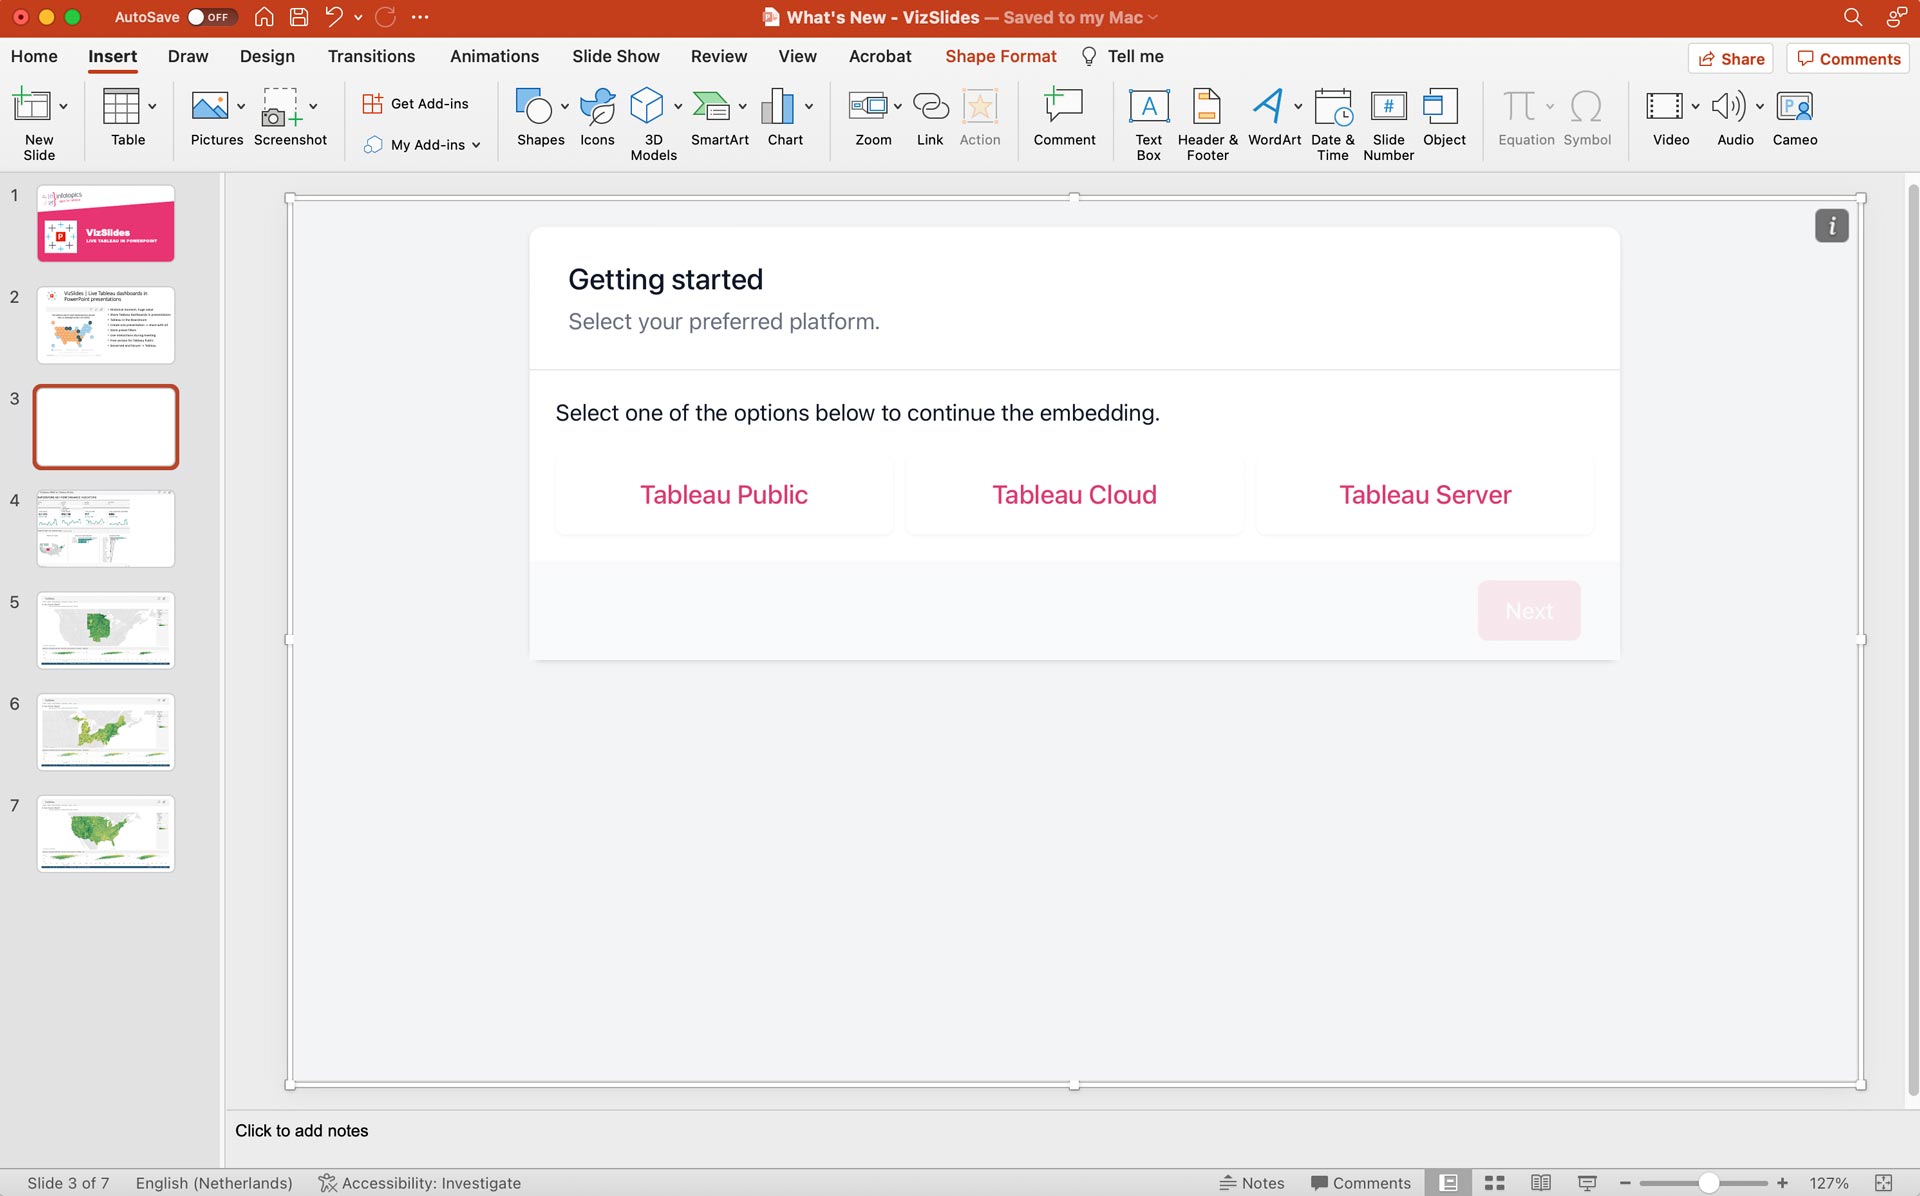
Once you selected the VizSlides add-in for PowerPoint the add-in will load in your Slide and show the start screen. When you use the free version of VizSlides you will only see the “Tableau Public” option, the purchased subscription of VizSlides will show three options:
- Tableau Public. This option allows you to embed a Tableau Public dashboard into your PowerPoint slides.
- Tableau Cloud. If you whish to embed a Tableau Dashboard from your Tableau Cloud environment, you choose this option.
- Tableau Server. If your Tableau environment is based on a Tableau Server environment this is the option to go with.
Below an image of the start screen showing all Tableau Platform options of the VizSlides add-in.
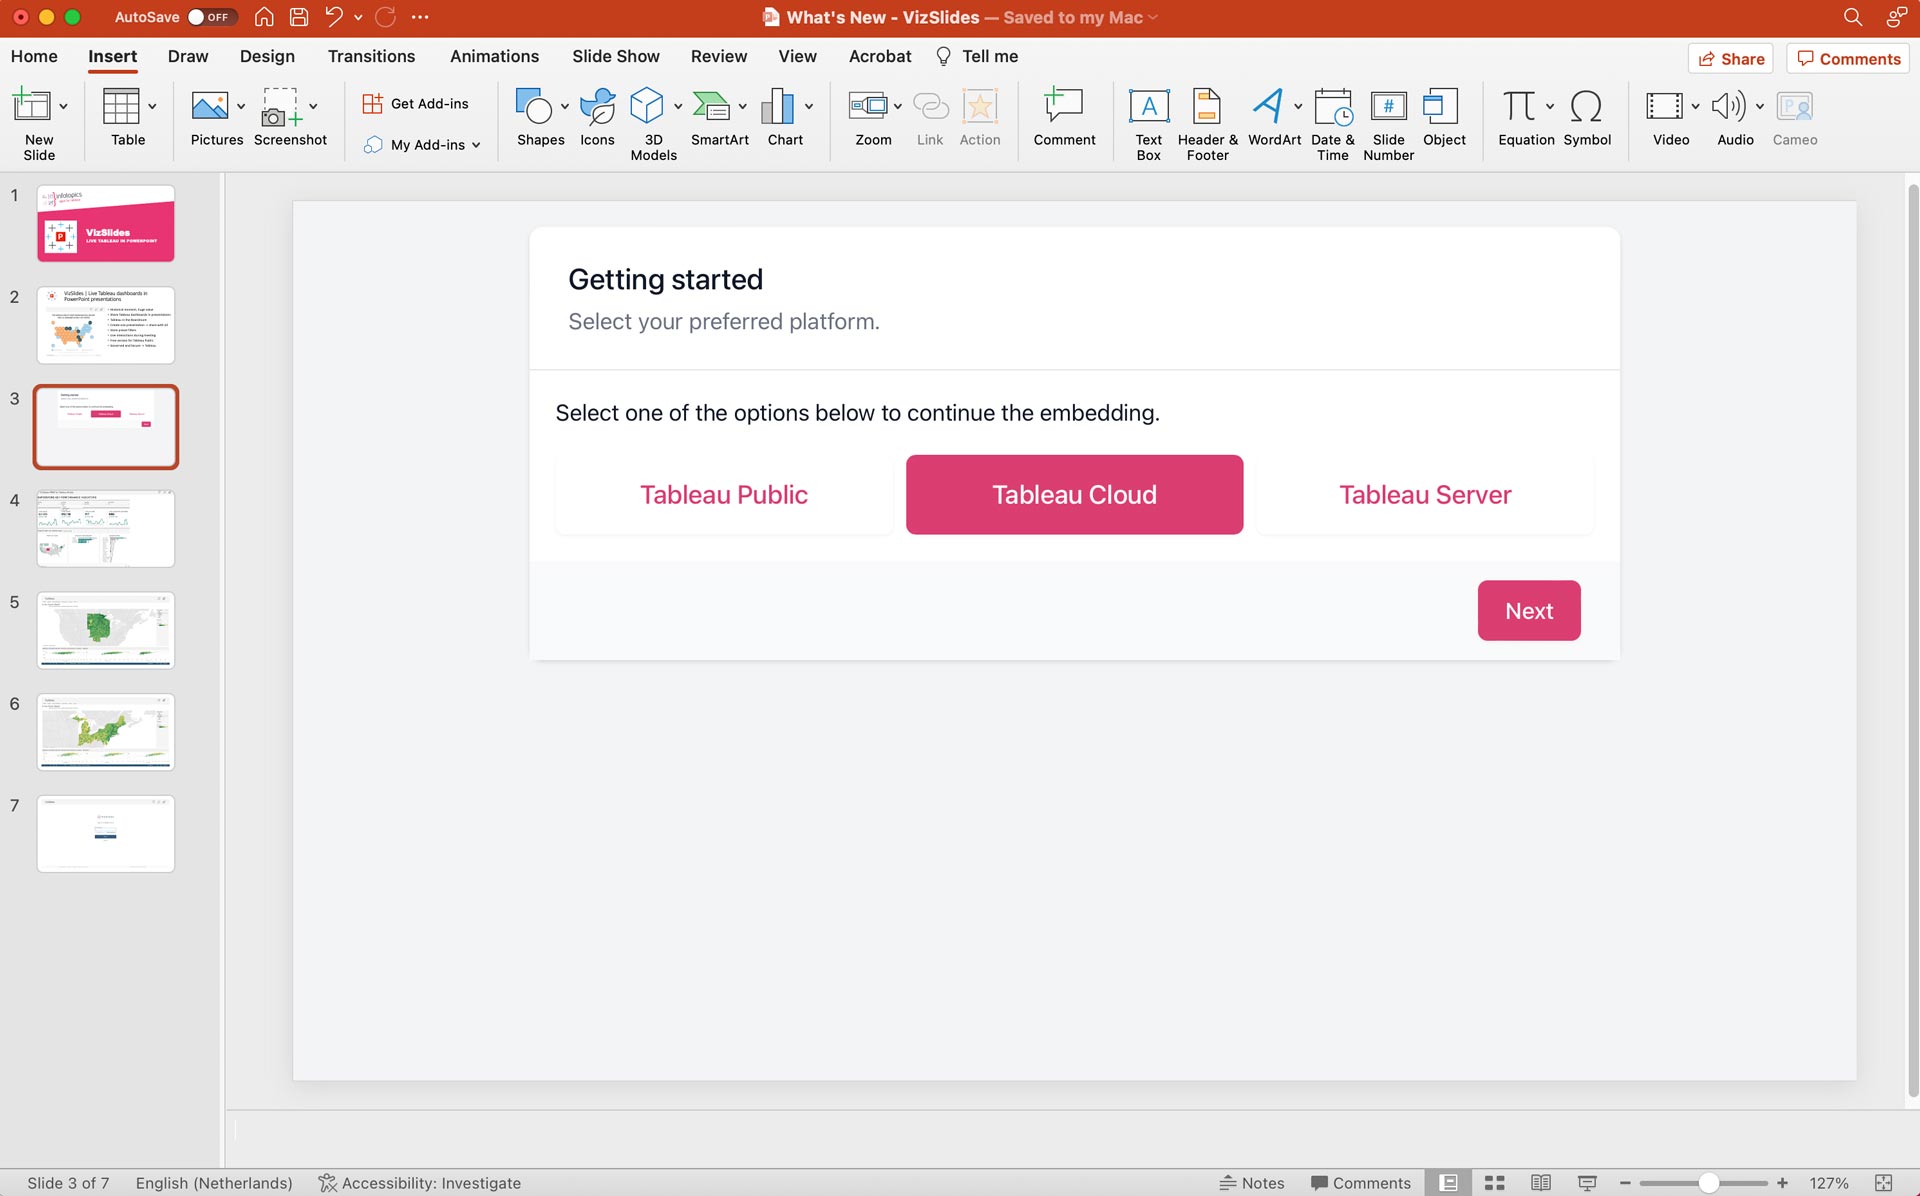
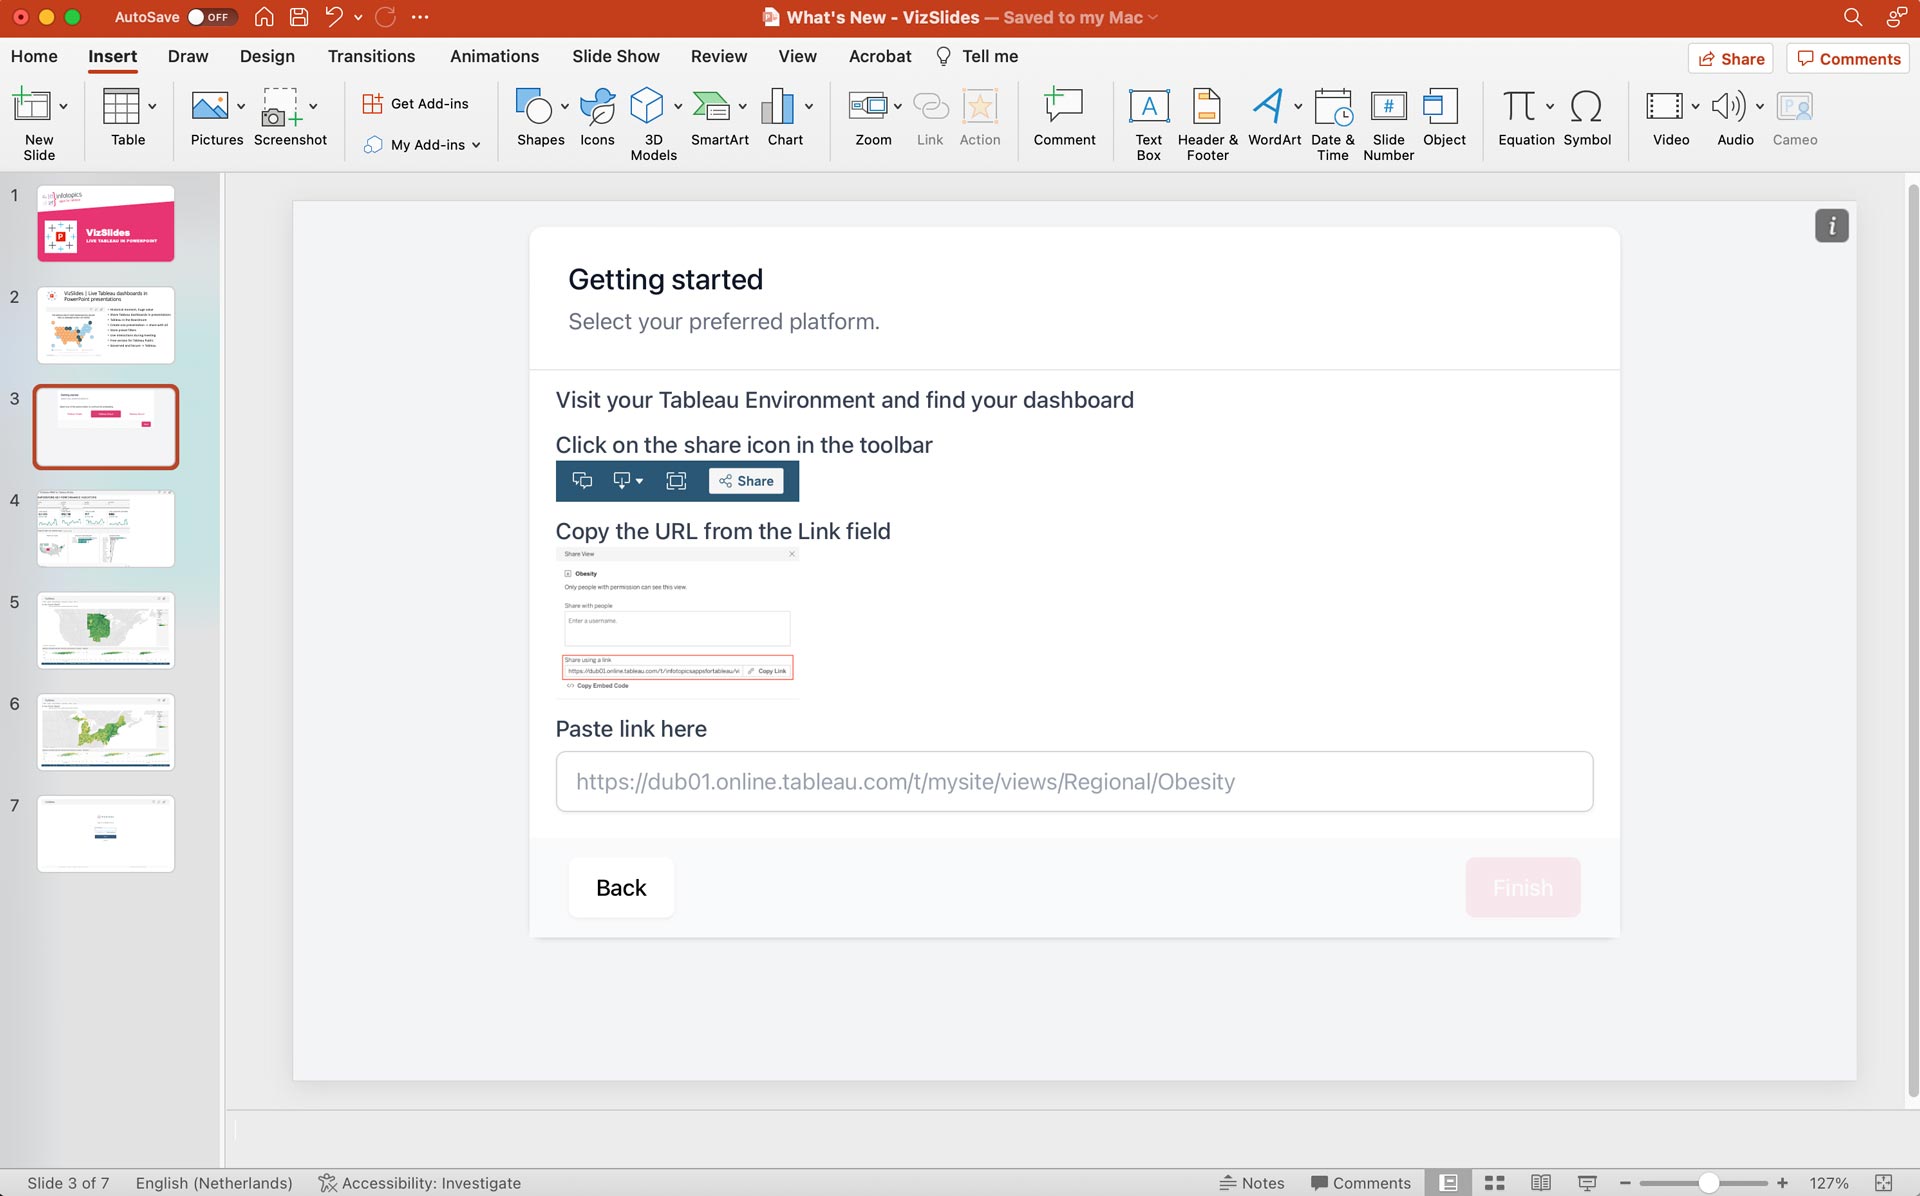
Select your preferred Tableau Platform
The VizSlides extension allows you to integrate Tableau Dashboards from Tableau Public, Tableau Cloud and Tableau Server. Once you added the add-in to your slide, you can select which Tableau deployment you want to embed in your presentation. The whole process is wizard based and will guide you through the process.
Paste the “Share” link of your Tableau Dashboard
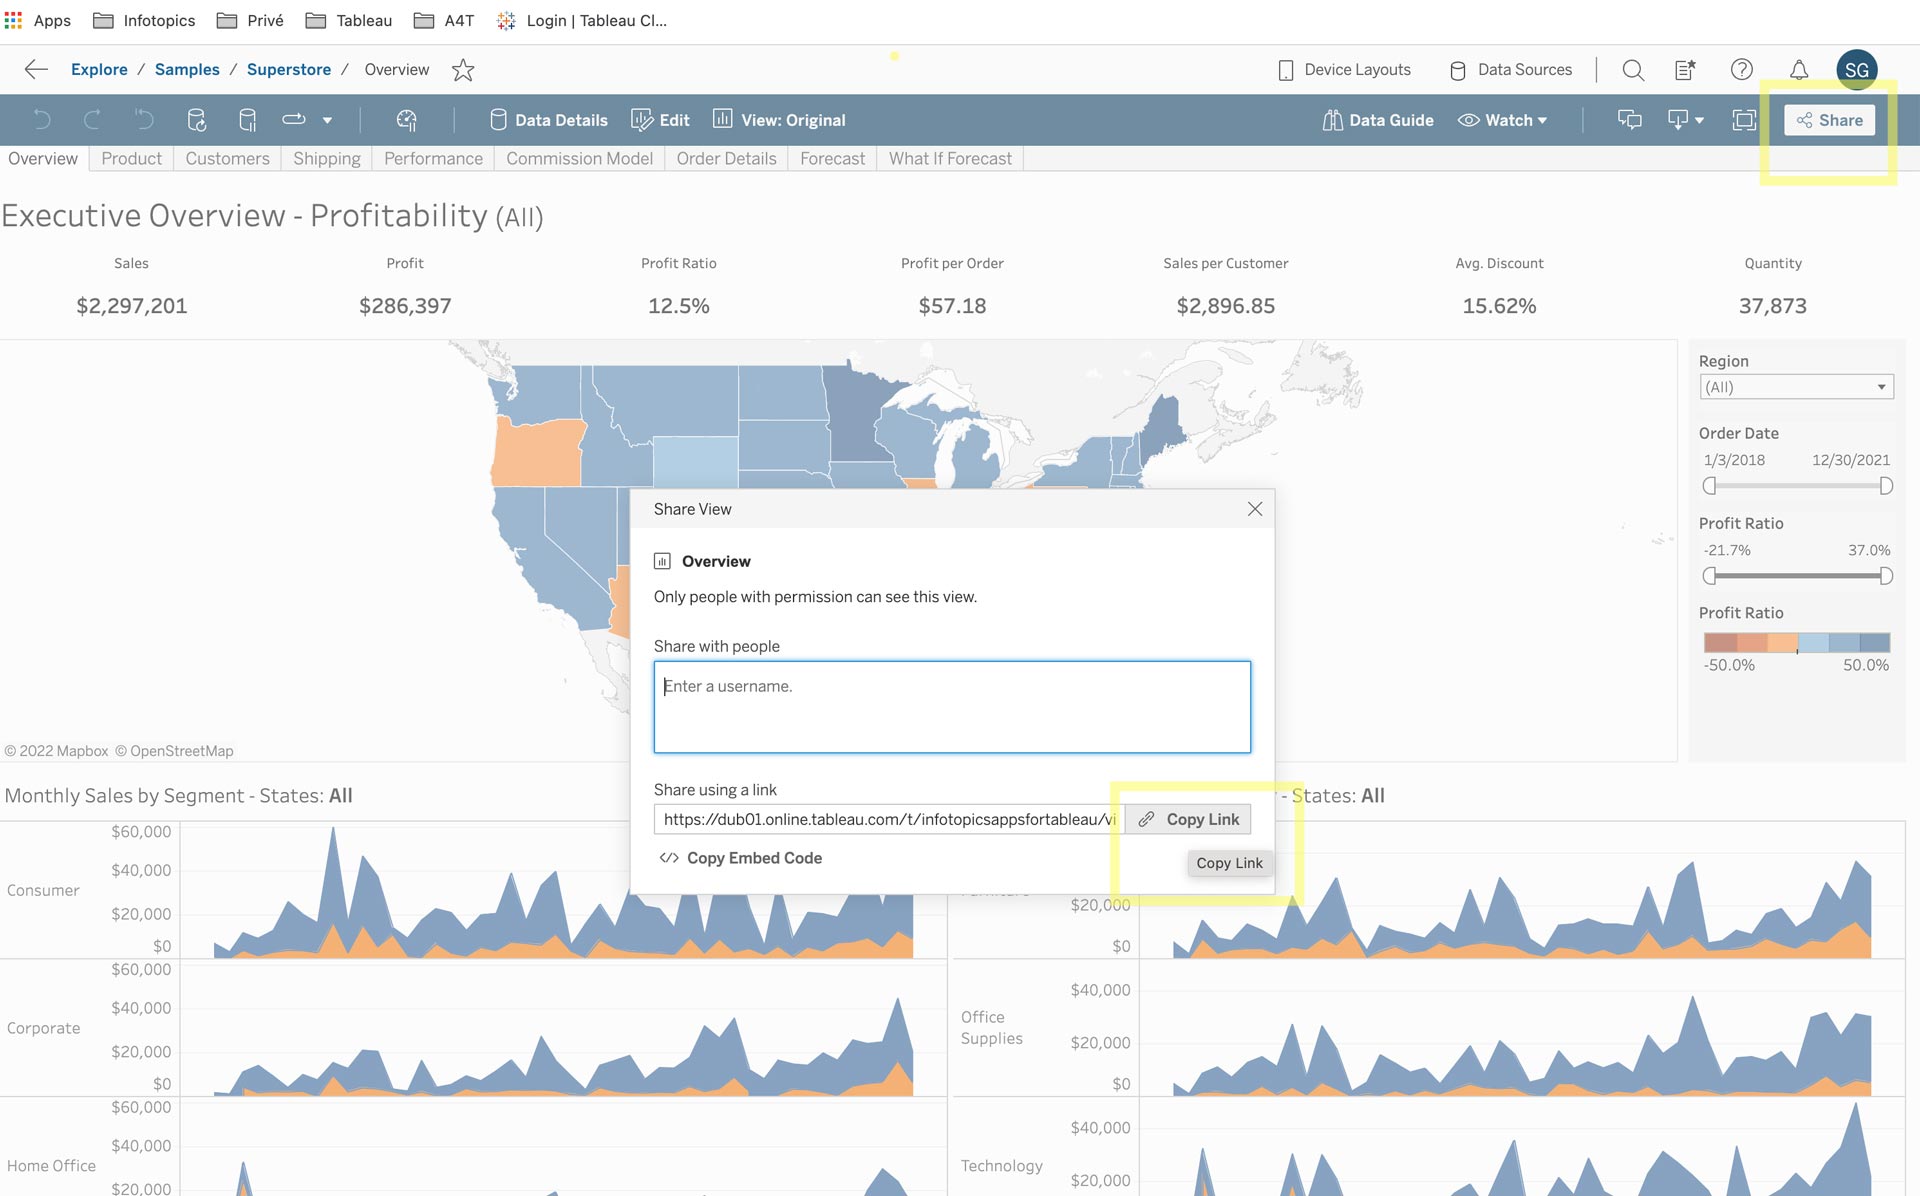
Once you made your choice from what Tableau platform you want to embed, just paste the Share link of the dashboard you want to embed.
The ‘Share’ link can be found by opening the dashboard in your browser and click the ‘share’ button in the upper right corner of your dashboard. The ‘share’ option is available on Tableau Public, Tableau Cloud and Tableau Server.
Once you pasted the “Share” link the add-in will analyze it and prepare it for the final embedding of your dashboard.
It is possible to add parameters to the share url. For example to filter on a country when the dashboard loads. You can do this by adding &Dimension=Value to the parameter like &Country=Germany. Use the & sign to add more url parameters.
There is also a list of Tableau parameters you can add to the URL: here.
You can scroll down to see the result but it is not necessary, you can click “Finish” to complete the embedding of your Tableau Dashboard in PowerPoint.
Using the toolbar

The VizSlides Toolbar is a powerful set of tools designed to enhance your experience when integrating Tableau dashboards into PowerPoint presentations. With a focus on functionality and ease of use, the toolbar offers a range of features that enable you to create professional and visually engaging presentations. Explore the capabilities of the VizSlides Toolbar below:
1. Filters: Effortlessly store filters within your PowerPoint presentations, ensuring that your dashboards are always up to date when you re-open PowerPoint. Note: This feature is currently available for PowerPoint in the browser in combination with Tableau Cloud/Server or with Tableau Public dashboards. More information about how to use this feature see below.
2. Reload: Resolve any dashboard-related issues promptly with the “Reload” button. This option allows you to quickly refresh your dashboard, ensuring a smooth and uninterrupted presentation experience.
3. Show as Image/Show Interactive Dashboard: Tailor your presentation to suit your needs by choosing between “Show as Image” and “Show Interactive Dashboard” modes. Display a static image of your dashboard for a streamlined viewing experience, or unleash the full interactivity and functionality of your Tableau visualizations directly within your PowerPoint presentation. (Note: Only Applicable when using Tableau Cloud/Server on the PowerPoint Desktop app. alternatively you can use below ‘Show as Saved Image feature built into PowerPoint as well.)
4. Show/Hide Toolbar in Presentation Mode: Maintain a clean and distraction-free viewing experience for your audience by toggling the visibility of the toolbar during presentation mode. Choose to show or hide the toolbar as needed, ensuring that your content takes center stage.
5. Edit: Hit the edit button to go back to the editing screen, where you can make adjustments, refine settings, and perfect your presentation to deliver the most impactful data-driven insights.
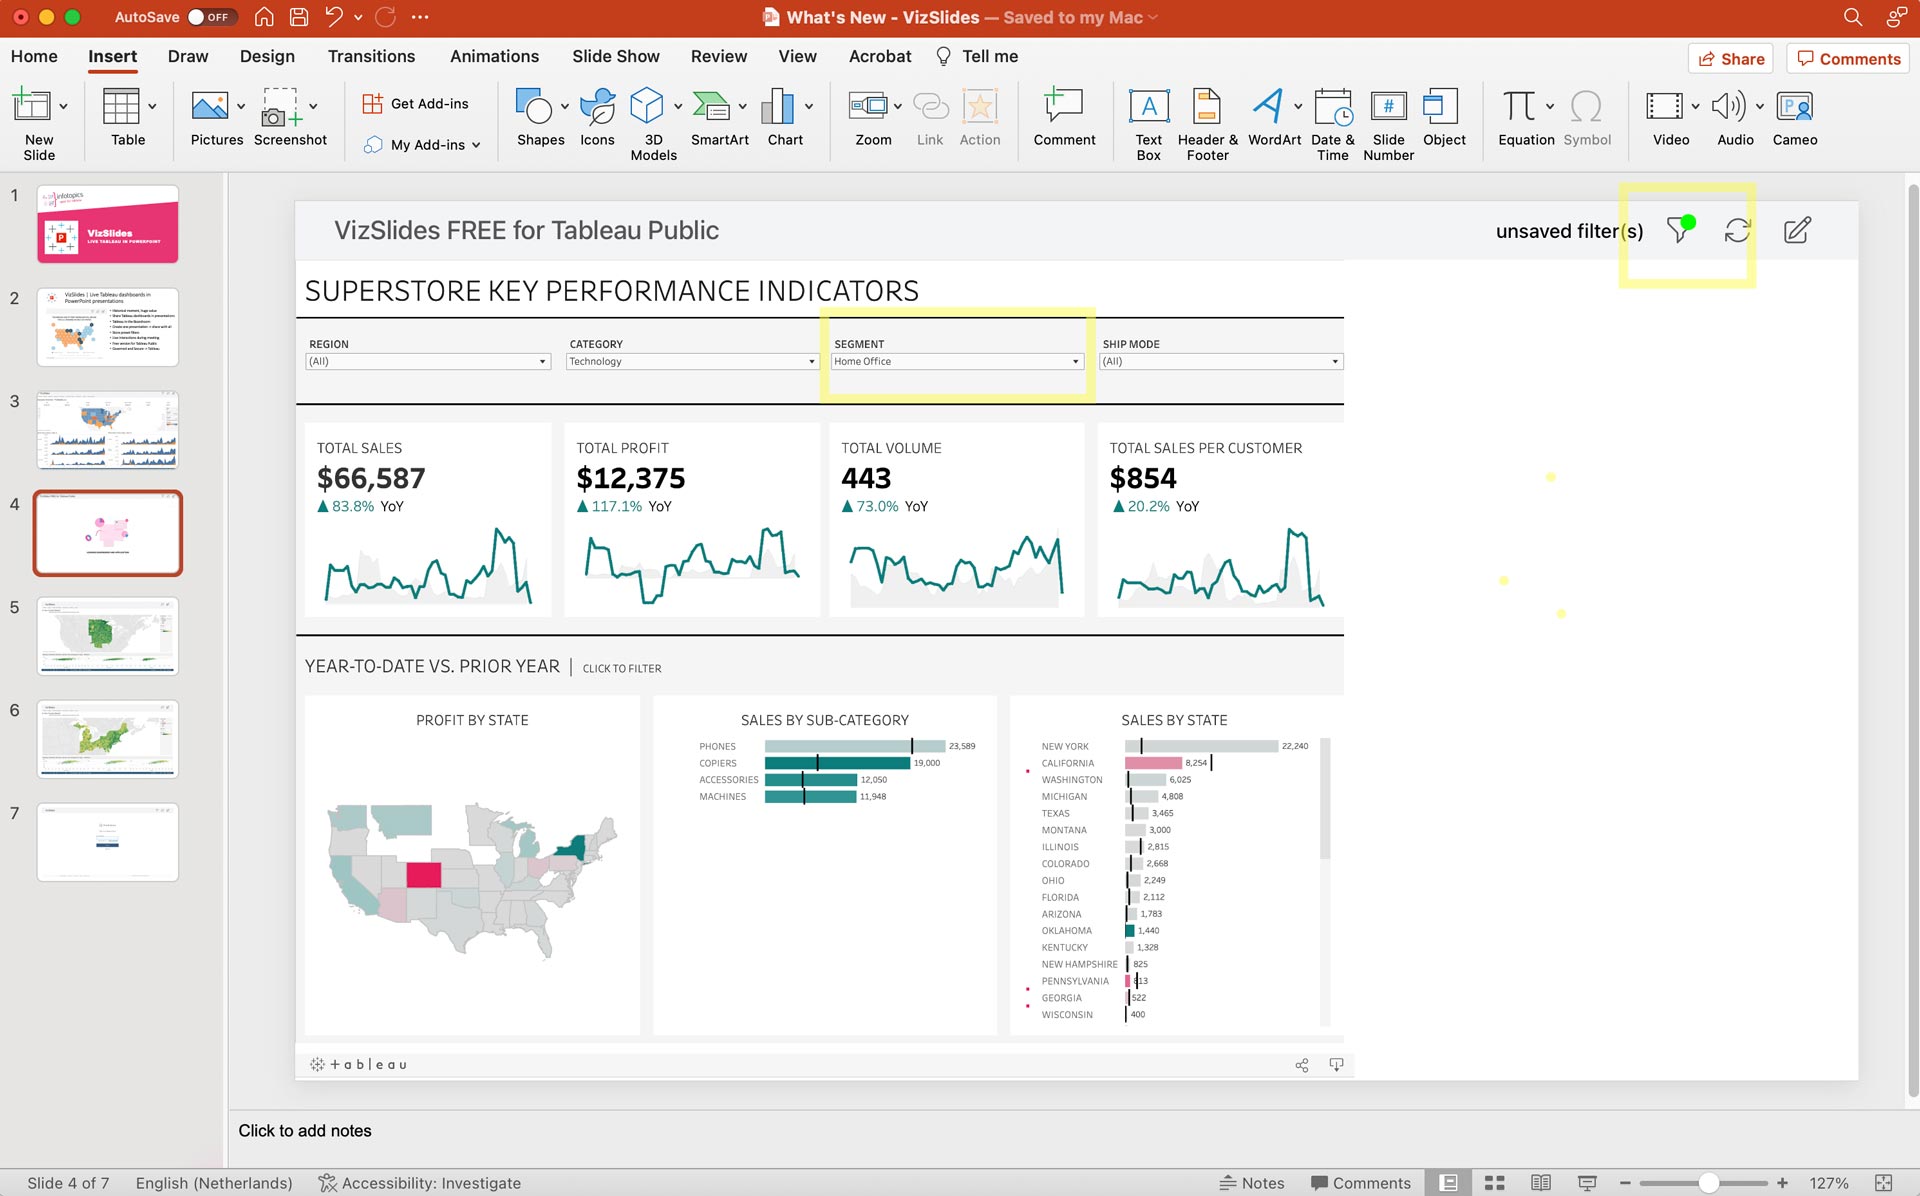
Store Filter Settings
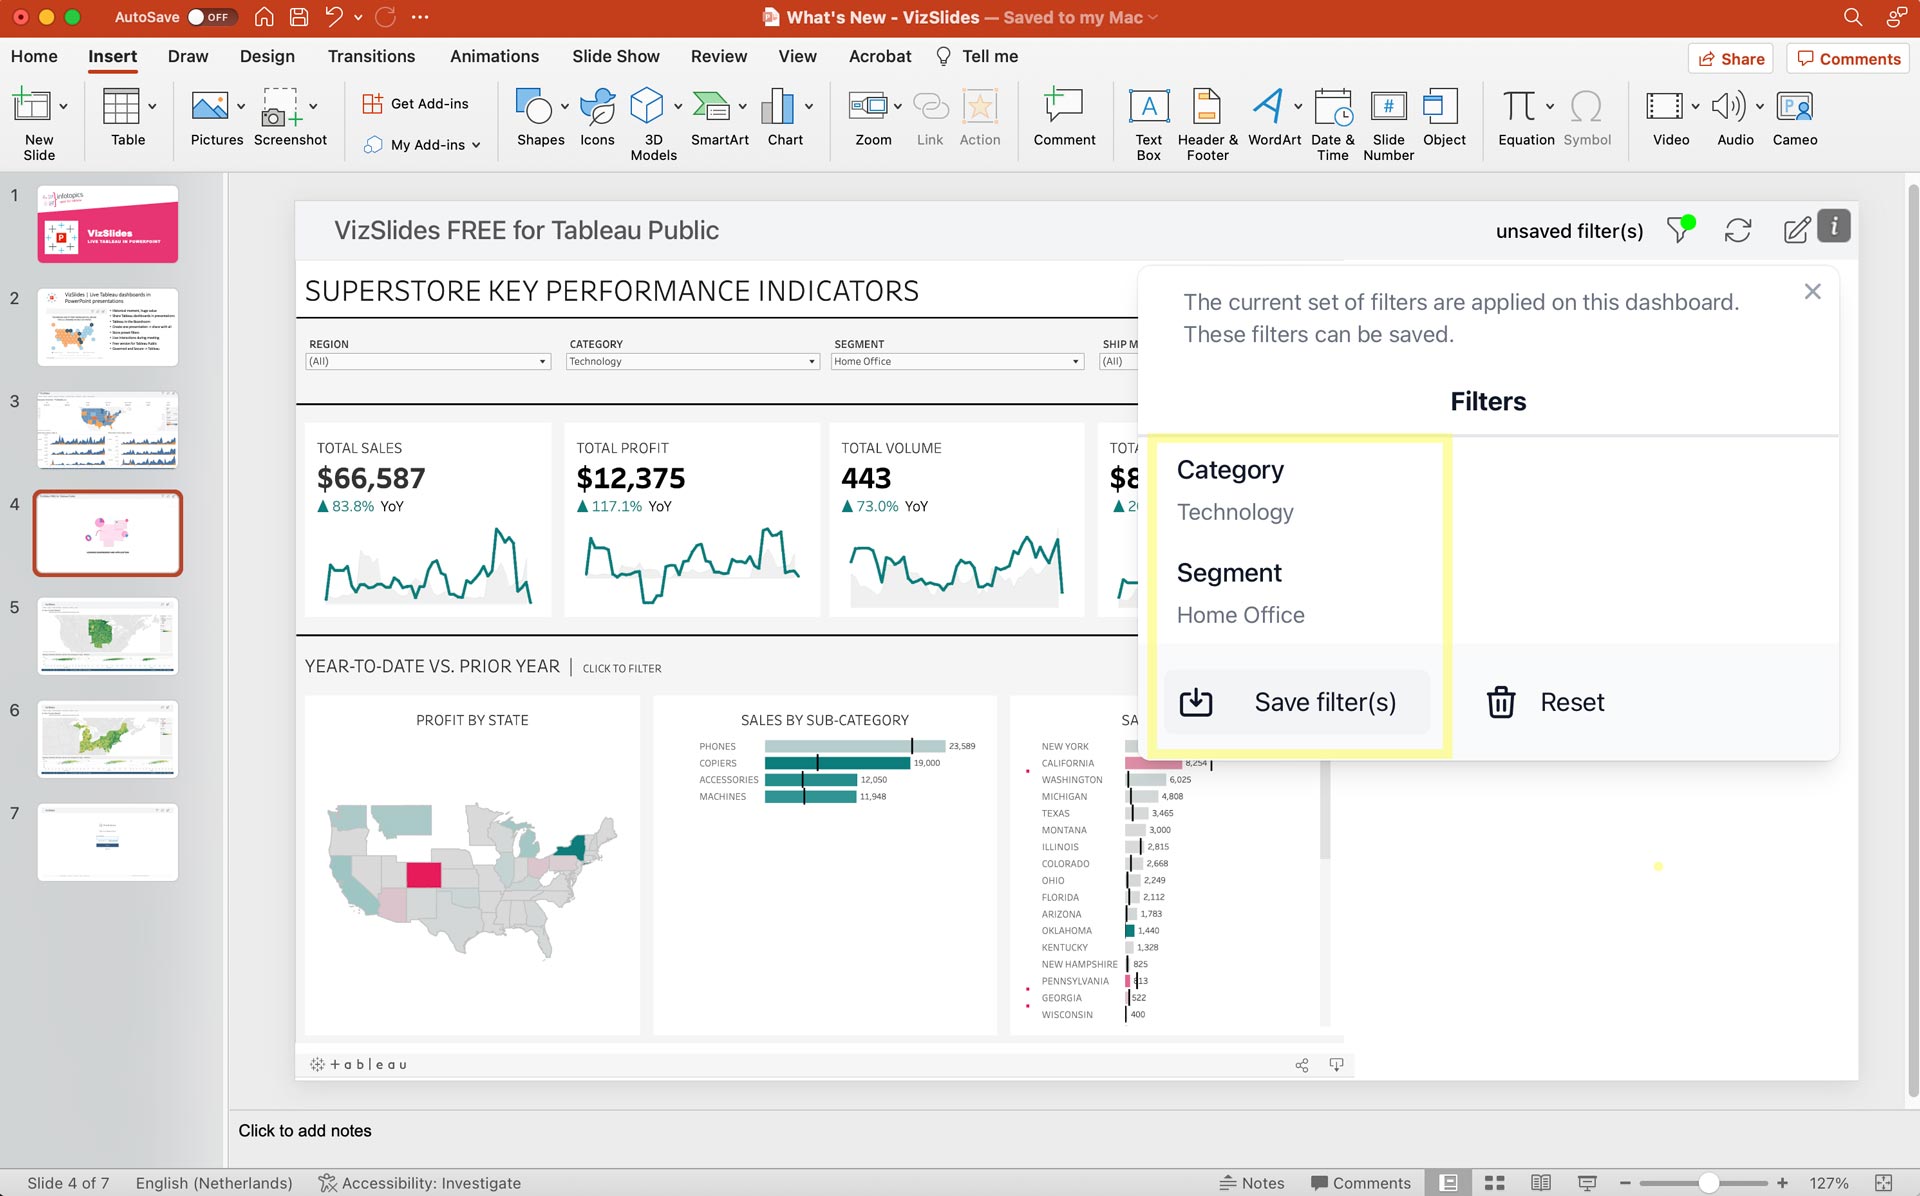
When using published dashboards from the Tableau Public platform you can store your filter settings in the PowerPoint add-in VizSlides. To do so, change your filters in the dashboard. Once you changed your filters you will notice a bright green mark in the filter icon of the VizSlides bar. When you click the filter icon you will be presented the current filter settings and you can save the current settings as a default for this slide.
Once you stored the filter settings they will be applied every time your slide is opened in your PowerPoint presentation.
This feature is currently available on the Tableau Public platform and all browser versions of PowerPoint and will also be implemented for the Tableau Server and Tableau Cloud instances in the PowerPoint Desktop application in near future as well.
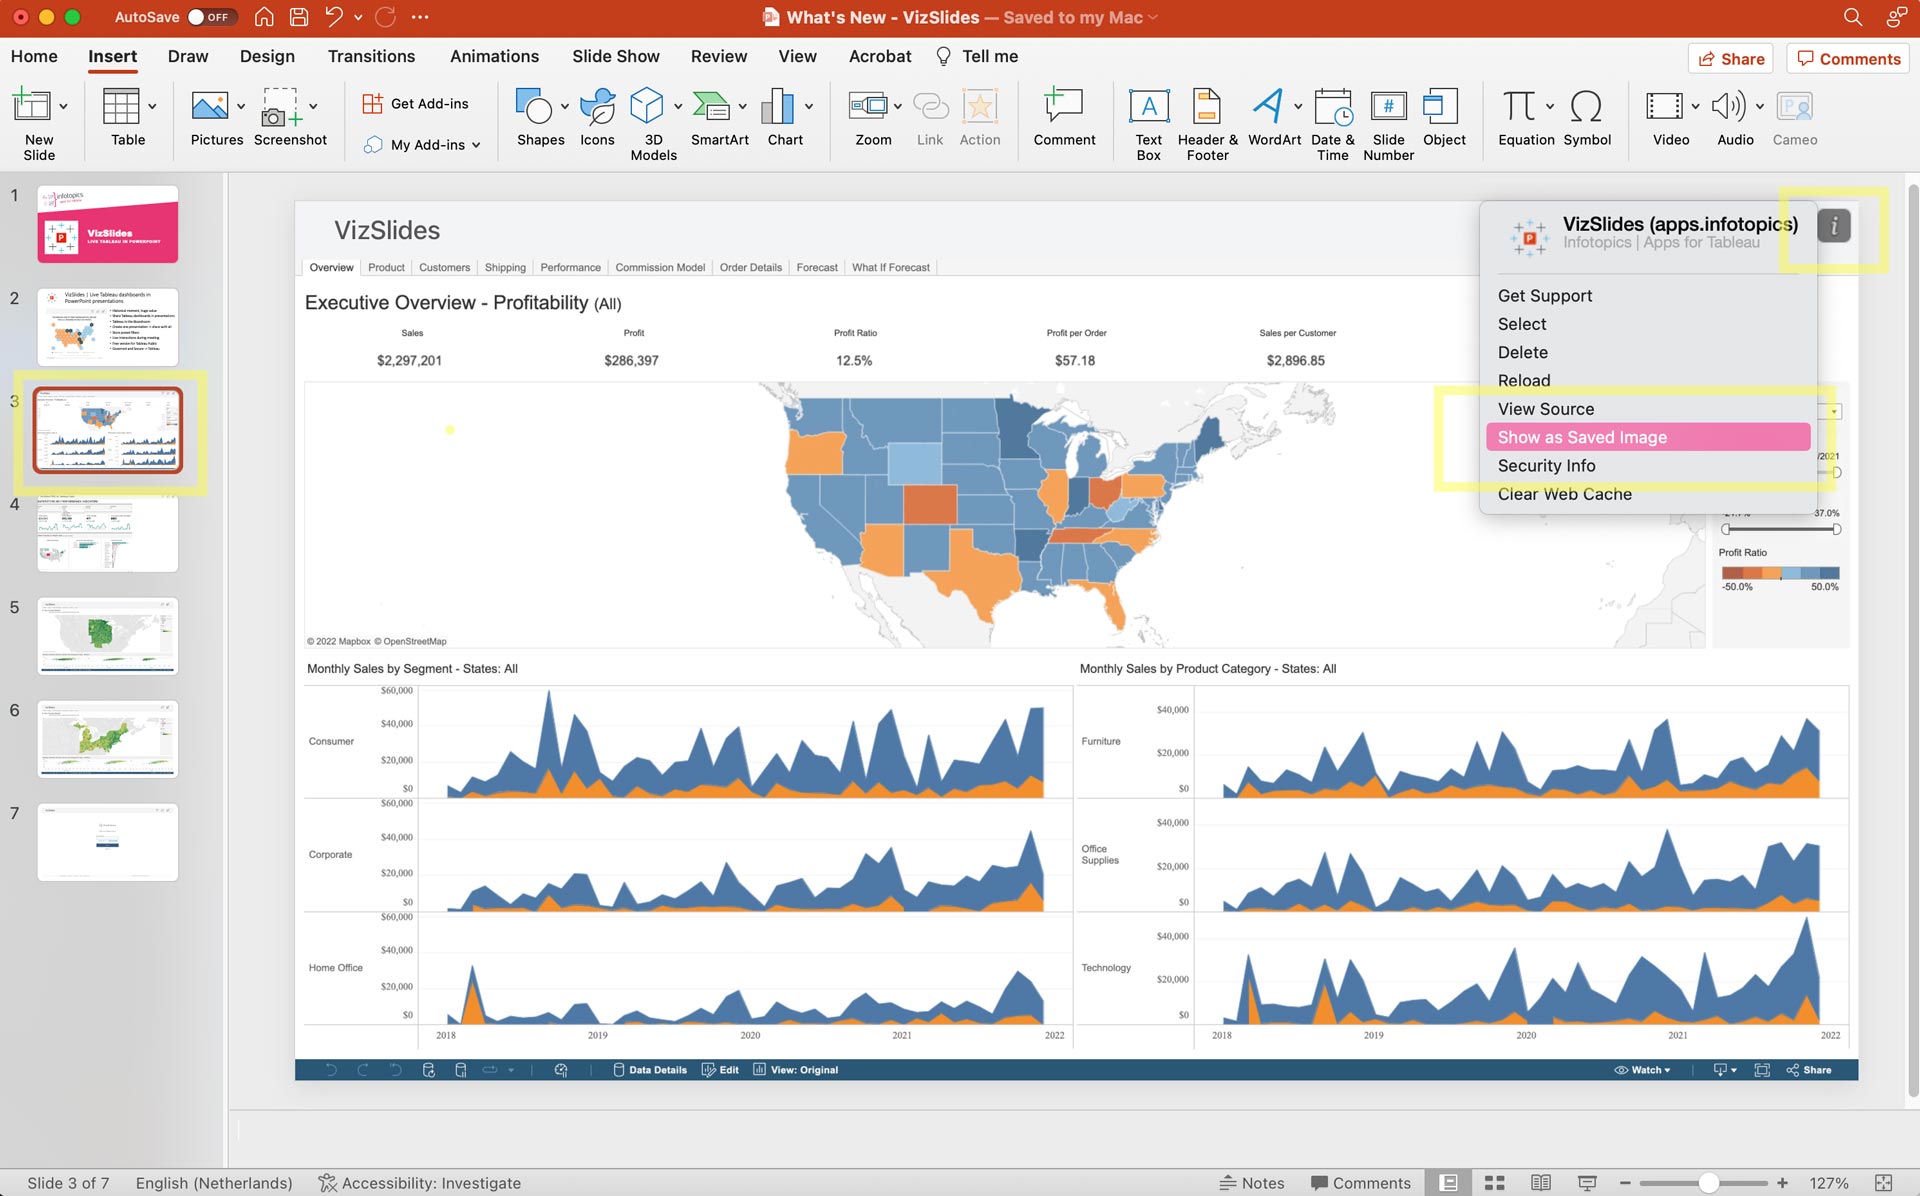
Alternative: Show as Saved Image
VizSlides allows you to embed live dashboards but it also allows to capture the state of your dashboard and use a static image in the presentation. PowerPoint will automatically create a snapshot image very few minutes, this automatically captured screenshot will be used as your static image for the slide. It can take a few seconds/minutes before the image appears so be patient. To embed your dashboard as an image you just select the VizSlides container and click the “I” information icon in the add-in bar. From the dropdown menu you select “Show as Saved Image” and you’re done. The slide will not show a live dashboard in your PowerPoint presentation but use a Saved Image instead. This is great for sharing your slide deck and presenting it offline without logging into your Tableau environment.
If you want to switch to the live dashboard again, repeat the procedure and uncheck the “Show as Saved Image” option in the information dropdown.