Travel through your data by drill through and drill–down analysis
Data drilling refers to performing various transformations on tabular or relational data. It provides quick insights by highlighting the underlying trend in the data, enabling decision-makers to act on data quickly. So how can we travel through data?
How does it work?
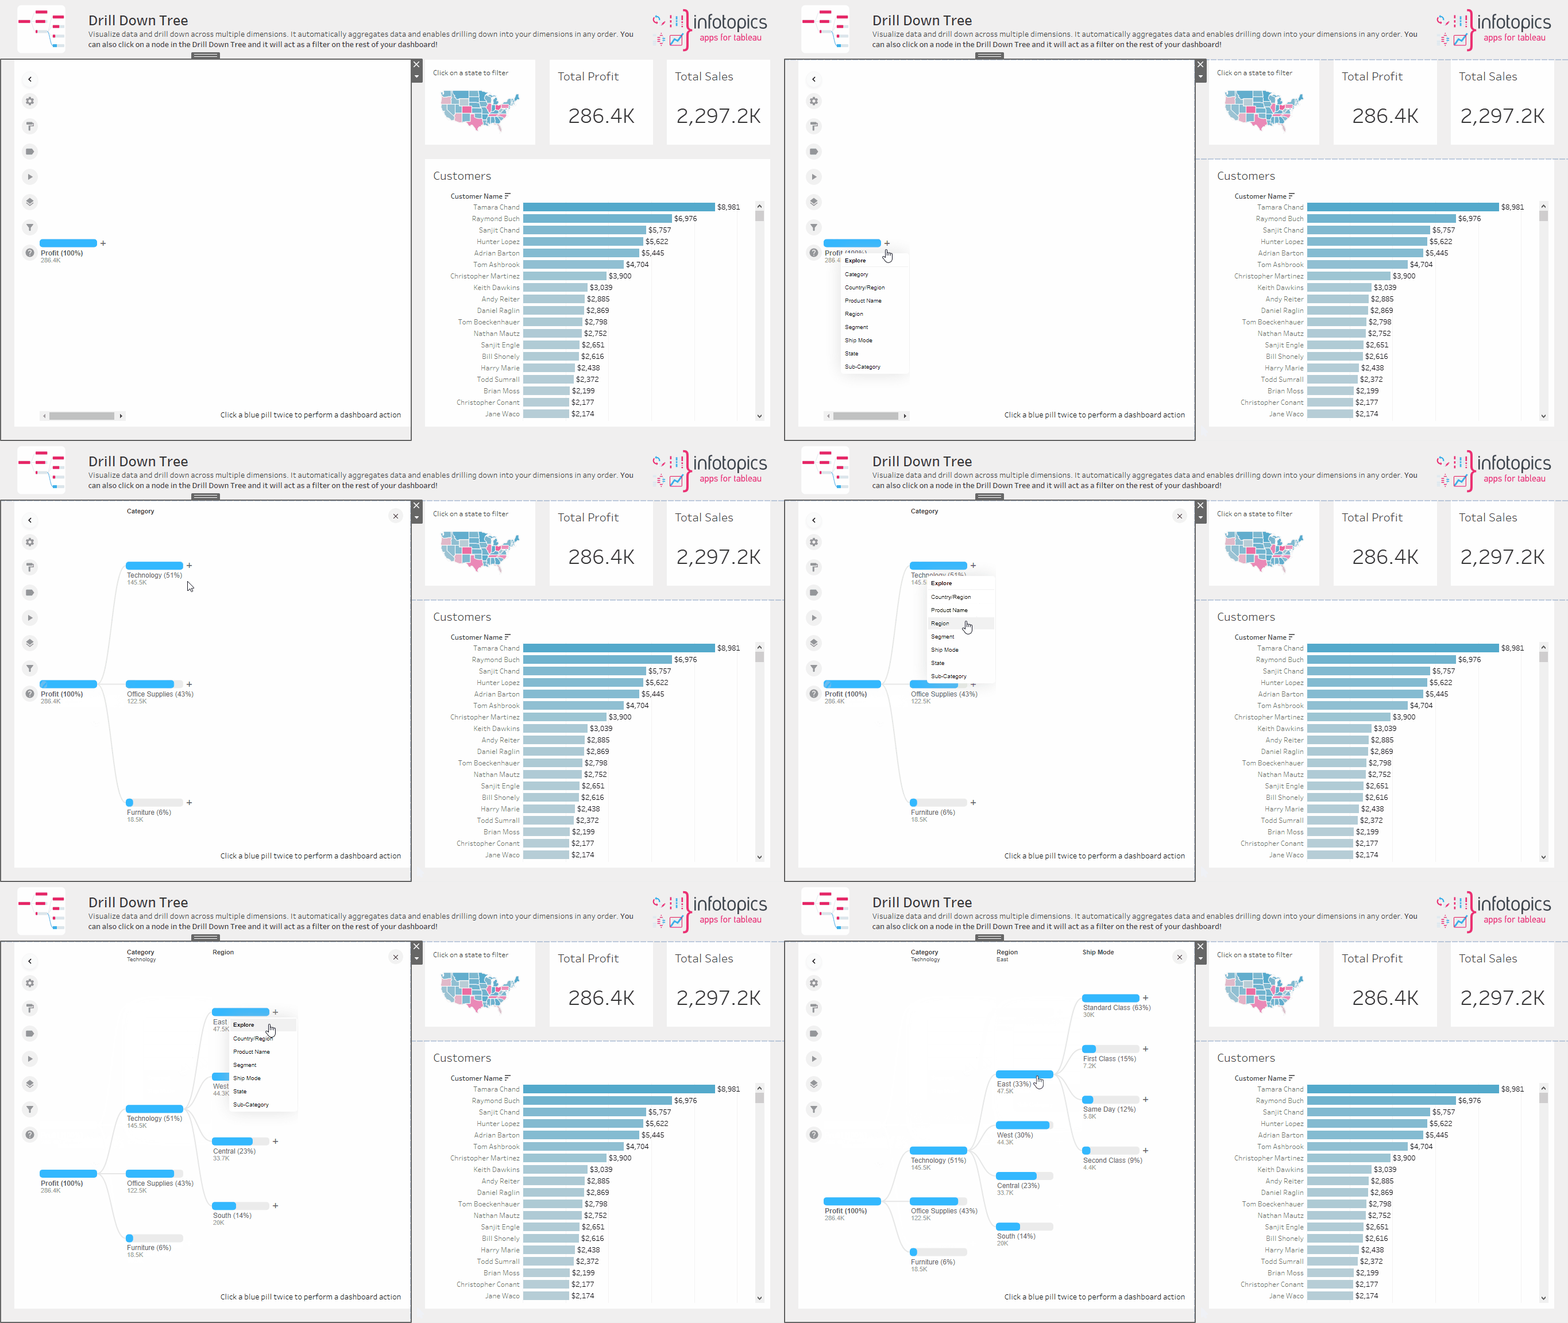
There are two ways in general; one is a drill-down that enables you to dive deep into your data and lets you explore your data at a more granular level. Drill-Down plays a vital role in breaking down data and providing comprehendible data for easy understanding. It allows you to look at the multidimensional data by browsing from one level of data to another. As a result, this kind of analysis helps in root-cause analysis in various business processes.
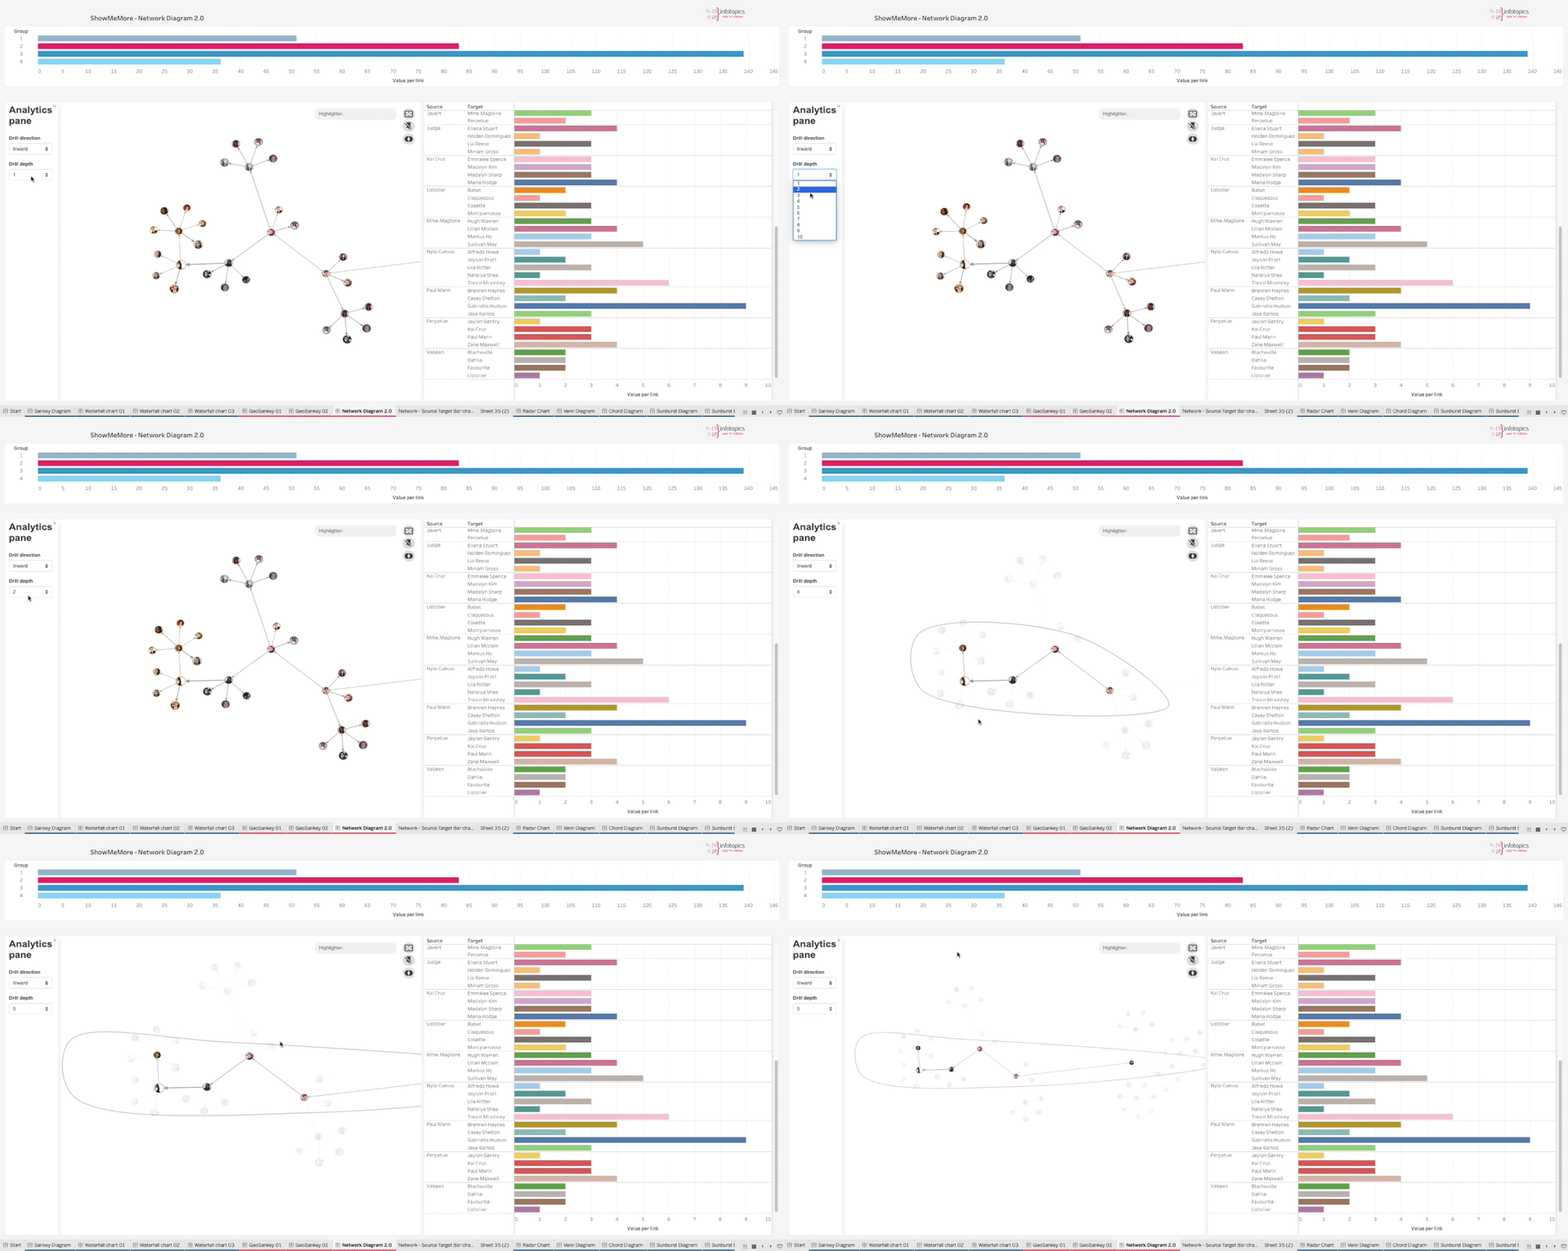
The second method, ‘drill through,’ gives you a bird’s eye view, with the option to focus on only what you want to see. Apps for Tableau offers two solutions that enable you to travel through your data. The first one Drilldown Tree lets you drill through your data and dive deep into your data. The second one (the new ShowMeMore – Network Diagram 2.0) comes with a powerful drill–through feature that allows you to navigate through your data in an interactive way. The feature will enable you to visualize more detailed information within the Network Diagram.
Drill through analysis is often confused with drill–down analysis as both practices are very similar. Drilling down provides granular information within a specific chart or data set. Drill-throughs display another aspect of the data that might be relevant.
What makes the drill through in the network diagram effective?
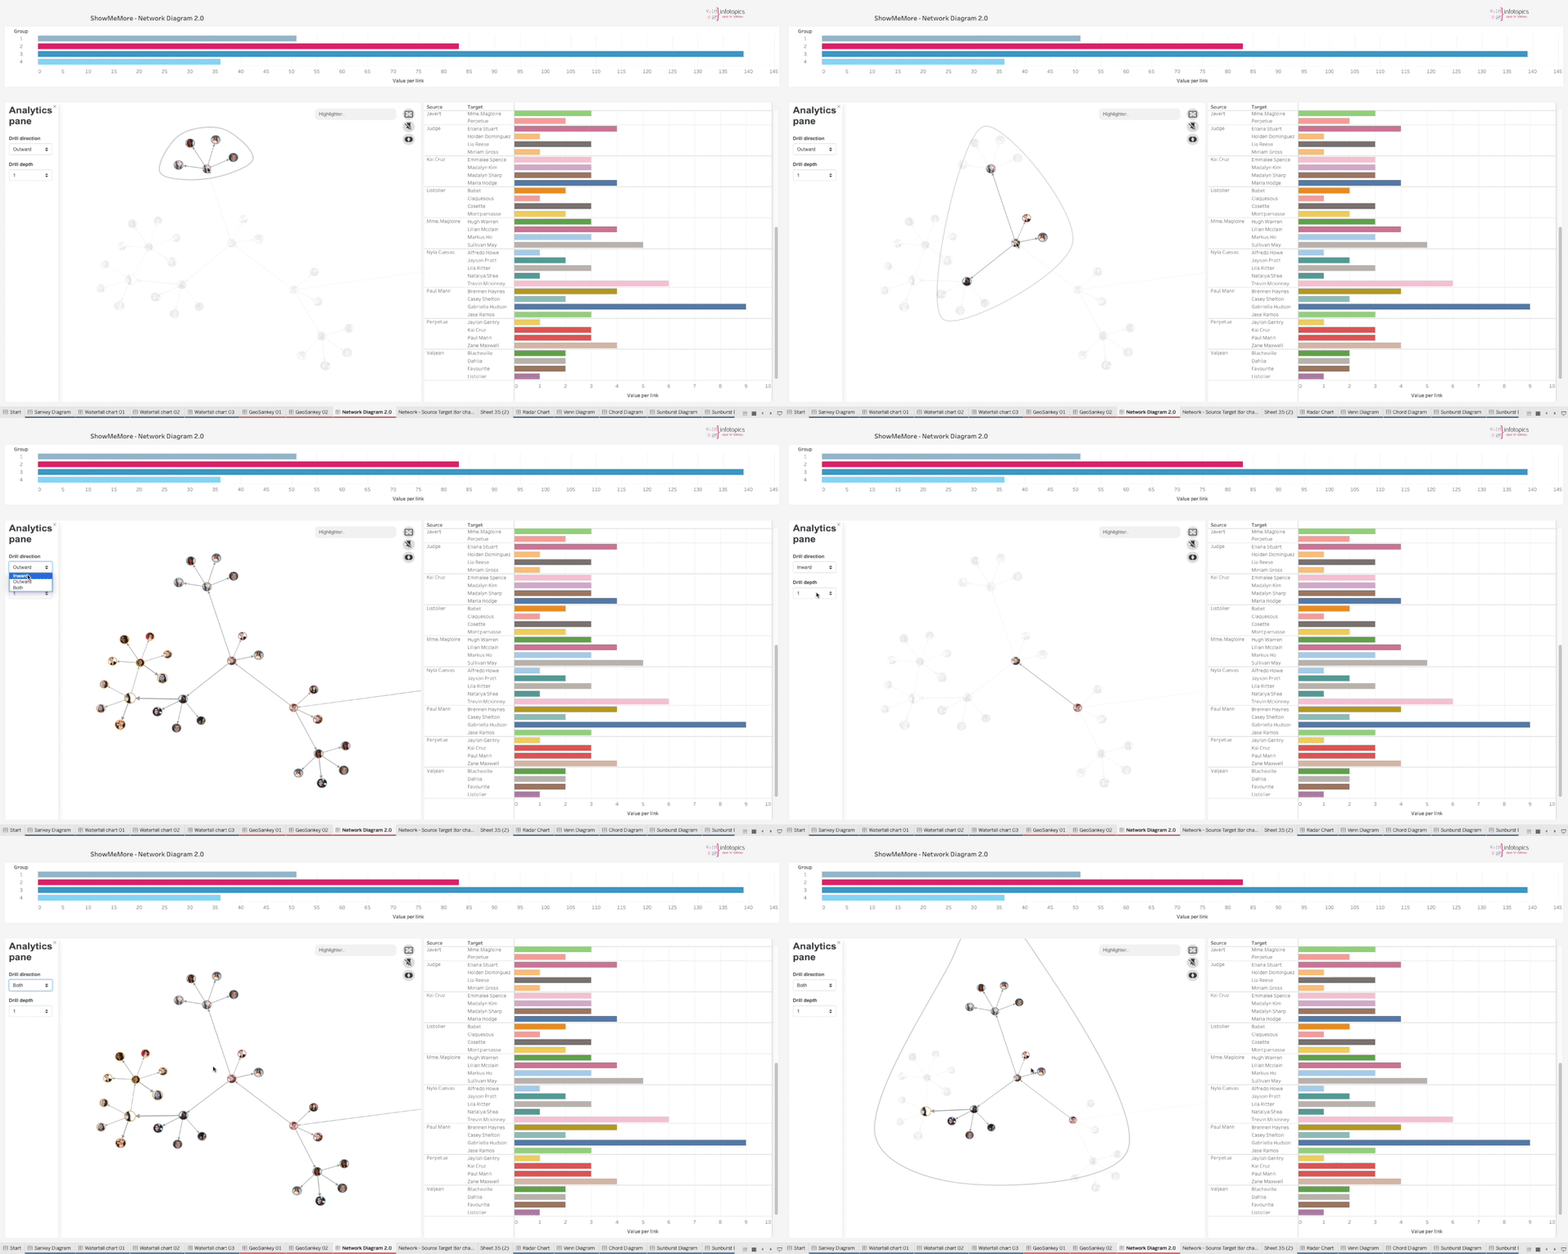
Let’s first look into what network diagram offers, The new version of the Network Diagram comes with two options to perform drill through analysis: the drill level and drill direction. Firstly, the drill level defines how far your drill action propagates from the selected node. Secondly, drill direction determines which direction you want the drill action to propagate – inward, outward, or both. For example, as the name suggests, the “inward” option highlights the nodes and paths which are coming to the selected node, and “outward” emphasizes the opposite.
To conclude, drill–through analysis lets you see data from different points of view and navigate through data and analyse it with different options. This greatly enhances the users’ understanding of the data and the reasons behind the figures.


