My first weeks: new features for Tableau extensions and Proof of concept
Two weeks ago on November 18, I started working for Infotopics | Apps for Tableau. With close to 10 years of experience I like to add more value, quality and fresh insights to the Tableau extension department. I am mainly experienced with software engineering; web development (mainly focused on backend). In this way, I hope to contribute to the Tableau Extensions community and be a good sparring partner with Zen Master Merlijn Buit and the other developers of course.
My first proof of concept
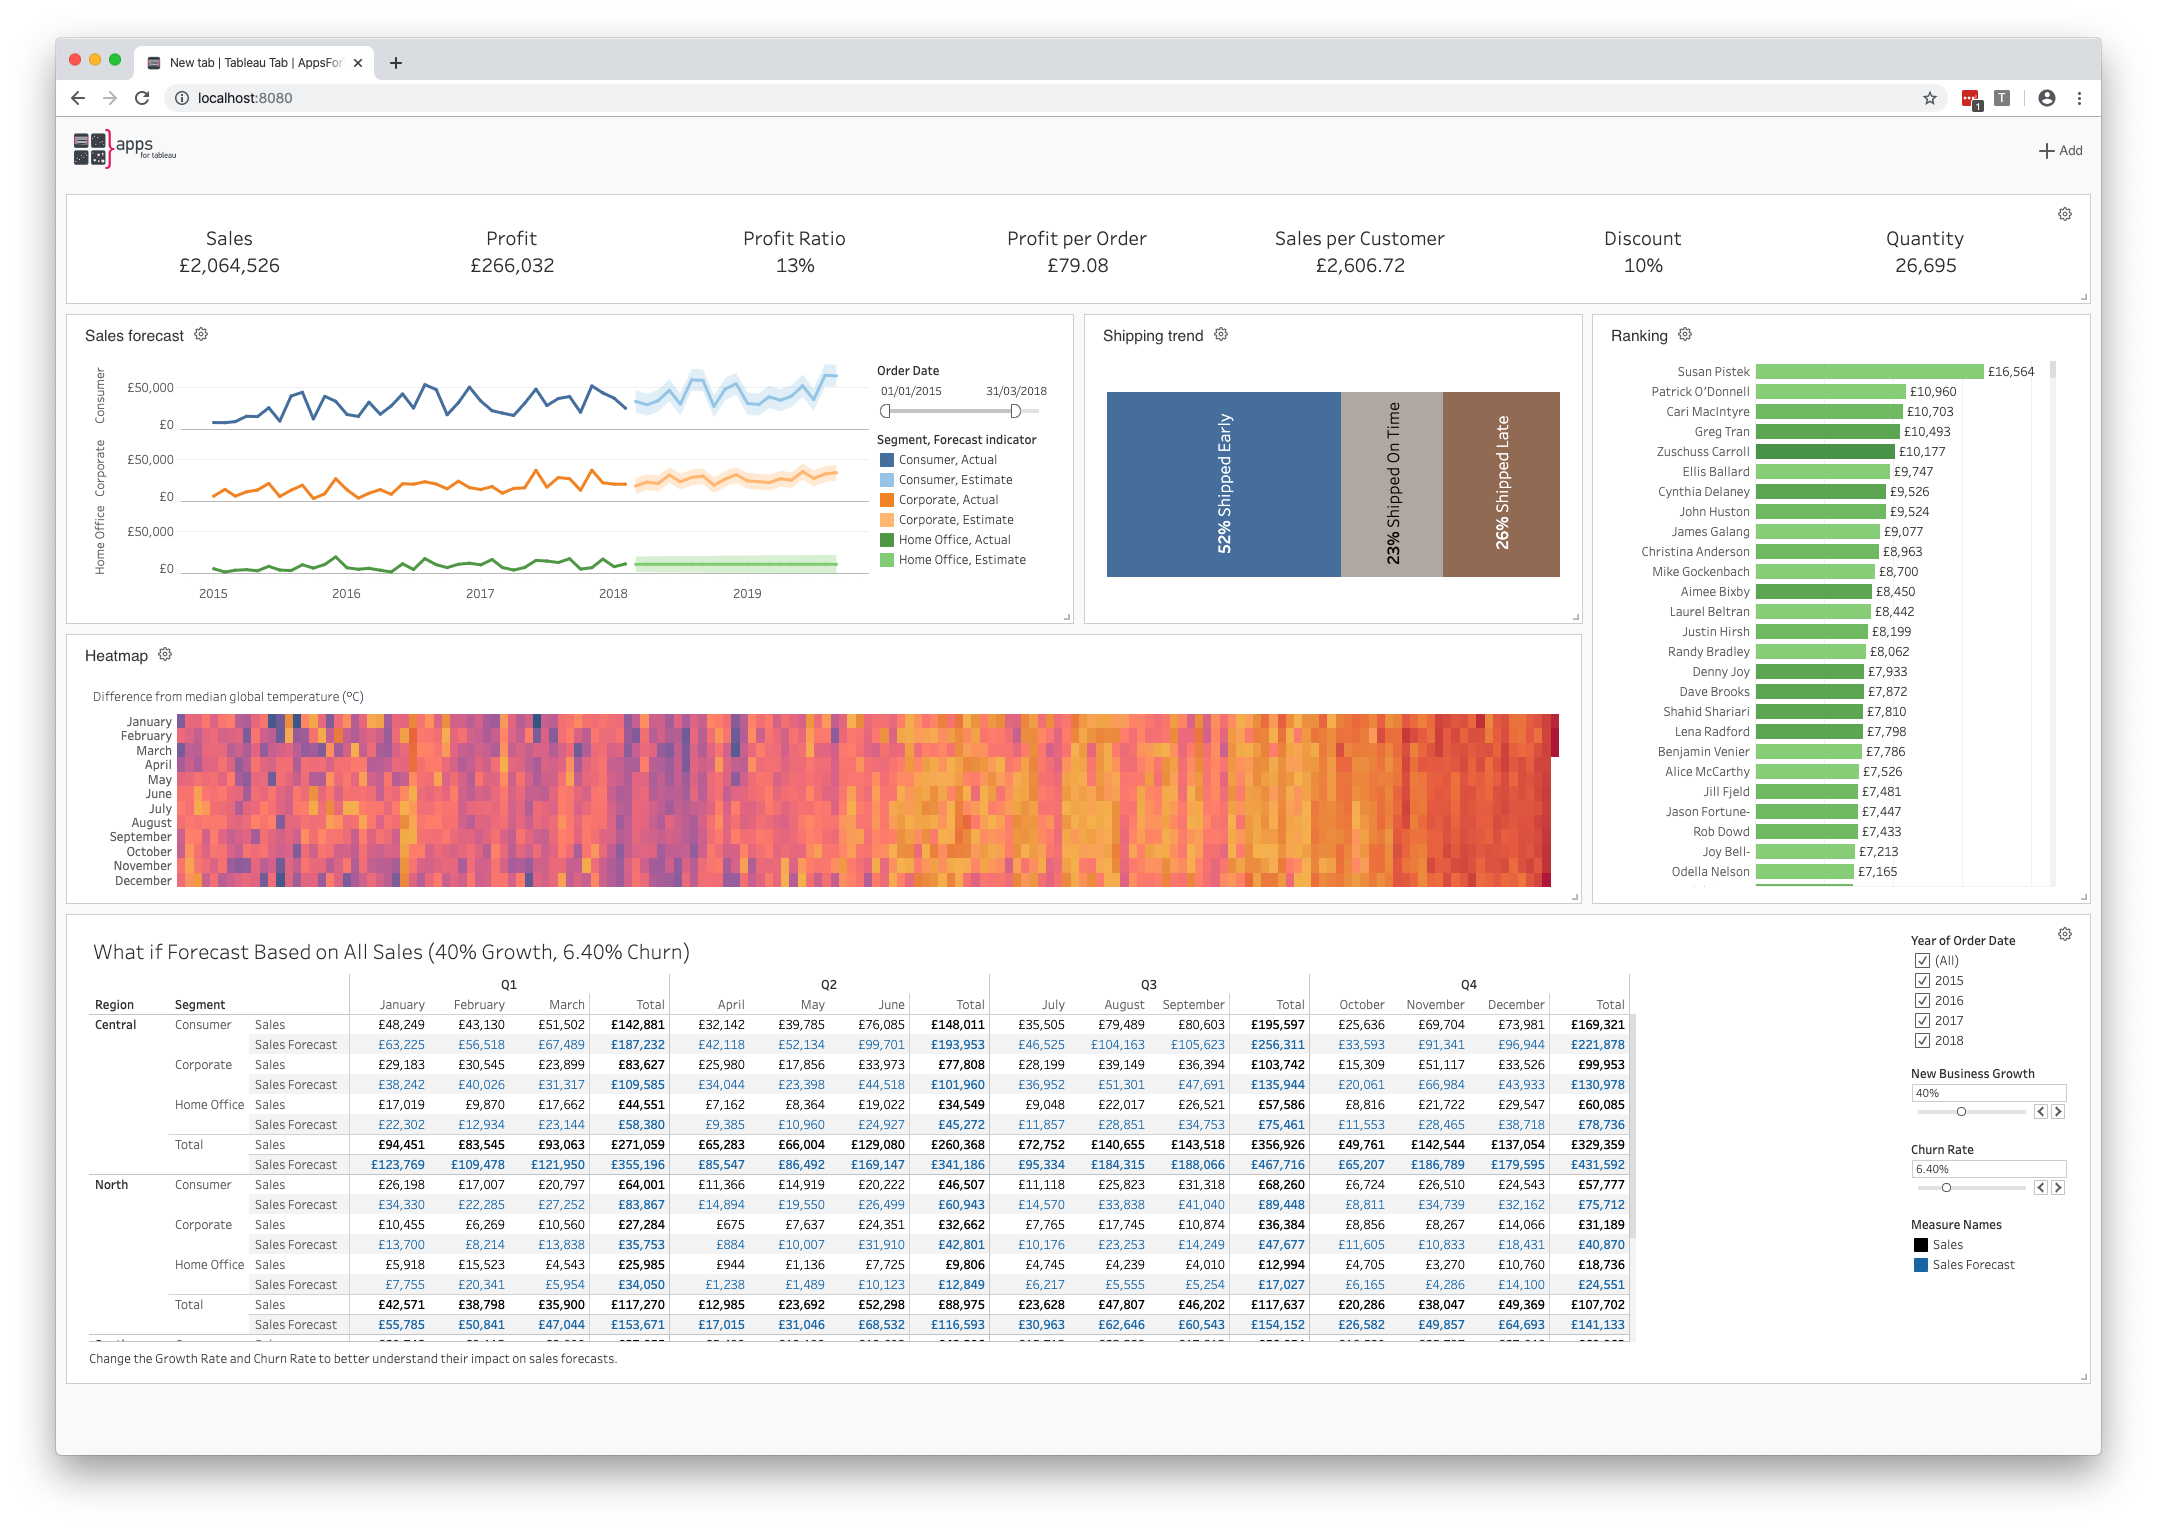
I didn’t have much experience in developing extensions for Tableau (yet!) so I had to start simple. Everytime I open a new tab, I‘d like to see my personal dashboards with information relevant to me. How cool would it be to show sheets or dashboards within a new tab, every time you open a new tab in the browser. After talking about my idea’s with Merlijn, I thought it would be a pretty fun and great way to start getting experience with Tableau API‘s and capabilities.


The Goal
Allow users to embed external sheets and/or dashboards on a grid for maximal flexibility. A Chrome extension written in VueJS that allows users to configure and setup multiple worksheets or dashboards within a single overview. Users are able to drag and drop and resize the worksheets and dashboards in the way they like it! Within a few hours I came up with the following result:
New features
Mail Scheduler
While being unexperienced in developing extensions, there were already some tickets that I could work on. One issue was allowing users in the Tableau Mail Scheduler to set multiple users as admin.
It was an easy, but long overdue feature but it’s available now!
Dashboard Usage
Another open feature was for the Dashboard Usage extension to allow Tableau users to send custom metrics and dimensions to Google Analytics. Managers can track and follow Calculated Fields within sheets and dashboards. Example: on Tableau server you can create a calculated fields for the current logged in user. This allows end-users to track for example user usage, or dashboard usage.
In many cases multiple data values (within the result of the sheet or selected marks) are selected. These data values will be joined/concatenate together with a separator and sent to Google Analytics!
Greetings,
Yoram de Langen – Developer
We love to make solutions and help Tableau users to do things more efficiently. If you have feedback, ideas, questions or need support, please make sure to share it with us! Also, don’t forget to follow us on social media for our latest news and updates.