Agility, Creativity, and User-friendliness in Tableau with ShowMeMore and SuperTables
As part of our initiative, Extensions for Good, we gifted our range of premium Tableau Extensions to WWF to support their internal organizational activities. Thanks to ShowMeMore, the WWF teams can get creative and easily visualize complex internal processes to present to stakeholders. Furthermore, with the help of SuperTables, the regular users at the company can save time and perform financial reporting in Tableau without having to leave its secure and governed environment.
WWF
The World Wildlife Fund is an independent non-profit conservation organization active in nearly 100 countries. WWF collaborates with people worldwide to develop and deliver innovative solutions that protect communities, wildlife, and the places in which they live. Their ambition is to set nature on the path to recovery in the coming decade for the benefit of people and wildlife. Working with many others, people must protect and restore natural habitats, stop the mass extinction of wildlife, and make the way we produce and consume sustainable.
Discovering Extensions
The IT team of WWF International is responsible for running projects, partnerships, and global financials. They have been using Tableau for at least seven years. Read how Tableau helps WWF bring conservation to life through data here. They are responsible for setting up a network that allows their thousands of users worldwide to access Tableau.
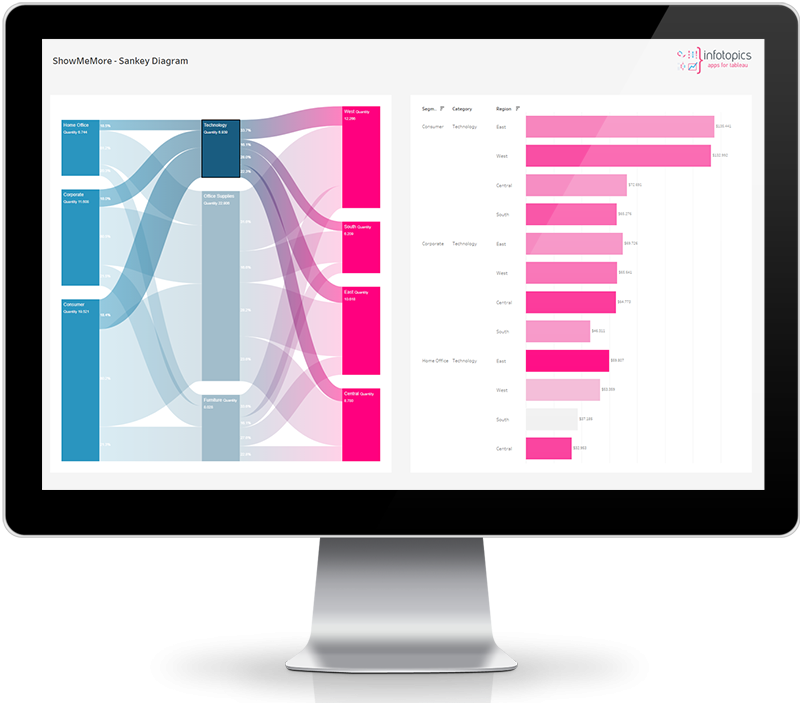
One of the international users who takes care of global financial reports was looking for additional tools in Tableau to facilitate reporting. He was looking for a specific visualization type that was not readily available in Tableau. Through some research, the WWF team discovered ShowMeMore, particularly the Sankey Diagram.

*Example of Sankey Diagram in ShowMeMore
Creativity and flexibility with ShowMeMore
Being such a big organization, WWF International often needs to explain to their partners some of their financial flows. Typically, funding comes from the government and goes to a national office, which then invests in one of the project offices. Sometimes, the flow doesn’t stop there but continues either to one of the other offices or to a third-party contractor. It is often difficult to describe how the flow works.
“Thanks to the Sankey Diagram in ShowMeMore, the team is now able to understandably visualize all flows and present them easily to the stakeholders.”
– Samuel Harper, Head Global IT Business Systems at WWF

Financial Reporting with SuperTables
Apart from ShowMeMore, WWF International is beginning to implement the SuperTables Extension. Previously, the organization has tried to do financial reports in Tableau but found it clunky and challenging for the financial users. This is because these users typically do not have a technical background. SuperTables allowed them to do some slicing and dicing and pivot around with the data, which felt way more comfortable for the financial people. They are typically used to working with Excel, and SuperTables offers them many Excel-like features in Tableau.
Summary
Thanks to SuperTables and ShowMeMore, WWF International could bring more users into the viewing of their reports and enable more people to make reports more easily. The teams can save time on various tasks, be creative with what they’re trying to do, and include people with no IT background in analyzing and creating reports and visualizations.